当前位置:网站首页>Ml self realization /knn/ classification / weightlessness
Ml self realization /knn/ classification / weightlessness
2022-07-08 01:58:00 【xcrj】
brief introduction
KNN(K Nearest Neighbors)
- It can be used for classification problems and regression problems
- Classification problem and regression problem are divided into whether to take weight
give an example
Introduce
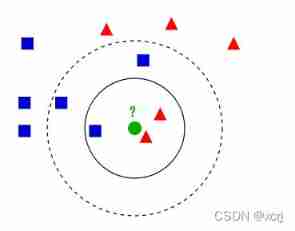
- There are already red triangles and blue squares
- What type should the newly entered green dot belong to ( Red triangle or blue square )
- When K=3 when , find 1 A blue square and 2 A red triangle , The minority is subordinate to the majority , Think that the newly entered green dot is a red triangle category
- In extreme cases , When K=1 when , What shape is the figure closest to the newly entered green dot , What shape is the newly entered green dot
- In extreme cases , When K= When the number of samples in the training set , Which category of training set samples has the largest number of graphics , The newly entered green dot belongs to this shape
principle
KNN(K Nearest Neighbors)
- K Nearest neighbor algorithm
- First find K The nearest neighbor , The minority obeys the majority
- New input instance , Find the most similar instance in the training data set ( near ) Of K An example , this K The majority of the instances belong to a category , Just classify the input instance into this category
Similarity measure
similarity
- Similarity is measured by distance
- The more similar , Represents the closer the distance between the input instance and the training instance
Distance definition
Set up feature space X X X yes m Dimension real number vector space R n R^n Rn, x i , x j ∈ X x_i,x_j\in X xi,xj∈X, x i = ( x i ( 1 ) , x i ( 2 ) , . . . , x i ( m ) ) T x_i=(x_i^{(1)},x_i^{(2)},...,x_i^{(m)})^T xi=(xi(1),xi(2),...,xi(m))T, x j = ( x j ( 1 ) , x j ( 2 ) , . . . , x j ( m ) ) T x_j=(x_j^{(1)},x_j^{(2)},...,x_j^{(m)})^T xj=(xj(1),xj(2),...,xj(m))T
- x i , x j x_i,x_j xi,xj Of L p L_p Lp distance : L p ( x i , x j ) = ( ∑ l = 1 m ∣ x i ( l ) − x j ( l ) ∣ p ) 1 p L_p(x_i,x_j)=\Big(\sum\limits_{l=1}^m|x_i^{(l)}-x_j^{(l)}|^p\Big)^{\frac{1}{p}} Lp(xi,xj)=(l=1∑m∣xi(l)−xj(l)∣p)p1
- p = 2 p=2 p=2 Euclidean distance : L 2 ( x i , x j ) = ( ∑ l = 1 m ∣ x i ( l ) − x j ( l ) ∣ 2 ) 1 2 L_2(x_i,x_j)=\Big(\sum\limits_{l=1}^m|x_i^{(l)}-x_j^{(l)}|^2\Big)^{\frac{1}{2}} L2(xi,xj)=(l=1∑m∣xi(l)−xj(l)∣2)21
K Values determine
- According to the example ,K=1 and K= The number of samples in the training set is not appropriate K value , So how to determine 1 A suitable size K value
- In the application ,K The value is usually a smaller value , Cross validation is usually used to select the best K value .
Code
Introduce
- Use sklearn Digital data set provided , It consists of 1797 Composed of handwritten digital images , Each number consists of 8x8 The pixel value vector of .
import numpy as np
import matplotlib.pyplot as plt
from sklearn.datasets import load_digits
from sklearn.model_selection import train_test_split

np.random.seed(1)


def get_data_set():
    #  Digital data sets , Each number consists of 8x8 It's made up of pixels
    digits = load_digits()
    # data:8x8 Pixel image ;target: The number represented by the image
    X, y = digits.data, digits.target

    #  Sample display  0~9 Picture number of
    # figure width=10, height=8》 stay figure Add a subgraph ,10 individual axes, Each horizontal axis span =2, Longitudinal axis span =5
    #  You know pyplot Use :figure》figure On axes( You can draw more )》 stay axes Drawing on top
    fig = plt.figure(figsize=(10, 8))
    for i in range(10):
        #  Add axes to fig in  rows=2,column=5,index=i+1: It means the number from left to right, from top to bottom ax
        ax = fig.add_subplot(2, 5, i + 1)
        #  stay axes Show pictures on ,imshow=imageshow,cmap=Colormap
        plt.imshow(X[i].reshape((8, 8)), cmap='gray')
    plt.show()

    #  The data set is divided into training set and test set
    #  for example :X_train.shape=(1347,64); y_train.shape=(1347,); X_test.shape=(450,64); y_test.shape=(450,)
    X_train, X_test, y_train, y_test = train_test_split(X, y)
    print('X_train.shape=', X_train.shape)
    print('y_train.shape=', y_train.shape)
    print('X_test.shape=', X_test.shape)
    print('y_test.shape=', y_test.shape)

    data_set = DataSet(X_train, y_train, X_test, y_test)
    return data_set


class DataSet(object):
    """ X_train  Training set samples  y_train  Training set sample value  X_test  Test set samples  y_test  Test set sample values  """

    def __init__(self, X_train, y_train, X_test, y_test):
        self.X_train = X_train
        self.y_train = y_train
        self.X_test = X_test
        self.y_test = y_test


class K_NN():
    """ k-nearest-neighbor  class  """

    def __init__(self, X, y):
        """ :param X: X_train :param y: y_train """
        self.X = X
        self.y = y

    def euclidean_distance(self, X):
        """ X and X_train The European distance of  """
        # X.shape result (n,64) namely n_samples=n
        print("X.shape=", X.shape)
        m, _ = X.shape
        # axis=1, To sum up ;axis=0, Summation
        # L2 yes (n,1) Matrix
        L2 = [np.sqrt(np.sum((self.X - X[i]) ** 2, axis=1)) for i in range(m)]
        # array turn ndarray
        return np.array(L2)

    def hypothesis(self, X, k=1):
        """ X: Data to be predicted , matrix  k: distance X Current k Objects  """
        # step1: Calculate the Euclidean distance
        dists = self.euclidean_distance(X)

        # step 2:  find k The nearest neighbors and the category of these neighbors
        #  Each column is sorted from small to small , Then take each column k Subscripts of elements
        idxk = np.argsort(dists)[:, :k]
        print("idxk.shape=", idxk.shape)
        # y_idxk It's a matrix (n,k)
        y_idxk = self.y[idxk]
        print("y_idxk.shape=", y_idxk.shape)

        if k == 1:
            #  Switch to row vector , Easy to show
            return y_idxk.T
        else:
            m, _ = X.shape
            # y_idxk It's an array (n,k)》max_votes It's an array (n,1)
            #  vote  key yes 1 Anonymous functions , Parameter is y_idxk》 Statistics y_idxk[i] The number of occurrences of each element in 》max Then the element with the most occurrences is returned ( The whole process is that the minority obeys the majority )
            max_votes = [max(y_idxk[i], key=list(y_idxk[i]).count) for i in range(m)]
            return max_votes


def evaluate_model(knn, X_test, y_test):
    y_p_test1 = knn.hypothesis(X_test, k=1)
    test_acc1 = np.sum(y_p_test1[0] == y_test) / len(y_p_test1[0]) * 100
    print("k=1 when , Test accuracy :", test_acc1)
    print("---------------------")

    y_p_test3 = knn.hypothesis(X_test, k=3)
    test_acc3 = np.sum(y_p_test3 == y_test) / len(y_p_test3) * 100
    print("k=3 when , Test accuracy :", test_acc3)
    print("---------------------")

    y_p_test5 = knn.hypothesis(X_test, k=5)
    test_acc5 = np.sum(y_p_test5 == y_test) / len(y_p_test5) * 100
    print("k=5 when , Test accuracy :", test_acc5)
    print("---------------------")


def show_result(knn, data_set):
    """  Show training results  """
    print("k=1,1 The nearest neighbor ")
    # data_set.X_test[0] yes tuple type
    n = data_set.X_test[0].shape[0]
    # data_set.X_test[0].reshape(-1,n) take (64,) To (1,64) matrix
    print(" Forecast category :", knn.hypothesis(data_set.X_test[0].reshape(-1, n), k=1))
    print(" Real category :", data_set.y_test[0])
    print("---------------------")

    print("k=5,5 The nearest neighbor ")
    n = data_set.X_test[20].shape[0]
    print(" Forecast category :", knn.hypothesis(data_set.X_test[20].reshape(-1, n), k=5))
    print(" Real category :", data_set.y_test[20])
    print("---------------------")

    print(" test 10 Row data x5~x14;k=1,1 The nearest neighbor ")
    print(" Forecast categories :", knn.hypothesis(data_set.X_test[5:15], k=1))
    print(" Real categories :", data_set.y_test[5:15])
    print("---------------------")

    print(" test 10 Row data x5~x14;k=4,4 The nearest neighbor ")
    print(" Forecast categories :", knn.hypothesis(data_set.X_test[5:15], k=4))
    print(" Real categories :", data_set.y_test[5:15])
    print("---------------------")


def main():
    #  Get data set 》 Divide the data set 》 Show dataset
    data_set = get_data_set()
    #  structure KNN
    knn = K_NN(data_set.X_train, data_set.y_train)
    #  Use test set evaluation model
    evaluate_model(knn, data_set.X_test, data_set.y_test)
    #  Display the results
    show_result(knn, data_set)


if __name__ == "__main__":
    main();
边栏推荐
- 什么样的MES系统才是好系统
- The body has a mysterious margin of 8px
- How to make enterprise recruitment QR code?
- Remote sensing contribution experience sharing
- How to realize batch control? MES system gives you the answer
- MySQL数据库(2)
- 电路如图,R1=2kΩ,R2=2kΩ,R3=4kΩ,Rf=4kΩ。求输出与输入关系表达式。
- ClickHouse原理解析与应用实践》读书笔记(8)
- Nanny level tutorial: Azkaban executes jar package (with test samples and results)
- Reading notes of Clickhouse principle analysis and Application Practice (7)
猜你喜欢
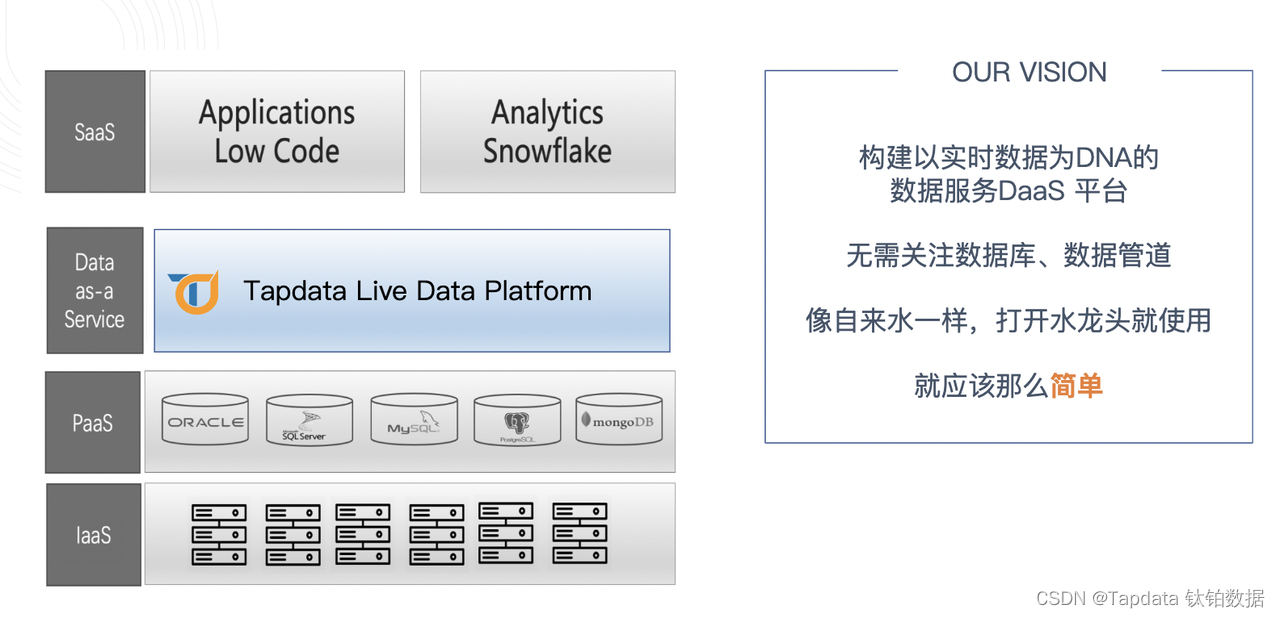
Version 2.0 of tapdata, the open source live data platform, has been released
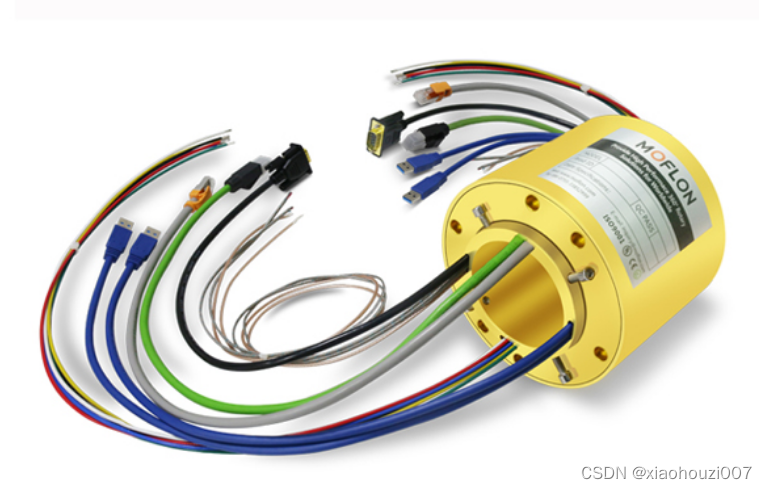
How to fix the slip ring
Can you write the software test questions?

Beaucoup d'enfants ne savent pas grand - chose sur le principe sous - jacent du cadre orm, non, ice River vous emmène 10 minutes à la main "un cadre orm minimaliste" (collectionnez - le maintenant)
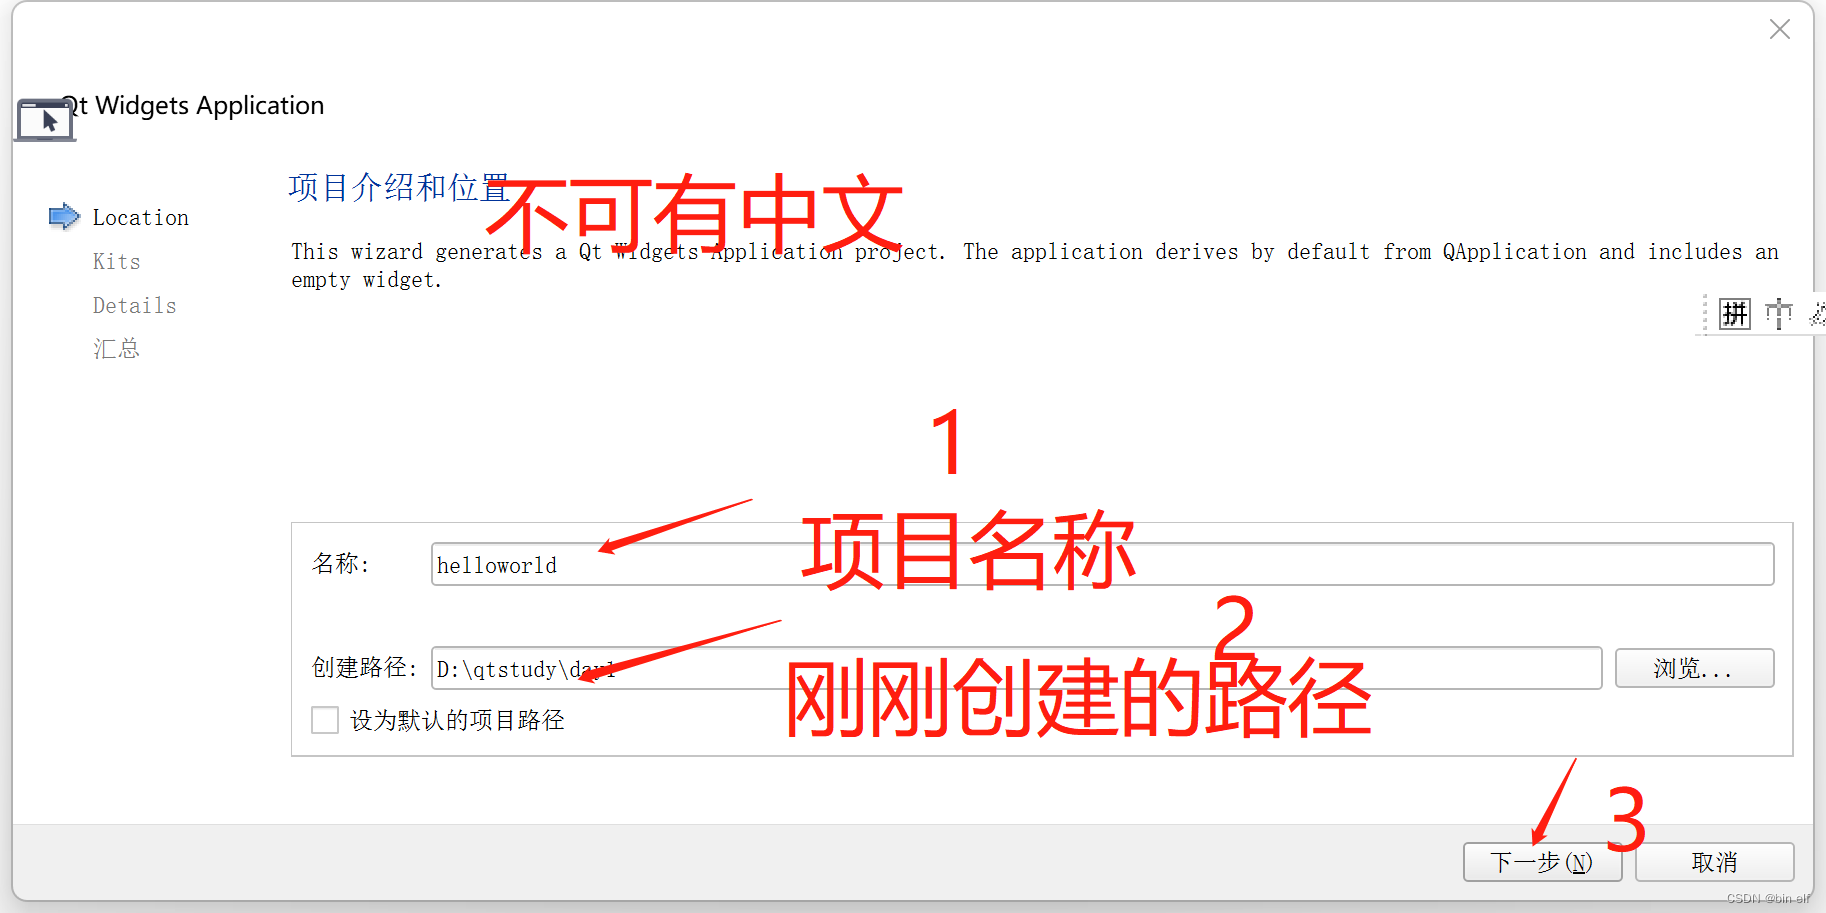
QT -- create QT program

The function of carbon brush slip ring in generator

Kwai applet guaranteed payment PHP source code packaging

Why did MySQL query not go to the index? This article will give you a comprehensive analysis
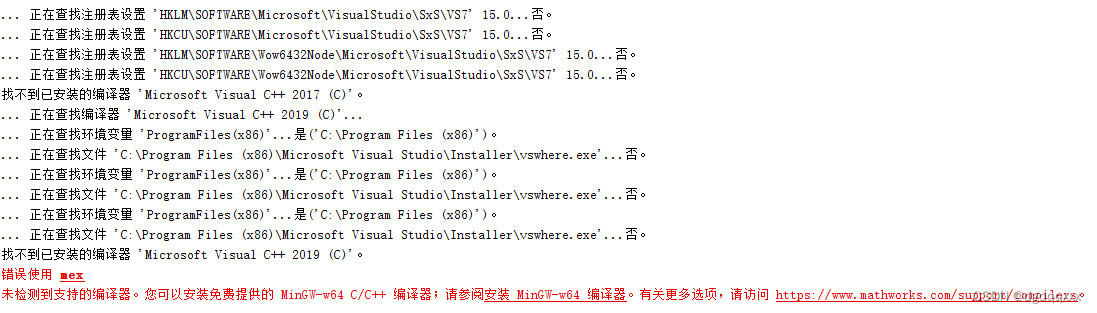
Matlab r2021b installing libsvm

日志特征选择汇总(基于天池比赛)

随机推荐
如何制作企业招聘二维码?
Introduction to Microsoft ad super Foundation
Redux usage
#797div3 A---C
很多小夥伴不太了解ORM框架的底層原理,這不,冰河帶你10分鐘手擼一個極簡版ORM框架(趕快收藏吧)
Urban land use distribution data / urban functional zoning distribution data / urban POI points of interest / vegetation type distribution
Redux使用
MySQL查询为什么没走索引?这篇文章带你全面解析
How to make the conductive slip ring signal better
Redisson distributed lock unlocking exception
云原生应用开发之 gRPC 入门
How to realize batch control? MES system gives you the answer
Codeforces Round #633 (Div. 2) B. Sorted Adjacent Differences
Nanny level tutorial: Azkaban executes jar package (with test samples and results)
The foreach map in JS cannot jump out of the loop problem and whether foreach will modify the original array
Version 2.0 de tapdata, Open Source Live Data Platform est maintenant disponible
Get familiar with XML parsing quickly
burpsuite
I don't know. The real interest rate of Huabai installment is so high
发现值守设备被攻击后分析思路