Yun Mei guides reading :
stay 《 Exhibition cloud technology interpretation 》 Special topic , Has successively launched Safety 、 Design And Intelligent recommendation article , The most stringent 8 Big security program 、 Online exhibition based on the service design method and exhibition scene intelligent recommendation building road . In this article, we will continue to understand the technology behind the mice cloud , Let's take a look at how the most important online platform in the exhibition cloud does well in performance monitoring and crash analysis .

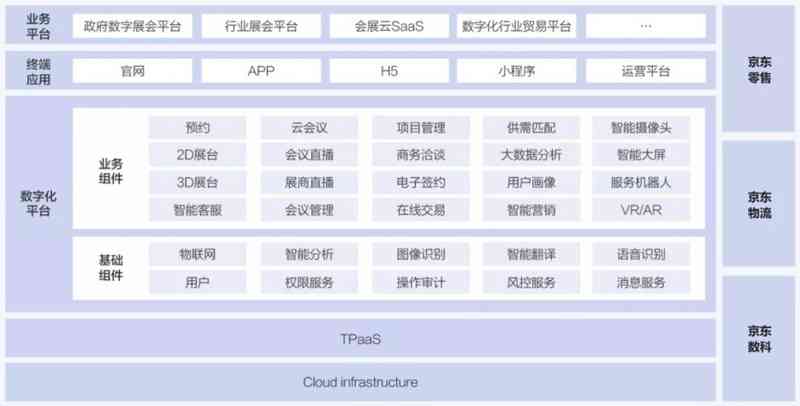
Mice cloud solutions cover Business , technology , platform , application Four levels , At the business level, it provides a cloud exhibition hall full of science and technology 、 Various modes of forum and conference, etc ; There are many solutions at the application level , Live solutions 、 Video conferencing solutions 、 Mobile R & D solutions, etc ; At the technical level, it relies on massive elastic cloud computing capability and sufficient scalable cloud storage and bandwidth resources , It integrates the capabilities of a variety of platforms in Jingdong , There's a technical middle ground 、 Data center 、 Smart midrange and business midrange capabilities , It can quickly respond to the needs of foreground applications .
As a cloud show , Finally, the external window presented to the vast number of participants must be Website 、APP、H5、 Applet Waiting line system . In Jingdong exhibition cloud , "One-stop" work style APP Solution EMOP Platform is also an important part of it , It can provide a variety of mobile terminals for mice cloud organizers , Include APP、H5、 Small program etc. , Provide full business process planning 、 Design 、 Research and development 、 operating 、 One stop service such as operation and maintenance .
Recently, China International Service Trade Fair was successfully held ( It's called the service trade association for short ) Take a new model for the first time —— Integration of online and offline exhibitions , With the help of EMOP The capability of the platform at the operation and maintenance level , For the service trade association APP The stable operation of escorts .
There are as many enterprises as 17000 More than , And the Service Trade Association APP As an important window for the external operation and maintenance of cloud Exhibition , For coming from Different sizes around the world 、 Exhibitors from different industries 、 Purchasers provide exhibitions 、 Forum meeting 、 Digital platform for negotiation and signing .
During the exhibition , Service Trade Association APP How to carry the pressure of passenger flow ? How to guarantee online APP The quality of the ? How to effectively repair online crashes ? How to improve customer retention and liveliness ?
Before looking for answers to questions , Let's take a case of Jingdong first ,2020 Beijing East 6.18 The turnover is over 2692 Billion , Record high .618 Great promotion period , JD.COM APP There are thousands of users browsing products 、 Rush purchase 、 Order, etc , Not only to withstand the pressure of 100 million class flow , And provide a good user experience , without doubt , This is inseparable from the technology behind it .
In the face of the impact of large-scale exhibition passenger flow , In the face of an emergency , How can R & D personnel quickly locate problems and fix them in time , You have to talk about what's behind it Crash analysis system and mobile performance monitoring system .

The crash system is positioned for mobile APP It provides a service platform for crash monitoring and crash module positioning , Through to APP Monitoring and analysis of crash data , To help APP Reduce the frequency of crashes , Improve user satisfaction , have Support Android、iOS Minimalist access 、 Real-time monitoring 、 Comprehensive information 、 Safe and stable 、 The statistics are detailed Other characteristics .

The crash analysis system is APP The stable operation of the system plays a role of escort , At present, it has been approved by Jingdong Wanshang 、 Jingdong home 、 Seven fresh and so on APP Validation of the , This service trade fair APP Access to the crash system , One is to monitor at any time APP, Protect the exhibition 、 Forum meeting 、 Negotiate the stable operation of functions such as signing a contract ; The other is to locate the crash module in a short time , Fix the problem in time .

- Crash capture : Support native crash 、OOM collapse 、 Custom error or exception reporting ;
- Crash analysis : Cluster analysis based on collapse module dimension , The main features of the problem can be quickly found by clustering data analysis ;
- Cross end exception : Support cross end exception module query , Cross end exception data parsing (RN、Flutter), Quickly locate cross end problems ;
- Advanced features : For a variety of abnormal information for detailed search query , Support raw data export , Support the contrast query of different query conditions .


Mobile performance monitoring system aims to establish a unified application performance access framework , Through a variety of performance monitoring programs , Collect client data , Show abnormal data , Assist to locate abnormal problems and output performance report , In order to help developers quickly find product performance problems , Optimize APP performance .

Performance analysis is like APP An old Chinese medicine doctor with pulse , All kinds of difficult and complicated diseases can be found out quickly .
During the conference, the service trade fair APP After running online , Through performance analysis, real-time perception of application startup performance 、 Page loading performance 、 Network request, etc , The problem with locating anomalies is , Protect exhibitors , Buyers , Media reporters and other good use experience .

Through the following functions : Start the monitoring 、 Caton monitoring 、 network monitoring 、webview monitor , Native PAGE monitoring and log reporting 、 Install package analysis tools 、 Memory analysis tools Performance monitoring can be realized .
( One ) Start the monitoring
Monitor the time it takes for online users to start an application and locate where the time is spent .
The start-up monitoring adopts a non-invasive way, which is divided into three stages , The time consumption of each stage of application startup is recorded :

√ The first stage : Recorded Application The initialization phase of the ;
√ The second stage : Recorded Application It takes time from initialization to the user's home page ;
√ The third stage : It records the time-consuming process from the beginning of the homepage creation to the full display ;
√ Time to start = The first stage takes time + The second stage takes time + The third stage takes time .
in addition , The method execution time is also reported for the main life cycle methods applied in the start-up period , Assist users to disassemble the start-up process through intuitive data .
( Two ) Caton monitoring
There are many reasons for this , among , The impact of the main thread stuck is the most serious , May cause the user to be unable to use the mobile normally APP Any business on .
Introduction to the principle of Caton monitoring :
① APP UI Thread message mechanism
APP UI Thread is Looper Threads , Maintain a message queue in the thread ,Looper Tasks in the cyclic consumption message queue , If there are time-consuming operations in the message queue , Will affect UI Task mapping , Cause the interface to get stuck .
② collection UI The run time of the thread message
Mobile (Android/iOS) It's all used AOP Thought , To the whole UI The thread's message processing process is monitored , The execution time of each message is collected .
③ The Caton condition ( Message execution time > Carton threshold )
After collecting the execution time of each message , Automatically compare the stuck threshold , A message that exceeds the threshold is considered to take too long to execute , It will cause the main route to get stuck .
④ sampling
While executing the main thread , The stack of the sampling thread to the main thread 、cpu And so on . But the sampling thread has to sleep for a period of time , The main reason for this is not to disturb most of the short messages of the main thread , To rob cpu resources , Cause performance degradation .

( 3、 ... and ) network monitoring
There are two categories of network monitoring data : Native network monitoring and picture monitor .
Native network monitoring mainly monitors the performance of the interface and abnormal data ; Picture monitoring is a new addition to network monitoring CDN Node data reporting .
Introduction of network monitoring technology scheme :
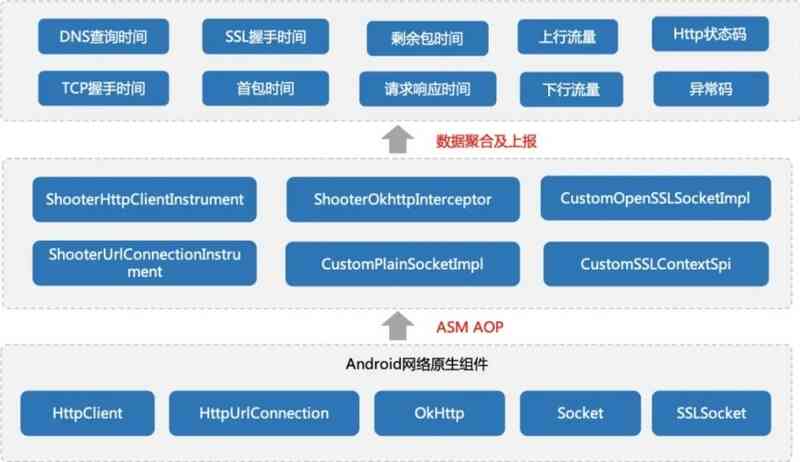
① use ASM Bytecode editing technology Hook here we are App The network behavior of the underlying underlying underlying network components ;
② collection UI The run time of the thread message
Mobile (Android/iOS) It's all used AOP Thought , To the whole UI The thread's message processing process is monitored , The execution time of each message is collected .
③ The whole network monitoring includes performance data and abnormal data , It meets the basic abnormal alarm monitoring , It also has the ability to analyze the performance data on the aggregation line ;

( Four ) Native PAGE performance monitoring
The native PAGE monitoring adopts a more lightweight data collection strategy , Mainly through the operation period , The frame rate of the acquisition device ,CPU, Memory , Number of threads , Traffic data , To reflect the current page runtime performance .
Introduction to the technical scheme :
① Frame rate acquisition
The frame rate collection scheme is to monitor the refresh event of the page through the callback of the system , When the page starts to refresh, it calculates the drawing time per frame of the page , By the number of frames / Total time to calculate the true frame rate .
② CPU、 Memory 、 Thread data collection
CPU, Memory usage and the number of threads can reflect the resource consumption of native pages , The performance monitoring system adopts the method of equal time interval sampling to achieve sample collection .
- CPU Monitoring can feed back the current page CPU usage , It can feed back the problem of power consumption ;
- Memory usage can indicate the current page consumption of memory and JVM Available memory size in , So as to calculate the top rate of memory and page memory jitter ;
- The number of threads can monitor whether the number of threads in the native PAGE exceeds the limit , The number of monitoring threads exceeds the limit OOM problem .
( 5、 ... and )webview Introduction of monitoring technology scheme
Jingdong performance monitoring system supports Webview Tencent X5 Kernel performance monitoring , The core indicators of monitoring are window.perfromance.timing Parameters , This parameter records the whole of webview The loading process is time consuming , As shown in the figure below :

Data returned through the browser kernel , You can calculate the total page load time 、 Network requests take time 、DOM Loading time 、 White screen time is the performance indicators such as user waiting time .
The above two systems enable the FTC at the monitoring level APP Principle and implementation of , They all come from Jingdong EMOP platform , The platform is an enterprise mobile R & D platform , combination “ Jingdong system ”APP R & D experience and best practices , One stop solution for mobile development , Can help enterprises to build a strong mobile platform , Quickly create high quality APP、 All kinds of small programs and other mobile terminal products , Support new business development of enterprises , Help the smooth implementation of enterprise mobile transformation .

EMOP Support private cloud and public cloud deployment , There are four stable development frameworks ,7 Mobile development technology and component capabilities , From the “ Mobile Jingdong ”APP R & D best practices , Under the premise of realizing multi service closed-loop , Solve the cost 、 quality 、 efficiency 、 Standard questions , Help multiple teams APP The quality of R & D has been improved 、 Cost savings , For details, please see : [](https://emop.jd.com/home/) https://emop.jd.com/home/.
Recommended reading :
- Exhibition cloud technology interpretation | In depth interpretation of the exhibition scene, intelligent recommendation building road
- Exhibition cloud technology interpretation | Online exhibition based on service design
- Exhibition cloud technology interpretation | Multiple security guarantees escort the exhibition on the cloud
Welcome to click 【 Jingdong Zhilian cloud 】, Learn about the developer community
More wonderful technology practice and exclusive dry goods analysis
Welcome to your attention 【 Jingdong Zhilian cloud Developer 】 official account


