当前位置:网站首页>Spatial domain and frequency domain image compression of images
Spatial domain and frequency domain image compression of images
2022-07-06 22:18:00 【Rusian_ Stand】
What is image spatial domain( Space domain ) and frequency domain( frequency domain )?
Graphic spatial domain Refers to the color space of the image , Based on the direct processing of image pixels . In the space domain (x,y) It is considered to be a point in two-dimensional space , Count Word image f(x,y)=color It is a discrete function defined on a rectangular region in two-dimensional space .
Graphic frequency domain It refers to describing the characteristics of an image with frequency as an independent variable , The spatial variation of the pixel value of an image can be decomposed into different amplitudes 、 Linear superposition of simple vibration functions of spatial frequency and phase . The composition and distribution of various spatial frequency components in an image is called Image spectrum .
It can be transformed by some means, such as ( The Fourier transform , Discrete cosine transform , Wavelet transform, etc ) Process the image in the frequency domain . Because some characteristics are outstanding in the frequency domain , Easy to handle .
The relationship between the two :
Spatial domain and frequency domain can be converted to each other ; Apply Two dimensional discrete Fourier transform or Wavelet transform , The image can be converted from spatial domain to frequency domain ; adopt Corresponding inverse transformation It can also be converted back to spatial domain images , That is, images that people can recognize directly .
Image frequency domain filtering
The filtering of two-dimensional digital images is mainly divided into Spatial domain filtering and spectrum shaping
Spatial domain filtering : Use various templates to directly interact with images Convolution operation
spectrum shaping : When implementing some image processing , Frequency domain processing is simpler than spatial domain ; For digital images in spatial domain , according to Convolution theorem Can pass Fourier transformation take Spatial convolution filtering Transformation for spectrum shaping , however Then the frequency domain filtered image Reverse transformation Back to space domain
The frequency of the image : An indicator of the intensity of gray value change , It's the gradient of gray level in plane space .
Low frequency of image
Low frequency That is, the color changes slowly , That is, ash Degrees change slowly , It means that it is An area of continuous gradient , This part is low frequency . For an image , Except for the high frequency, it is the low frequency , That is, the content within the edge is low frequency , The content in the edge is most of the information of the image , That is, the general outline and outline of the image , Is the approximate information of the image .
Low frequency of image
High frequency means that the frequency changes quickly . When does the gray change quickly in the image ? That is, there is a great difference in gray between adjacent areas , This is fast change . Image , One Edges of images and backgrounds , There are usually obvious differences , That is to say, change the sideline , Gray changes quickly , That is, the parts with high change frequency . therefore , The gray value of the image edge changes quickly , It corresponds to the high frequency , That is, the edge of the high-frequency display image . The details of the image also belong to the area where the gray value changes sharply , Because of the sharp change of gray value , The details will appear .
in addition noise ( Noise ) In the same way , In the position of a pixel , The reason is noise , It's because it's different from the normal dot color , In other words, the gray value of the pixel is obviously different , That is, the gray level changes rapidly , So it's the high-frequency part , So there is noise at high frequency .
The frequency domain components of the results obtained from the two-dimensional discrete Fourier transform of the digital image are shown in the figure below , The upper left corner is the DC component , The four corners of the transformation result correspond to low-frequency components , The central part corresponds to the high-frequency part
For the convenience of observation , Often take transposition Method make the DC component appear in the center of the window ( Centralization ), After transformation, the center is low frequency , Outward is high frequency .
In the frequency domain , It can be easily realized Sharpening and blurring of the image :
Intercept the low-frequency component of the frequency , Make an inverse Fourier transform , What you get is the blurred image , namely Low pass filtering
Intercept the high-frequency component of the frequency , Make an inverse Fourier transform , What you get is the sharpened image , namely High pass filter
Human eyes are not sensitive to high-frequency information .
Image compression
Lossy compression
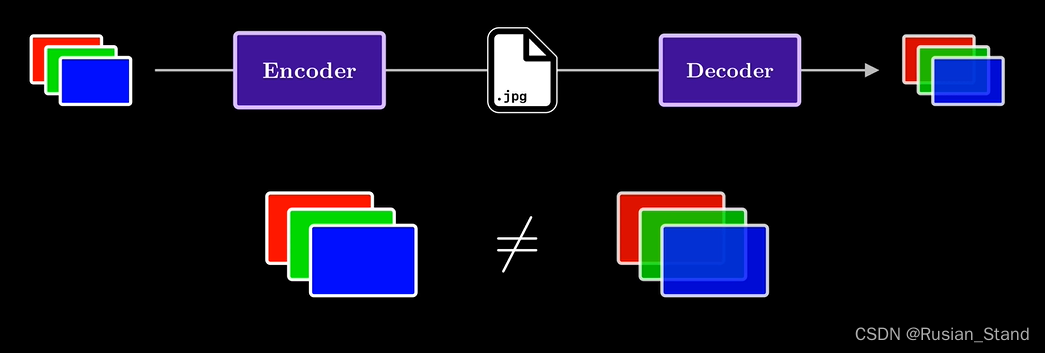
We start from the image rgb To begin , Then use the compression algorithm to encode it, which is what we store in memory , It's more compact but With our original rgb It means completely different , Therefore, part of the compression scheme also needs to define a decoding component , Transform the stored representation of our data into something that the computer can render as an image rgb Format .jpeg Part of the standard defines the code And decoding .jpeg A key point in is that the final decoded image will not be the same as the original uncompressed image , This is why we call it lossy compression in the compression part of the pipeline . We will deliberately lose information to obtain compression At the 5% level .
In image compression, what information can be discarded ?
The human eye is more sensitive to the change of brightness than to the change of color , therefore JPGE Take advantage of this .rgb Color space : From the origin to the color on the diagonal 255 255 255 You will gradually get brighter colors , actually , Indeed, tangents between these points define all possible grayscale colors , They are A direct measure of brightness .
ycbcr: Y brightness , cb and cr Components will encode colors .
One way to compress the original image is , Reduce to cbcr Sampling of components , And keep all brightness components . This technique is called chrominance subsampling or more commonly chrominance subsampling .
By way of cb and cr On the aisle 2x2 The blocks are merged into one color , It is usually difficult to see any changes after secondary sampling , We leave a quarter of the original data in each color channel , Reduce the total file size 50%, But and jpeg Image compression 5% It's a long way off .
Deleting pixels is down sampling
Look at the image from a different perspective
One way to think about images is to think of them as signals , If I slice a specific line of an image , I have a row of pixels , A certain value of each pixel is 0 To 255 Between . If we plot these values , We can get an approximate value to visualize the image as a signal . Allow us to discuss the frequency components in the image .
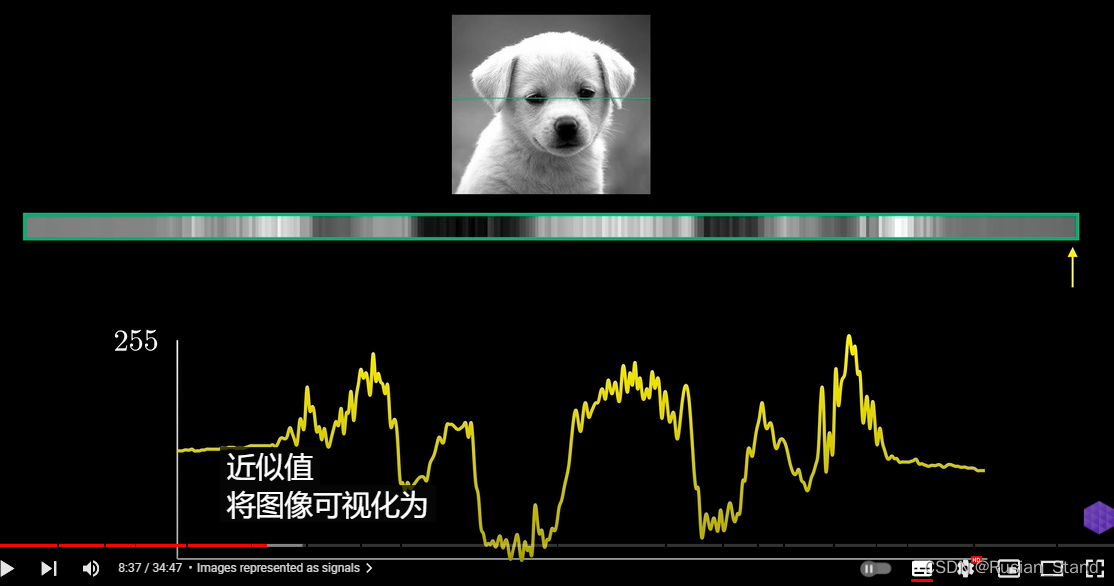
High frequency components correspond to rapid changes between pixels , Low frequency components correspond to smoother changes between pixels .

Two key points
1、 If I choose random parts of real images , Then the lower frequency component is likely to be the pixels in the region .
2、 The human visual system is usually less sensitive to high-frequency details in images .
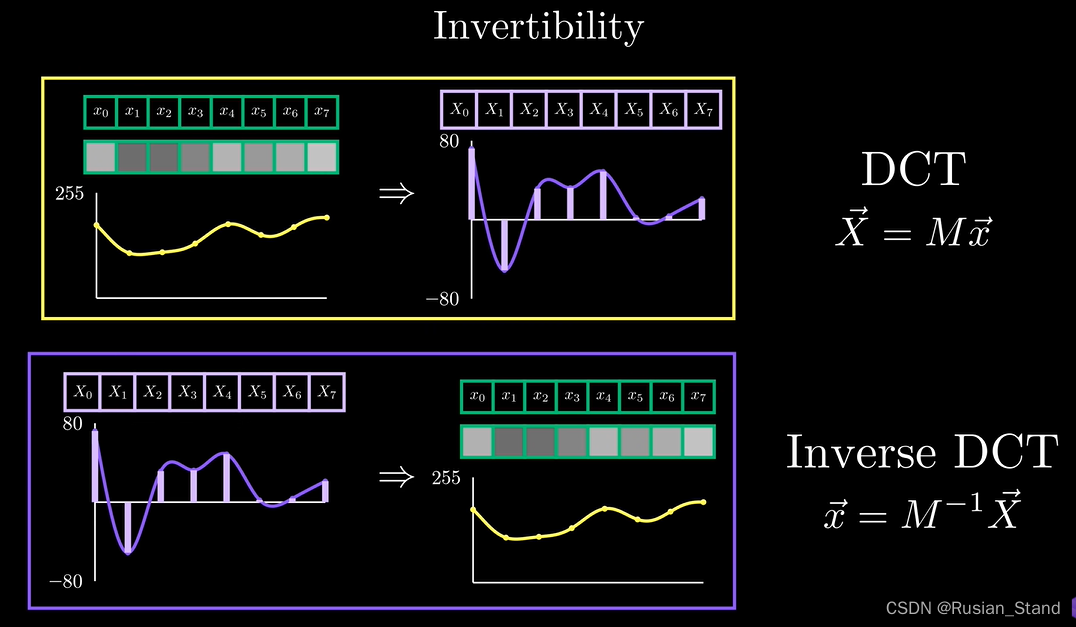
How to obtain frequency components from images
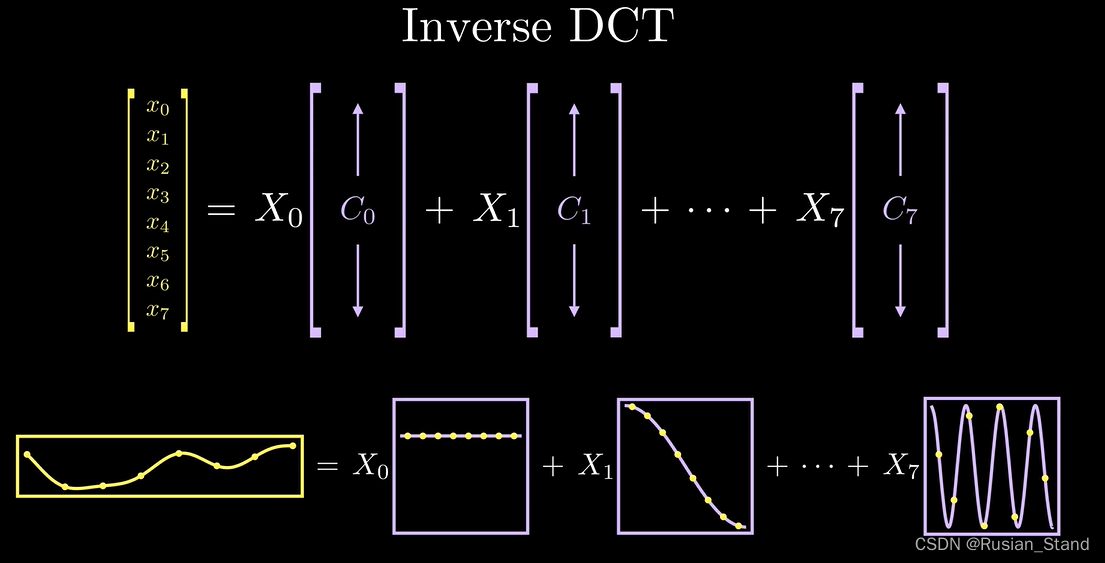
Discrete cosine transform (DCT), Suppose we only have 8 A little bit , but dct The clever and absolutely inconspicuous idea of this is 8 Points are represented as coming from Sum of sample points of cosine wave .dct Get the input of the sampling point from our original signal , And provide us with an output coefficient of the same size as that we will refer to , These coefficients represent the weights of cosine waves of different frequencies that contribute to the original signal . A good analogy is to decompose complex signals into weighted sums of simple cosine waves . The first output coefficient It seems that the frequency is 1 The cosine wave of corresponds well , And the second one. coefficient And the frequency is 2 Cosine wave correlation of .
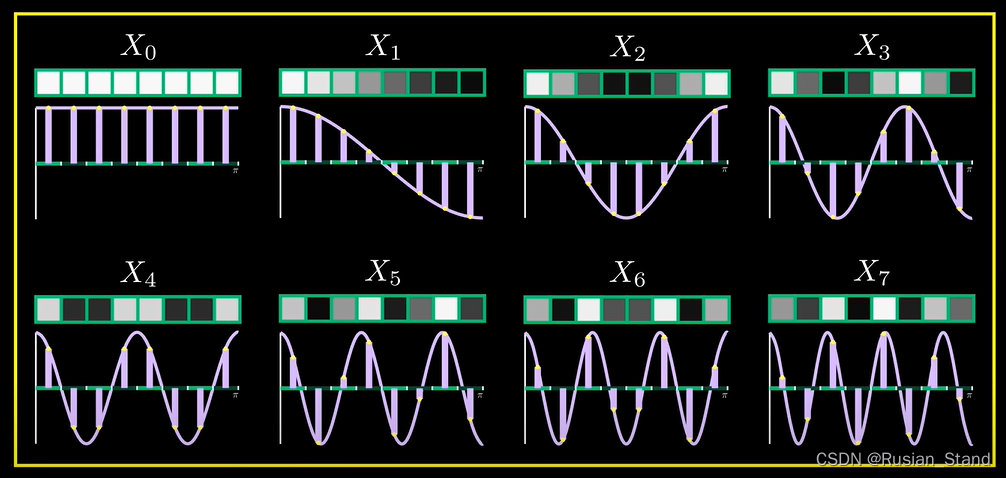
Frequency cosine wave What is it? , It is just a constant signal in terms of image , This means that it provides us with a measure of the overall brightness of a set of pixels , Brighter images will have a larger zero coefficient Compared with darker images .
jpeg how Use it exclusively
jpeg Take the image and split it 8x8 block .
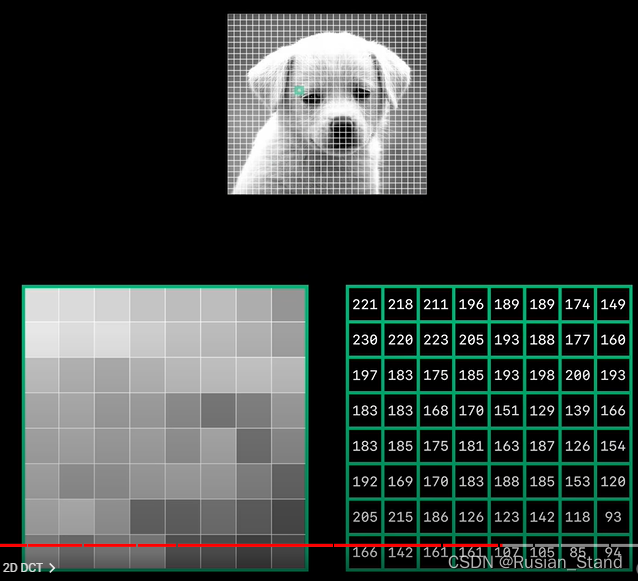
And then by subtracting 128 Concentrate their values on 0 near . Then we get the block and put dct Apply to each line of the block , Give us eight groups dct coefficient , Then apply dct To each column of the block, this process defines two dimensions dct.
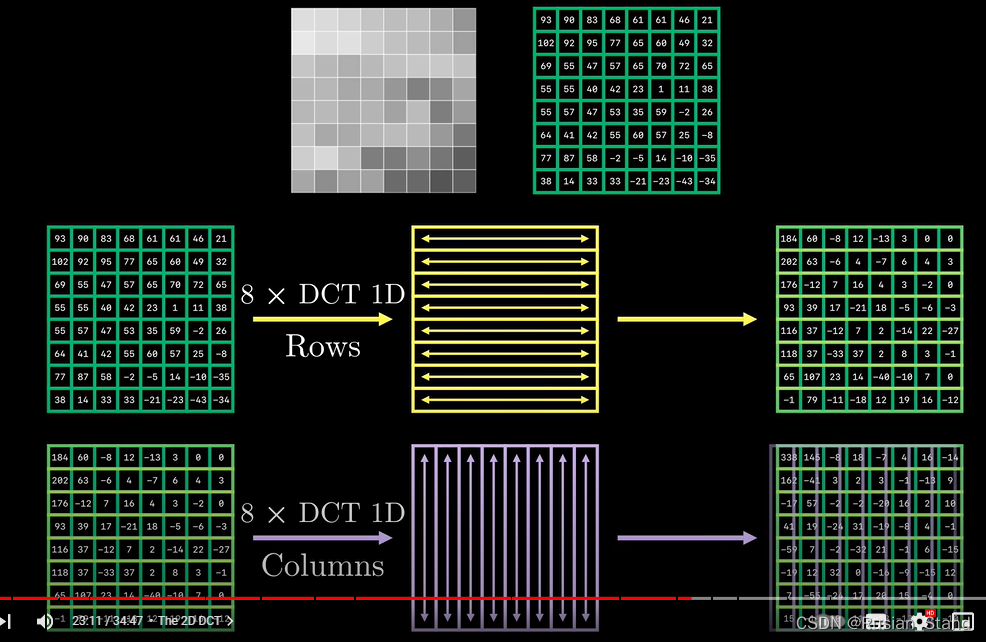
So in the end we have 64 A coefficient of , Each coefficient is in a specific 8x8 pattern On .
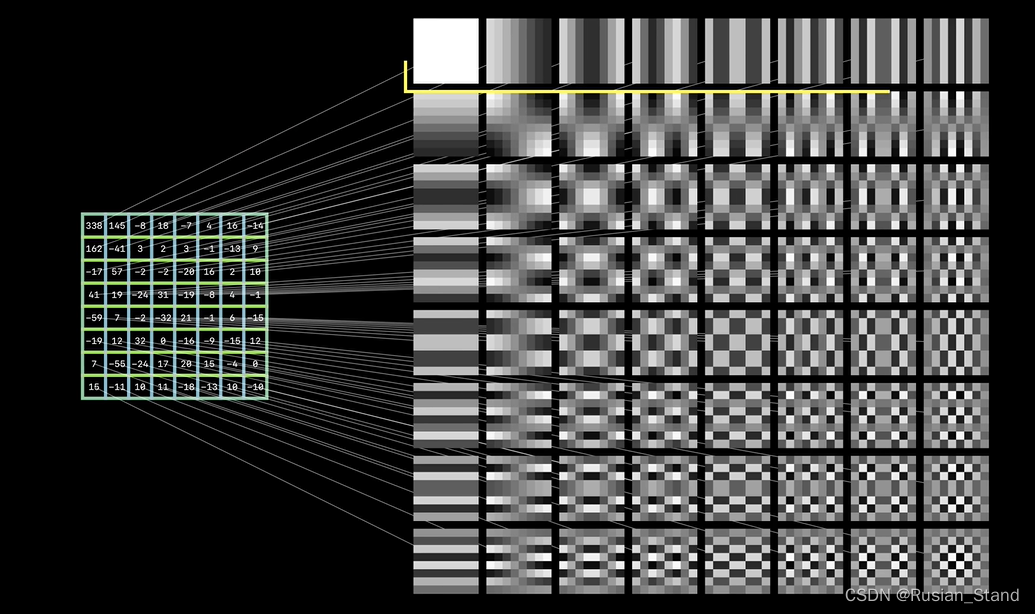 Note that the first row and the first column correspond to the early one-dimensional pattern , Other elements are combinations of these patterns , Just like in the case of one dimension , The main idea here is We can build any 8x8 block Use this 64 Images in three basic modes . But there is an interesting phenomenon , When merging a small number of coefficients , Our signals and images have looked Very close to the original image , Add dimensions again , There is no visual improvement effect .
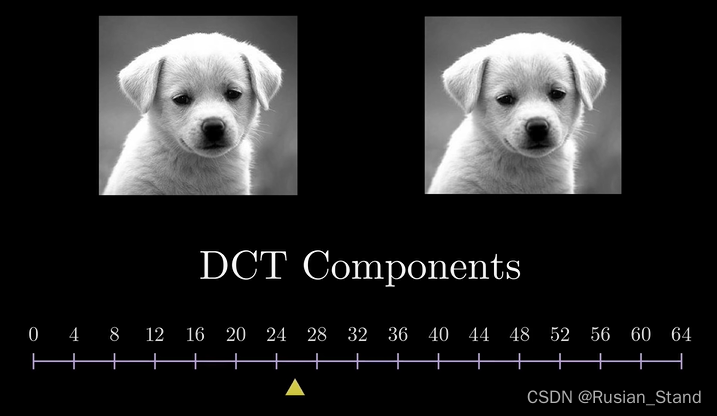
Slowly build the image after a coefficient , We basically finally get the blur of the original image , When we add dct When the coefficient is , Slowly notice how fast the image starts to look like the original image , When we get less than 25% Of dct When the coefficient is , You can hardly tell the difference between the two images , This confirms jpeg Why it applies to this particular The key aspect of fixed image is that almost all blocks are composed of the lowest frequency component , We are usually insensitive to changes in high-frequency details .
but The next natural question is how we actually do this , Remove high frequency
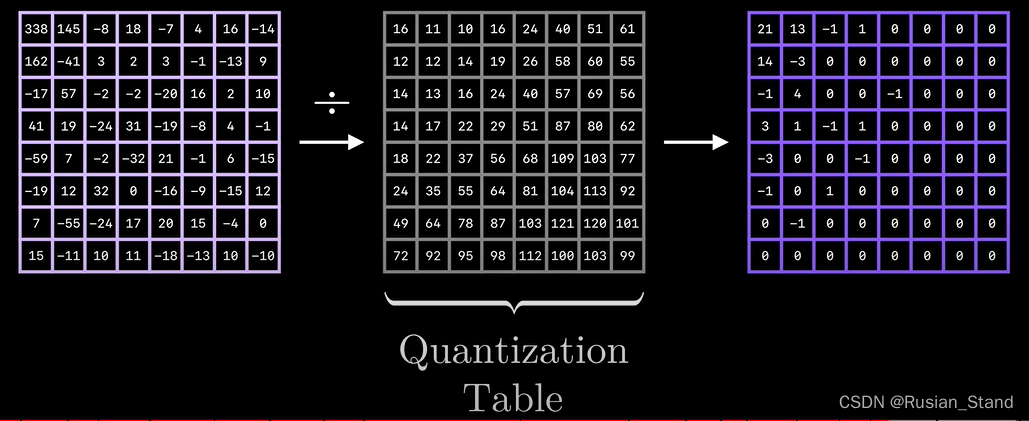
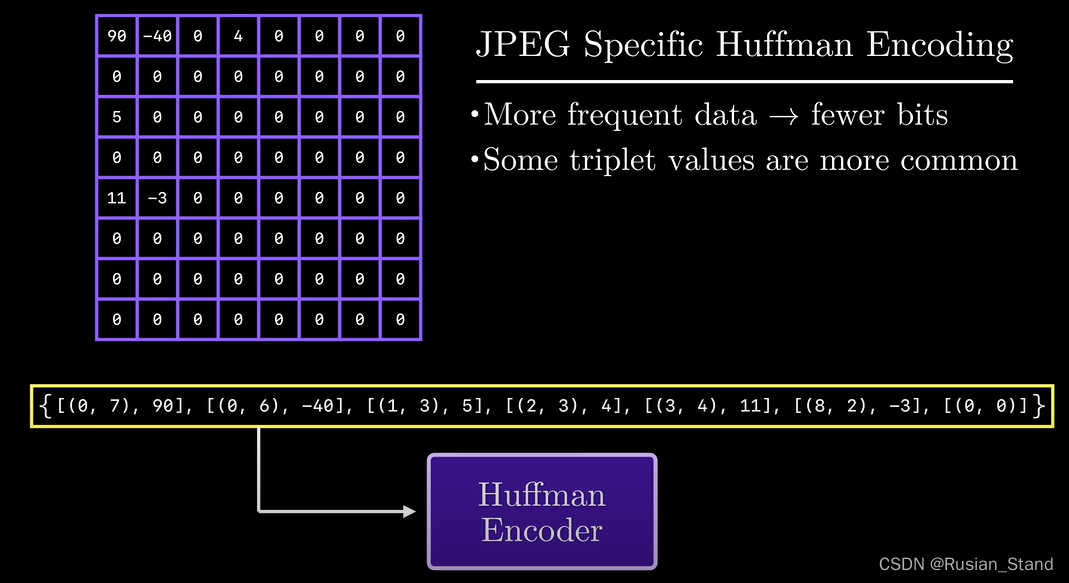
eliminate jpeg The process of higher frequency components in is called quantization . Quantification is a simple idea , Given from dct Frequency coefficient of 8x8 matrix , What we need to do is basically take the element of each scalar value and round it to an integer Keep low frequency , Remove high frequency , Then use The combination of length coding and Huffman coding reduces storage .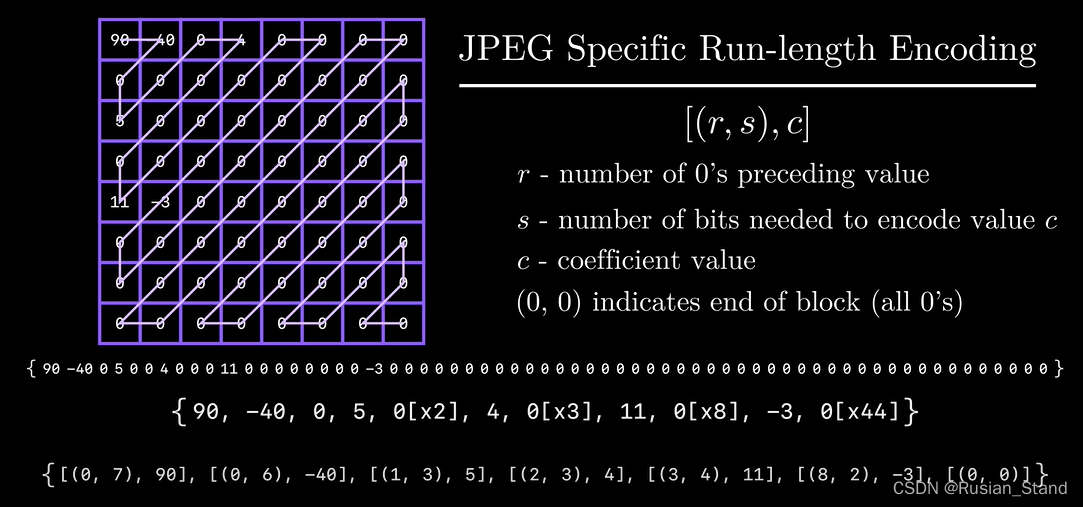
边栏推荐
- Force deduction question 500, keyboard line, JS implementation
- 关于程序员的职业操守,从《匠艺整洁之道》谈起
- PVL EDI project case
- Shell product written examination related
- Solve project cross domain problems
- A Mexican airliner bound for the United States was struck by lightning after taking off and then returned safely
- Make menuconfig has a recipe for target 'menuconfig' failed error
- C#实现水晶报表绑定数据并实现打印4-条形码
- Unity3D学习笔记6——GPU实例化(1)
- 十二、启动流程
猜你喜欢
Shell product written examination related
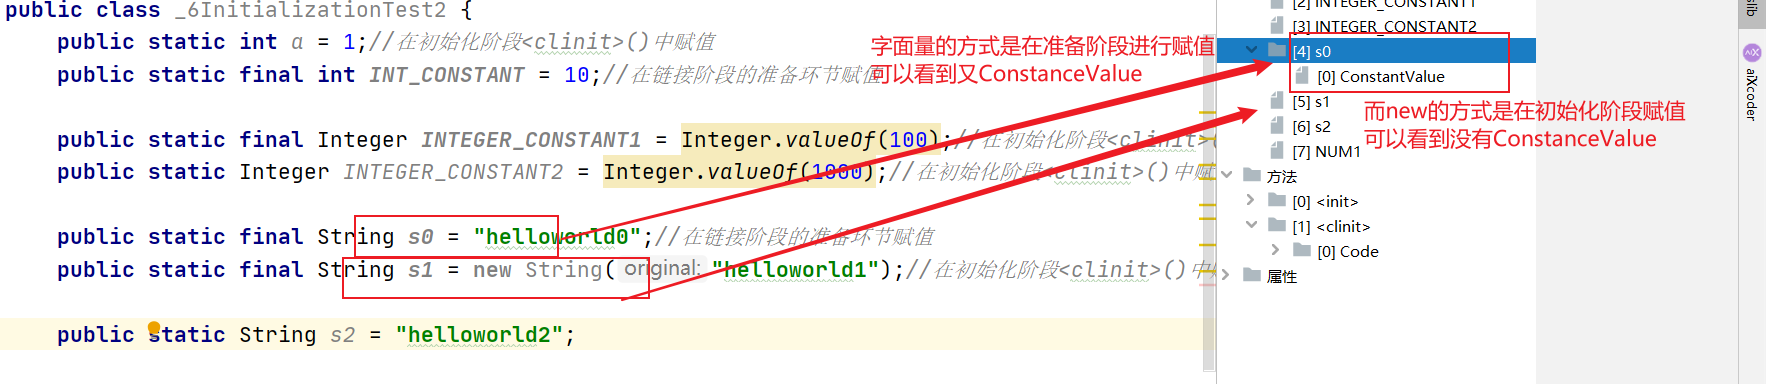
第3章:类的加载过程(类的生命周期)详解
![[sciter]: encapsulate the notification bar component based on sciter](/img/08/a3dd409261054052291e99dd28af11.png)
[sciter]: encapsulate the notification bar component based on sciter
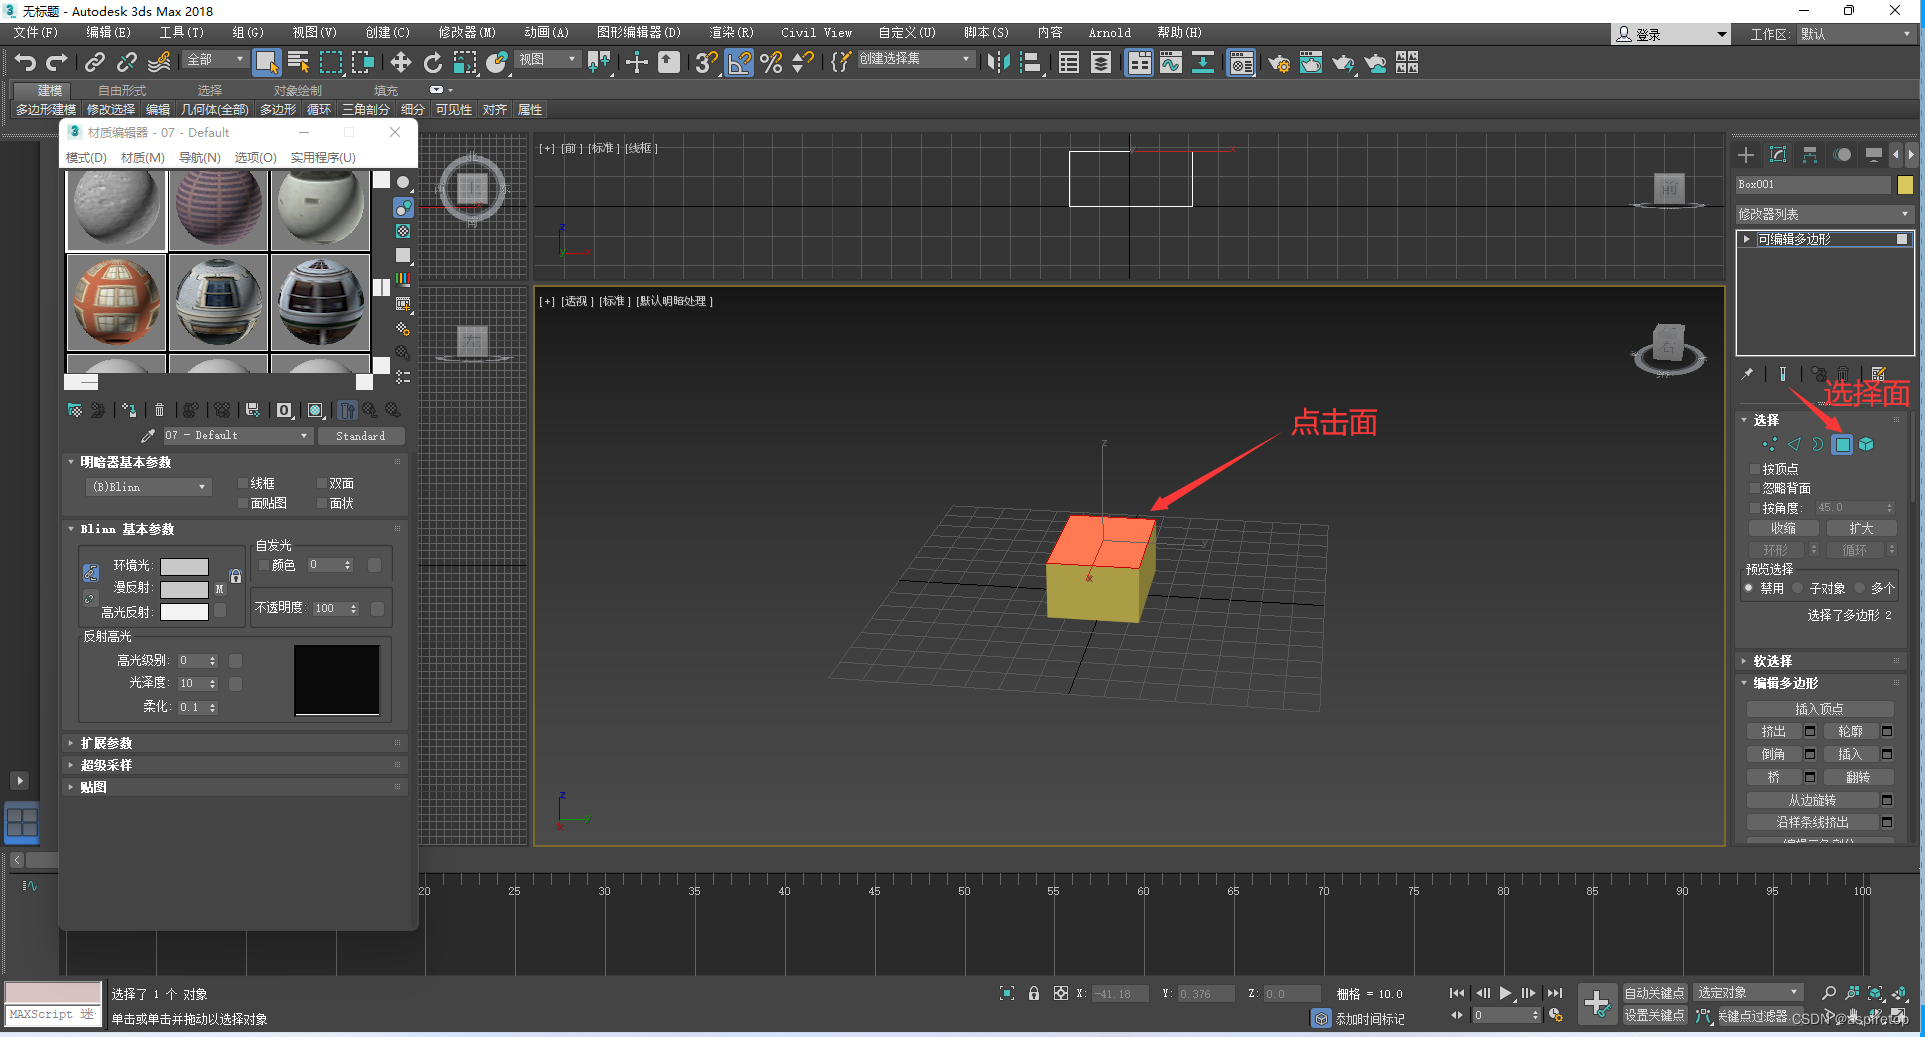
3DMAX assign face map
![Some problems about the use of char[] array assignment through scanf..](/img/cf/d85a3172c5d29ac00377f9c30dbc4f.png)
Some problems about the use of char[] array assignment through scanf..
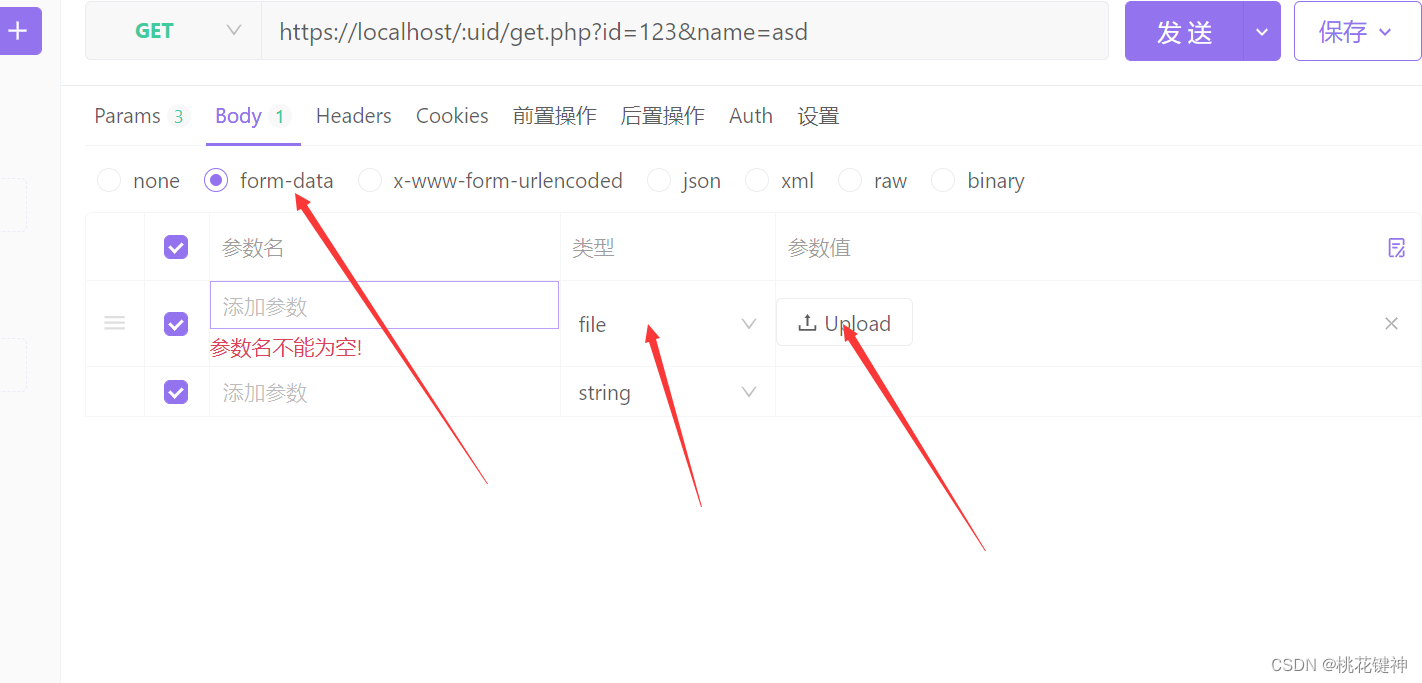
Powerful domestic API management tool
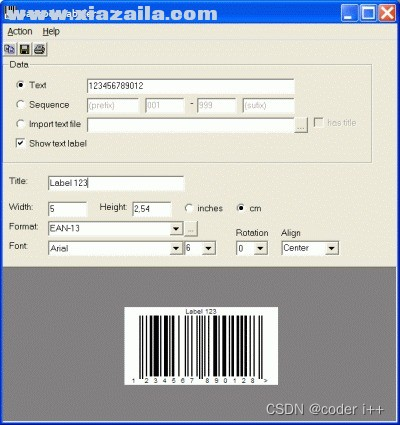
Barcodex (ActiveX print control) v5.3.0.80 free version

GNN, please deepen your network layer~
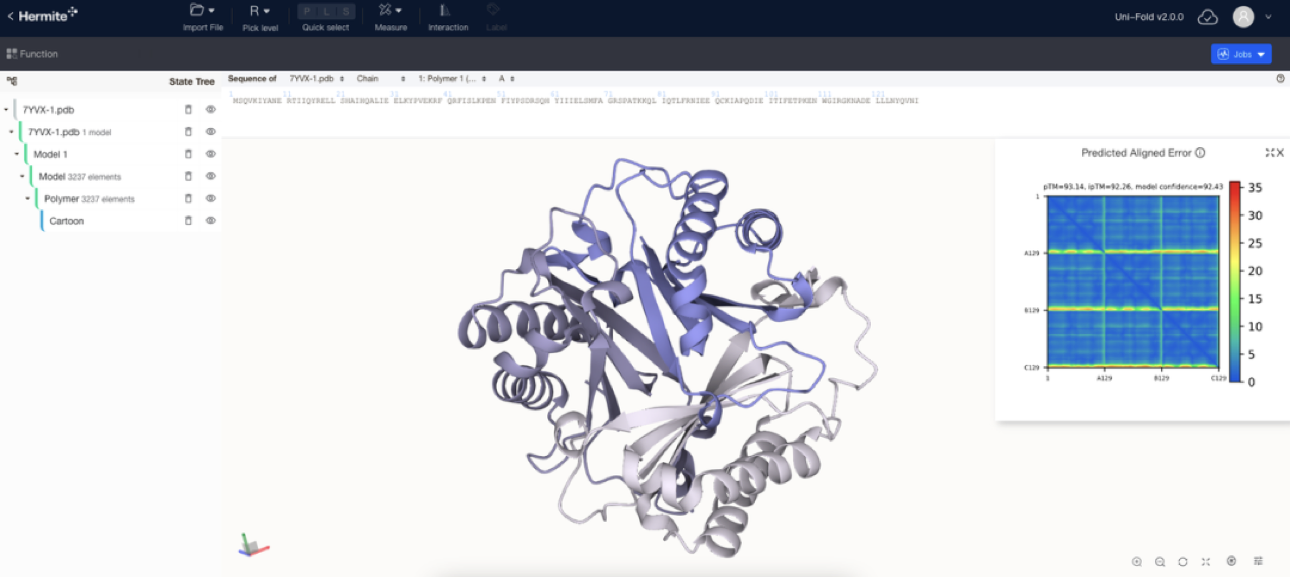
AI 企业多云存储架构实践 | 深势科技分享
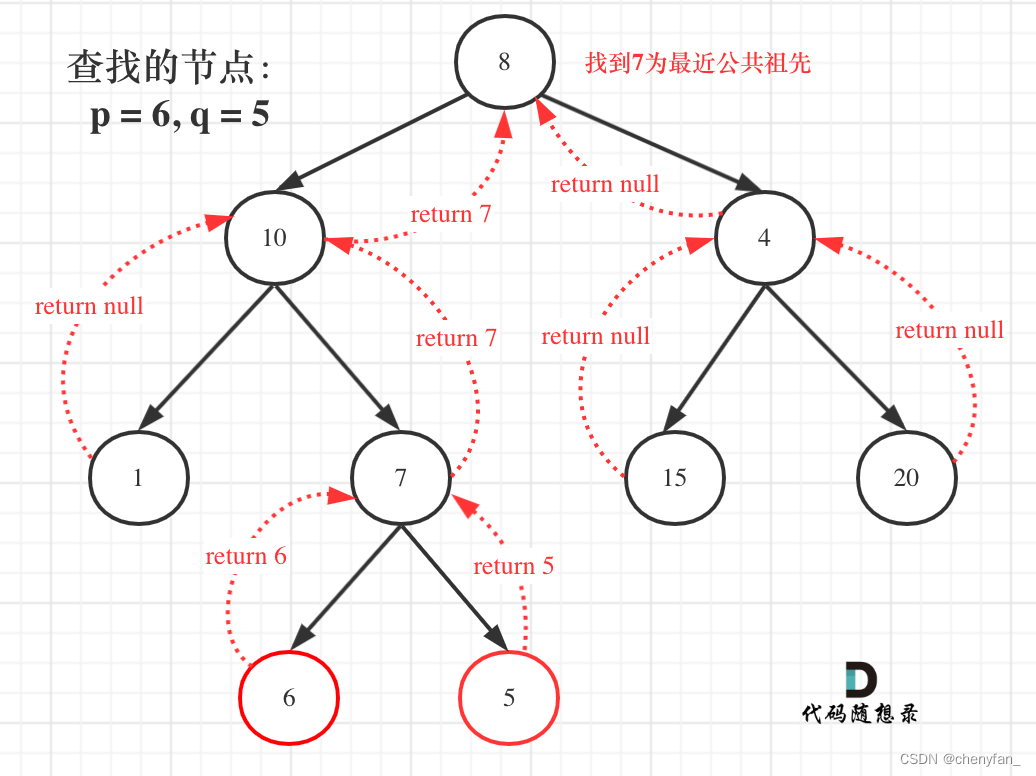
The nearest common ancestor of binary (search) tree ●●
随机推荐
12、 Start process
Qt | UDP广播通信、简单使用案例
Unity3d Learning Notes 6 - GPU instantiation (1)
Assembly and Interface Technology Experiment 6 - ADDA conversion experiment, AD acquisition system in interrupt mode
2022年6月国产数据库大事记-墨天轮
HDR image reconstruction from a single exposure using deep CNNs阅读札记
Wechat red envelope cover applet source code - background independent version - source code with evaluation points function
ZABBIX proxy server and ZABBIX SNMP monitoring
中国固态氧化物燃料电池技术进展与发展前景报告(2022版)
GPS从入门到放弃(十八)、多路径效应
China 1,4-cyclohexanedimethanol (CHDM) industry research and investment decision-making report (2022 Edition)
Seata聚合 AT、TCC、SAGA 、 XA事务模式打造一站式的分布式事务解决方案
中国1,4-环己烷二甲醇(CHDM)行业调研与投资决策报告(2022版)
解决项目跨域问题
Force deduction question 500, keyboard line, JS implementation
About the professional ethics of programmers, let's talk about it from the way of craftsmanship and neatness
Assembly and interface technology experiment 5-8259 interrupt experiment
【数字IC手撕代码】Verilog无毛刺时钟切换电路|题目|原理|设计|仿真
VIP case introduction and in-depth analysis of brokerage XX system node exceptions
Embedded common computing artifact excel, welcome to recommend skills to keep the document constantly updated and provide convenience for others