当前位置:网站首页>Elk log analysis system
Elk log analysis system
2022-07-05 17:50:00 【Jinling town】
One 、ELK Brief introduction of log analysis system
1.1、 Log server
1.1.1、 Improve safety
1.1.2、 Centralized storage of logs
1.1.3、 defects
The analysis of logs is difficult

1.2、ELK Log analysis system
1.2.1、Elasticsearch
1.2.2、Logstash
1.2.3、Kibana
1.3、 Log processing steps
1.3.1、 Centralized management of logs
1.3.2、 Format the log (Logstash) And output to the (Elasticsearch)
1.3.3、 Index and store the formatted data (Elasticsearch)
1.3.4、 Front end data display (Kibana)
Two 、ELK Component is introduced
2.1、ELasticsearch Overview
- Provides a distributed multi-user capability of full-text search engine
2.2、Elasticsearch The core concept
2.2.1、 Near real time
- elasticsearch Is a near real-time search platform , It means , There is a slight delay from indexing a document until it can be searched ( Usually 1 second )
2.2.2、 colony
- A cluster is organized by one or more nodes , They share your entire data , And provide index and search functions together . One of the nodes is the master node , This master node can be elected , It also provides the function of joint index and search across nodes . The cluster has a unique name , The default is elasticsearch, Cluster names are important , Each node is added to its cluster based on the cluster name . therefore , Make sure you use different names in different cluster environments . A cluster can have only one node . It is strongly recommended that elasticsearch when , Configured in cluster mode .
2.2.3、 node
- A node is a single server , It's part of the cluster , Store data and participate in index and search function of cluster . Like a cluster , Nodes are also identified by name , The default is the character name assigned randomly when the node starts . Of course , You can define . The name is also important , It is used to identify the node corresponding to the server in the cluster . Nodes can join the cluster by specifying the cluster name . By default , Each node is set to join elasticsearch colony . If multiple nodes are started , Suppose you can find each other automatically , They're going to automatically build one called elasticsearch The cluster of .
2.2.4、 Indexes
- Indexes ( library )→ type ( surface )→ file ( Record )
2.2.5、 Shards and copies
- In practice , The data stored in the index may exceed the hardware limit of a single node . Like a 10 Million documents need 1TB Space may not be suitable for storage on a single node's disk , Or search requests from a single node are too slow . To solve this problem ,elasticsearch Provides the ability to divide an index into multiple slices . When creating an index , You can define the number of slices you want . Each partition is a fully functional independent index , It can be on any node in the cluster .
- Each index can be divided into multiple slices . An index can also be copied 0 Time ( It means no copy ) Or many times . Once copied , Each index has a main partition ( The original shard as the copy source ) And copy shards ( A copy of the main slice ) The difference . The number of shards and replicas can be specified when the index is created .
- After index creation , You can dynamically change the number of copies at any time , But you can't change the number of pieces afterwards .
By default ,Elasticsearch Each index in is sliced 5 The sum of the main slices 1 Copies , It means , If you have at least two nodes in your cluster , Your index will have 5 One main slice and another 5 Two copies shard (1 A full copy ), In this way, each index will have a total of 10 A shard .
2.3、Logstash Introduce
2.3.1、Logstash Introduce
- A powerful data processing tool
- Data transmission can be realized 、 Format processing 、 Format output
- data input 、 The data processing ( Such as filtration , Rewriting, etc. ) And data output
2.3.2、Logstash Main components
- Shipper: Log collector , Responsible for monitoring local log file changes , Collect the latest contents of log files in time . Usually , Remote proxy side (agent) Just run this component
- Indexer: Log store by , Responsible for receiving logs and writing to local files
- Broker: journal hub, Responsible for connecting multiple shipper And multiple indexer
- Search and Storage: Allows search and storage of events
- Web Interface: be based on Web Display interface of
2.4、Kibana Introduce
2.4.1、Kibana Introduce
- One for Elasticsearch Open source analysis and visualization platform
- Search for 、 View the storage in Elasticsearch Data in index
- Advanced data analysis and display through various charts
2.4.2、Kibana The main function
- Elasticsearch Seamless integration
- Consolidate data , Complex data analysis
- Benefit more team members
- Flexible interface , It's easier to share
- Simple configuration , Visualizing multiple data sources
- Simple data export
3、 ... and 、ELK The log asked about the deployment
3.1、 Environmental statement

Deploy two Elasticsearch Clustering ,node1 do ELK Log analysis system
apache | 20.0.0.30 | httpd |
Logstash | ||
node1 | 20.0.0.10 | Elasticsearch |
Kinaba | ||
node2 | 20.0.0.20 | Elasticsearch |
3.2、Elasticsearch To configure ( The following operations need to be performed in node1、node2 On the configuration )
3.2.1、 Installation key and elasticsearch Source


 1 [[email protected] ~]# rpm --import https://packages.elastic.co/GPG-KEY-elasticsearch
 2 [[email protected] ~]# cd /etc/yum.repos.d/
 3 [[email protected] yum.repos.d]# vi elasticsearch.repo
 4 [elasticsearch-2.x]
 5 name=Elasticsearch repository for 2.x packages
 6 baseurl=http://packages.elastic.co/elasticsearch/2.x/centos
 7 gpgcheck=1
 8 gpgkey=http://packages.elastic.co/GPG-KEY-elasticsearch
 9 enable=1
10
11 [[email protected] ~]# yum list       # see yum detailed list
12 [[email protected] ~]# yum install elasticsearch -y    # install elasticsearch
13 [[email protected] ~]# yum install java -y      # install Java
14 [[email protected] ~]# java -version           # see Java edition
15 openjdk version "1.8.0_131"
16 OpenJDK Runtime Environment (build 1.8.0_131-b12)
17 OpenJDK 64-Bit Server VM (build 25.131-b12, mixed mode)


3.2.2、 Modify the configuration file


 1 [[email protected] yum.repos.d]# vi /etc/elasticsearch/elasticsearch.yml
 2 17 That's ok   Cluster name
 3 cluster.name: elastic
 4
 5 23 That's ok   The name of the node
 6 node.name: linux-node1
 7
 8 33 That's ok   working directory
 9 path.data: /data/es-data
10 path.logs: /var/log/elasticsearch/
11
12 43 That's ok   Prevent exchange swap Partition
13 bootstrap.memory_lock: true
14
15 54 That's ok   Monitor the network
16 network.host: 0.0.0.0
17
18 58 That's ok   port
19 http.port: 9200


3.2.3、 Create directories and open services
1 [[email protected] yum.repos.d]# mkdir -p /data/es-data
2 [[email protected] yum.repos.d]# chown -R elasticsearch:elasticsearch /data/es-data
3 [[email protected] yum.repos.d]# systemctl start elasticsearch.service
4 [[email protected] yum.repos.d]# netstat -anpt | grep 9200
5 tcp6       0      0 :::9200                 :::*                    LISTEN      54134/java
3.2.4、 test
1 http://20.0.0.10:9200


 1 [[email protected] yum.repos.d]# curl -i -XGET 'http://20.0.0.20:9200/_count?pretty' -d '{
 2 > "query": {
 3 >     "match_all": {}
 4 > }
 5 > }'
 6 HTTP/1.1 200 OK       # Output item
 7 Content-Type: application/json; charset=UTF-8
 8 Content-Length: 95
 9
10 {
11   "count" : 0,
12   "_shards" : {
13     "total" : 0,
14     "successful" : 0,
15     "failed" : 0
16   }
17 }
18
19 [[email protected] yum.repos.d]# curl -i -XGET 'http://20.0.0.10:9200/_count?pretty' -d '{
20 > "query": {
21 >     "match_all": {}
22 > }
23 > }'
24 HTTP/1.1 200 OK      # Output item
25 Content-Type: application/json; charset=UTF-8
26 Content-Length: 95
27
28 {
29   "count" : 0,
30   "_shards" : {
31     "total" : 0,
32     "successful" : 0,
33     "failed" : 0
34   }
35 }


3.2.5、 install Elasticsearch plug-in unit
1 [[email protected] yum.repos.d]# /usr/share/elasticsearch/bin/plugin install mobz/elasticsearch-head
3.2.6、 test
1 http://20.0.0.10:9200/_plugin/head/

3.2.7、 Match query
- Submit a request

- Inquire about

- Delete and then query


3.2.8、elasticsearch Cluster deployment

1 [[email protected] yum.repos.d]# vi /etc/elasticsearch/elasticsearch.yml
2 69 That's ok   Unicast list auto discovery mechanism
3 discovery.zen.ping.unicast.hosts: ["20.0.0.10", "20.0.0.20"]
4
5  Restart the service
6 [[email protected] yum.repos.d]# systemctl restart elasticsearch.service

3.2.9、 test
1 http://20.0.0.10:9200/_plugin/head/

3.2.10、node-01 and node-02 Log prompts not to lock memory


1 [[email protected] elasticsearch]# less /var/log/elasticsearch/elastic.log
2 ......
3 [2020-11-18 10:36:42,959][WARN ][bootstrap                ] These can be adjusted by modifying /etc/security/limits.conf, for example:
4         # allow user 'elasticsearch' mlockall
5         elasticsearch soft memlock unlimited
6         elasticsearch hard memlock unlimited


1  Modify the configuration file
2 [[email protected] elasticsearch]# vi /etc/security/limits.conf
3 // Insert at end
4 # allow user 'elasticsearch' mlockall
5 elasticsearch soft memlock unlimited
6 elasticsearch hard memlock unlimited
7
8 [[email protected] elasticsearch]# systemctl stop elasticsearch.service
9 [[email protected] elasticsearch]# systemctl start elasticsearch.service


3.2.11、 Install monitoring components
1 [[email protected] elasticsearch]# /usr/share/elasticsearch/bin/plugin install lmenezes/elasticsearch-kopf
3.2.12、 test

3.3、Logstash Deploy (apache Upper Department )
3.3.1、 install httpd And turn on the service


1 [[email protected] ~]# yum -y install httpd
2 [[email protected] ~]# systemctl start httpd
3 [[email protected] ~]# netstat -anpt | grep httpd
4 tcp6       0      0 :::80                   :::*                    LISTEN      15620/httpd
5 [[email protected] ~]# echo '<h1>this is web!</h1>' > /var/www/html/index.html
6 [[email protected] ~]# curl http://localhost
7 <h1>this is web!</h1>


3.3.2、 Installation key and Logstash Source

 1 [[email protected] elasticsearch]# rpm --import https://packages.elastic.co/GPG-KEY-elasticsearch
 2 [[email protected] elasticsearch]# vi /etc/yum.repos.d/logstash.repo
 3 [logstash-2.1]
 4 name=Logstash repository for 2.1.x packages
 5 baseurl=http://packages.elastic.co/logstash/2.1/centos
 6 gpgcheck=1
 7 gpgkey=http://packages.elastic.co/GPG-KEY-elasticsearch
 8 enable=1
 9
10  install Logstash
11 [[email protected] elasticsearch]# yum install logstash -y


3.3.3、 install java Environmental Science , There is no built-in installation yum -y install java install

1 [[email protected] ~]# yum -y install java
2 [[email protected] ~]# java -version
3 openjdk version "1.8.0_131"
4 OpenJDK Runtime Environment (build 1.8.0_131-b12)
5 OpenJDK 64-Bit Server VM (build 25.131-b12, mixed mode)
6 [[email protected] bin]# ln -s /opt/logstash/bin/logstash /usr/local/bin/

3.3.4、logstash(apache) And elasticsearch(node) Whether the function is normal , Do docking tests


1 [[email protected] bin]# logstash -e 'input { stdin{} } output { stdout{} }'
2 Settings: Default filter workers: 1
3 Logstash startup completed
4 www.baidu.com                       # Just enter a few URLs
5 2020-11-18T07:53:59.480Z apache www.baidu.com
6 www.163.com
7 2020-11-18T07:54:12.187Z apache www.163.com
8 www.aliyun.com
9 2020-11-18T07:54:36.980Z apache www.aliyun.com


1 logstash Explanation of command options :
2 -f: Appoint logstash Configuration file for , Configure according to the configuration file logstash
3 -e: Followed by a string , The string can be treated as logstash Configuration of ( If it is “ ”, It is used by default stdin Do input ,stdout For export )
4 -t: Test the configuration file for correctness , And then quit
5 # The input is standard input , The output is standard output
3.3.5、 Use rubydebug Show detailed output ,codec For a codec


 1 [[email protected] bin]# logstash -e 'input { stdin{} } output { stdout{ codec => rubydebug } }'
 2 Settings: Default filter workers: 1
 3 Logstash startup completed
 4 www.baidu.com
 5 {
 6        "message" => "www.baidu.com",
 7       "@version" => "1",
 8     "@timestamp" => "2020-11-18T08:40:57.598Z",
 9           "host" => "apache"
10 }


3.3.6、 Use logstash Output information to elasticsearch


1 [[email protected] bin]# logstash -e 'input { stdin{} } output { elasticsearch { hosts => ["20.0.0.10:9200"] } }'
2 Settings: Default filter workers: 1
3 Logstash startup completed
4 abc123      # Input content
5 tom456
6 123jerry

3.3.7、 Open the browser and type http://20.0.0.10:9200/_plugin/dead/, View index information , Display the new data information description output to elasticsearch success

3.3.8、 stay apache Make docking configuration in the host ,logstash Collect system logs

 1 logstash The configuration file consists of three parts :input、output、filter
 2 [[email protected] bin]# chmod o+r /var/log/messages   # Allow other users to access
 3 [[email protected] bin]#  ll /var/log/messages
 4 -rw----r--. 1 root root 250721 11 month  18 16:40 /var/log/message
 5
 6 [[email protected] ~]# vi /etc/logstash/conf.d/system.conf
 7 input {                    #logstash Input : from /var/log/messages Input , The type is system, Start bit                       Set to start from scratch
 8         file {
 9           path => "/var/log/messages"
10           type => "system"
11           start_position => "beginning"
12         }
13       }
14
15 output {                #logstash Output : Output to elasticsearch( With IP Address specifies the location )
16         elasticsearch {
17         hosts => ["20.0.0.10:9200"]
18         index => "system-%{+YYY.MM.dd}"
19         }
20       }
21
22 [[email protected]apache ~]# systemctl restart logstash.service

3.3.9、 Open the browser and type http://20.0.0.10:9200/_plugin/dead/, View index information , Display new index information to represent logstash The collected log information is successfully output to elasticsearch

3.4、 stay node1 Host installation kibana
3.4.1、 stay node1 Host installation kibana


 1  Upload kibana-4.3.1-linux-x64.tar.gz To /root Next
 2 [[email protected] ~]# tar zxf kibana-4.3.1-linux-x64.tar.gz
 3 [[email protected] ~]# mv kibana-4.3.1-linux-x64 kibana
 4 [[email protected] ~]# mv kibana /usr/local/
 5 [[email protected] ~]# cd /usr/local/kibana/
 6 [[email protected] kibana]# vi config/kibana.yml
 7
 8 //2 That's ok  kibana Open port
 9 server.port: 5601
10
11 //5 That's ok  kibana Listening address
12 server.host: "0.0.0.0"
13
14
15 //12 That's ok   and elasticsearch Make connections
16 elasticsearch.url: "http://20.0.0.10:9200"
17
18 //20 That's ok   stay elasticsearch Add .kibana Indexes
19 kibana.index: ".kibana"
20
21 [[email protected] kibana]# yum -y install screen
22
23  start-up kibana
24 [[email protected] kibana]# /usr/local/kibana/bin/kibana
25   log   [17:53:46.904] [info][status][plugin:kibana] Status changed from uninitialized to green - Ready
26   log   [17:53:46.933] [info][status][plugin:elasticsearch] Status changed from uninitialized to yellow - Waiting for Elasticsearch
27   log   [17:53:46.944] [info][status][plugin:kbn_vislib_vis_types] Status changed from uninitialized to green - Ready
28   log   [17:53:46.951] [info][status][plugin:markdown_vis] Status changed from uninitialized to green - Ready
29   log   [17:53:46.955] [info][status][plugin:metric_vis] Status changed from uninitialized to green - Ready
30   log   [17:53:46.958] [info][status][plugin:spyModes] Status changed from uninitialized to green - Ready
31   log   [17:53:46.966] [info][status][plugin:statusPage] Status changed from uninitialized to green - Ready
32   log   [17:53:46.969] [info][status][plugin:table_vis] Status changed from uninitialized to green - Ready
33   log   [17:53:46.978] [info][listening] Server running at http://0.0.0.0:5601
34   log   [17:53:51.976] [info][status][plugin:elasticsearch] Status changed from yellow to yellow - No existing Kibana index found
35   log   [17:53:54.602] [info][status][plugin:elasticsearch] Status changed from yellow to green - Kibana index ready


3.4.2、 Login in the browser 20.0.0.10:5601, The first login prompt creates an index name :
fill system-*, That is, the name of the docking system log file

3.4.3、 At the same time, you can also see just now kibana.yml Added in elasticsearch Add .kibana The index configuration is in effect ( Used to verify kibana and elasticsearch Whether the connection is successful )

3.4.4、 add to logstash To configure , collect apache Data in the access log and error log of the service

 1 [[email protected] ~]# cd /etc/logstash/conf.d/
 2 [[email protected] conf.d]# vi apache_log.conf
 3 input {
 4         file {
 5           path => "/etc/httpd/logs/access_log"
 6           type => "access"
 7           start_position => "beginning"
 8         }
 9
10         file {
11           path => "/etc/httpd/logs/error_log"
12           type => "error"
13           start_position => "beginning"
14         }
15    }
16 output {
17         if [type] == "access" {
18           elasticsearch {
19             hosts => ["20.0.0.10:9200"]
20             index => "apache_access-%{+YYY.MM.dd}"
21           }
22         }
23         if [type] == "error" {
24           elasticsearch {
25             hosts => ["20.0.0.10:9200"]
26             index => "apache_error-%{+YYY.MM.dd}"
27           }
28         }
29     }
30
31 [[email protected] conf.d]# logstash -f apache_log.conf    # Appoint logstash Configuration file for , according to apache_log.conf To configure logstash(-f You can load without restarting )

3.4.5、 Browser access http://20.0.0.10:9200/_plugin/head/, see apache Whether the index of the log file is successfully established

summary
ELK Log analysis system is a very powerful log analysis tool , It can help the operation and maintenance engineer locate the desired log faster and more accurately , especially kibana Visualization tools , Powerful , It's very user-friendly
边栏推荐
- BigDecimal除法的精度问题
- ICML 2022 | Meta propose une méthode robuste d'optimisation bayésienne Multi - objectifs pour faire face efficacement au bruit d'entrée
- 职场进阶指南:大厂人必看书籍推荐
- Zabbix
- 毫无章法系列
- Interpretation: how to deal with the current security problems faced by the Internet of things?
- Kafaka technology lesson 1
- 2022新版PMP考试有哪些变化?
- tkinter窗口预加载
- Action avant ou après l'enregistrement du message teamcenter
猜你喜欢

统计php程序运行时间及设置PHP最长运行时间

网络威胁分析师应该具备的十种能力
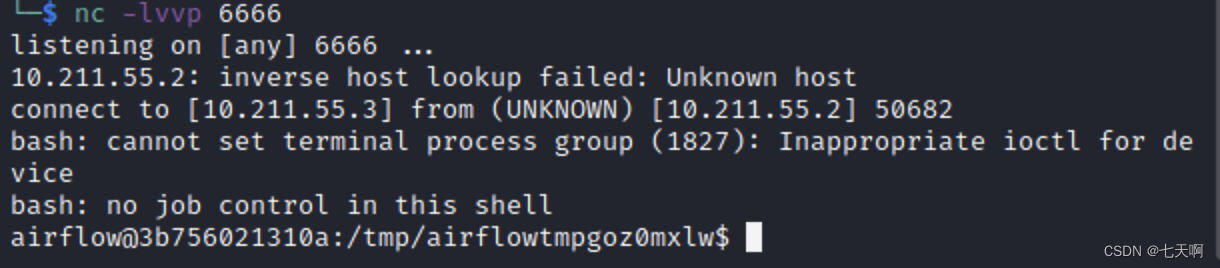
漏洞复现----48、Airflow dag中的命令注入(CVE-2020-11978)

基于YOLOv3的口罩佩戴检测

What are the requirements for PMP certification? How much is it?
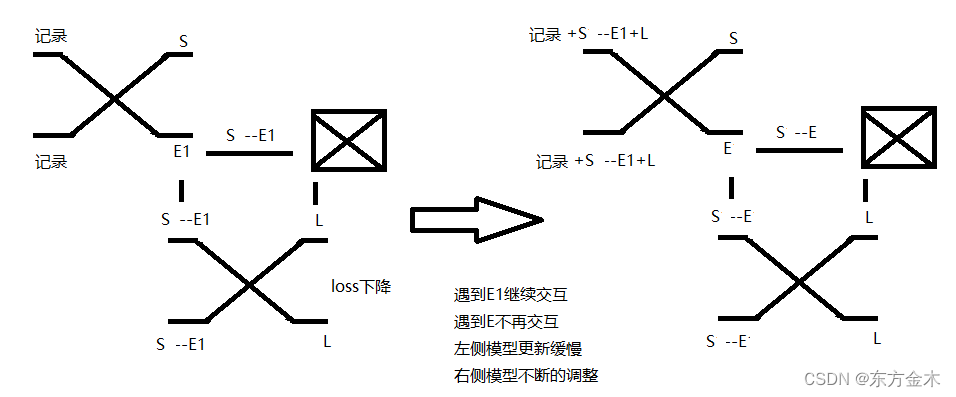
神经网络自我认知模型

What are the changes in the 2022 PMP Exam?

Abnormal recovery of virtual machine Oracle -- Xi Fenfei
統計php程序運行時間及設置PHP最長運行時間
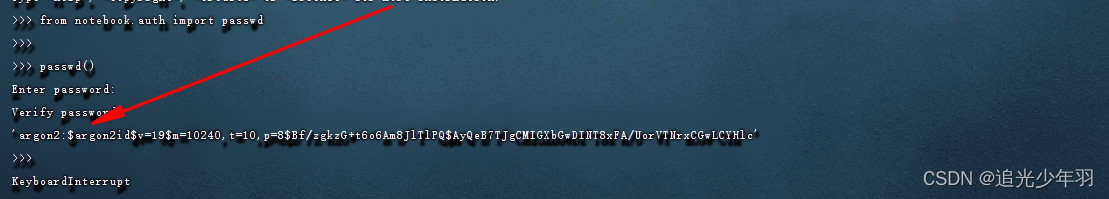
Server configuration jupyter environment
随机推荐
ITK Example
VBA drives SAP GUI to realize office automation (II): judge whether elements exist
力扣解法汇总729-我的日程安排表 I
网络威胁分析师应该具备的十种能力
QT控制台打印输出
The five most difficult programming languages in the world
Read the history of it development in one breath
论文阅读_中文NLP_LTP
Beijing internal promotion | the machine learning group of Microsoft Research Asia recruits full-time researchers in nlp/ speech synthesis and other directions
Count the running time of PHP program and set the maximum running time of PHP
Anaconda中配置PyTorch环境——win10系统(小白包会)
Cartoon: interesting pirate problem (full version)
Which platform of outer disk gold is regular and safe, and how to distinguish it?
Rider set the highlighted side of the selected word, remove the warning and suggest highlighting
SQL Server(2)
Cartoon: interesting [pirate] question
Ordinary programmers look at the code, and top programmers look at the trend
漫画:如何实现大整数相乘?(整合版)
2022年信息系统管理工程师考试大纲
解读:如何应对物联网目前面临的安全问题?