当前位置:网站首页>MySQL combat optimization expert 10 production experience: how to deploy visual reporting system for database monitoring system?
MySQL combat optimization expert 10 production experience: how to deploy visual reporting system for database monitoring system?
2022-07-06 10:06:00 【Office template library material frog】
1、 Deploy Grafana
In the last article, we explained that the installation is complete Prometheus, Then let's continue Explain how to install Grafana, First, download from the following address grafana-4.6.3.linux-x64.tar.gz, Then execute the following commands step by step , Complete his startup .
https://s3-us-west-2.amazonaws.com/grafana-releases/release/grafana-4.6.3.linux-x64.tar.gz
tar xf grafana-4.6.3.linux-x64.tar.gz -C /data/prometheus cd /data/prometheus
mv grafana-4.6.3 grafana
cd /data/prometheus/grafana ./bin/grafana-server &
Then it's done grafana Start of , Then it can be accessed through a browser 3000 port , The default username and password are admin/admin. And then Grafana Left There is one in the side menu bar Data Sources, Click a button inside Add data source, Is to add a data source .
Then enter the name of your data source in the interface Prometheus, The type is Prometheus,HTTP URL The address is http://127.0.0.1:9090, Other Just use the default configuration , Next Grafana Will automatically from Prometheus Get monitoring data and display .
Then you need to install Grafana Instrument cluster components , First you need to download grafana-dashboards-1.6.1.tar.gz, Just use the following link :https://github.com/percona/grafana-dashboards/archive/v1.6.1.tar.gz.
Then execute a series of commands to install grafana-dashboard Components .
tar xvf grafana-dashboards-1.6.1.tar.gz cd grafana-dashboards-1.6.1
updatedb
locate json |grep dashboards/At this time, you will see a lot of json file , It's corresponding to various dashboards json The configuration file , You can take these json Profile passed WinSCP And Class tools from linux Drag it onto your machine windows Come on the computer , Because you need to upload them through the browser .
And then grafana On the page , You can see that there is one on the top Home Button , Click to enter an interface , You'll see one Import Dashboard Press button , That is to say, some dashboards can be imported , At this time, you need to import a lot of json file .
You click Upload json file Button , There will be an interface for you to upload one by one json file , Then you upload it one by one , next grafana Will appear in A lot of dashboards , For example, machine CPU Usage dashboard , Disk performance dashboard , Disk space dashboard ,MySQL Monitoring instrument cluster , wait .
2、 add to MySQL Monitoring of the machine
First of all, if we want to make Prometheus Go collect MySQL Machine monitoring data (CPU、 Memory 、 disk 、 The Internet , wait ), And then let Grafana Can exhibit Show , Then you must add Prometheus Yes MySQL Monitoring of the machine .
First of all, it has to be in MySQL Unzip and start on the machine node_exporter, After this startup, there is a linux process , He will automatically collect this one linux On the machine CPU、 disk 、 Memory 、 Various monitoring data such as network , In fact, you can understand the essence through what we explained before linux command , You can collect everything What do you want? linux Machine monitoring data .
tar xf node_exporter-0.15.2.linux-amd64.tar

mv node_exporter-0.15.2.linux-amd64 node_exporter cd node_exporter

nohup ./node_exporter &
Up to this point , We are in MySQL A node_exporter 了 , He will automatically collect this machine CPU、 disk 、 Inside save 、 Network monitoring data , But this is not enough , because Prometheus The monitoring of this machine has not been added on .
At this time, we should still remember , Before that Prometheus Of yml In profile , We have defined a host Monitoring item , He is used to monitor the machine , He The configuration file is host.yml, At this point, we can edit this host.yml The configuration file , Join in mysql The address of the machine is ok
vi host.yml
- labels:
service: test targets:
- 127.0.0.1next Prometheus Will follow MySQL Deployed on the machine node_exporter communicate , Continuously obtain the monitoring data of this machine , Write your own Stored in the time series database . Then we can open Grafana The page of , At this point, you can see the relevant performance monitoring of this machine .
3、 add to MySQL Database monitoring
Then we also need to be in MySQL Start another one on your machine mysqld_exporter The components of , He is responsible for collecting MySQL Some monitoring data of the database itself According to the , Let's just look at the following instructions .
tar xf mysqld_exporter-0.10.0.linux-amd64.tar

mv mysqld_exporter-0.10.0.linux-amd64 mysqld_exporter
Then you need to configure some environment variables , To set up mysqld_exporter Address information of the database to be monitored , See the account number configured below 、 Password and address and port Number
export DATA_SOURCE_NAME='root:[email protected](127.0.0.1:3306)/'

echo "export DATA_SOURCE_NAME='root:[email protected](127.0.0.1:3306)/'" >> /etc/profile
Then start mysqld_exporter
cd mysqld_exporter
nohup ./mysqld_exporter --collect.info_schema.processlist --collect.info_schema.innodb_tablespaces -- collect.info_schema.innodb_metrics --collect.perf_schema.tableiowaits --collect.perf_schema.indexiowaits -- collect.perf_schema.tablelocks --collect.engine_innodb_status --collect.perf_schema.file_events -- collect.info_schema.processlist --collect.binlog_size --collect.info_schema.clientstats -- collect.perf_schema.eventswaits &
The above startup command specifies a large number of options to start some monitoring collection , These orders are also my hands , Because of some inconvenient reasons in the current writing environment plain , So it can only be so , If you find any small mistakes , You can tell me in the backstage of the comment area .
And then this mysqld_exporter The process will automatically collect MySQL Own monitoring data , Then we need to be in Prometheus Configure him to go with mysqld_exporter Communication, data acquisition and storage , then Grafana To see the corresponding report .
vi /data/prometheus/mysql.yml
- labels:
service: mysql_test targets:
- 127.0.0.1
Then we are Grafana You can see MySQL All kinds of monitoring data .
4、 One assignment
Today I want to leave you a little homework , I hope you can refer to today's two articles , Set up a database monitoring system , And then you can use sysbench Do a pressure test , During the pressure test , You can have a direct look at Grafana On the machine and MySQL Monitoring indicators .
This process is not difficult , But you may encounter some operational problems , If you find any problems in the process of building , Don't post the screenshot of the error directly on the Comment area , You can check the Internet first , Where are the mistakes
If there is really a problem , I will try to solve the problem later , Then updated .
in addition , I want you to think about a problem , You can check whether the database in your company has done over-voltage testing ? Has visual monitoring been done ? How it's done ? since Some machine loads and QPS、TPS How many are they ? Whether I have a comprehensive grasp of the database ?
I hope everyone can go and have a look , Then post it in the comment area to share and exchange with you .
边栏推荐
- Day 5 of MySQL learning
- 嵌入式开发比单片机要难很多?谈谈单片机和嵌入式开发设计经历
- Selection of software load balancing and hardware load balancing
- CANoe下载地址以及CAN Demo 16的下载与激活,并附录所有CANoe软件版本
- Nc17 longest palindrome substring
- MySQL ERROR 1040: Too many connections
- 15 医疗挂号系统_【预约挂号】
- The programming ranking list came out in February. Is the result as you expected?
- Contrôle de l'exécution du module d'essai par panneau dans Canoe (primaire)
- 安装OpenCV时遇到的几种错误
猜你喜欢

嵌入式开发比单片机要难很多?谈谈单片机和嵌入式开发设计经历
C#/. Net phase VI 01C Foundation_ 01: running environment, process of creating new C program, strict case sensitivity, meaning of class library

嵌入式開發中的防禦性C語言編程
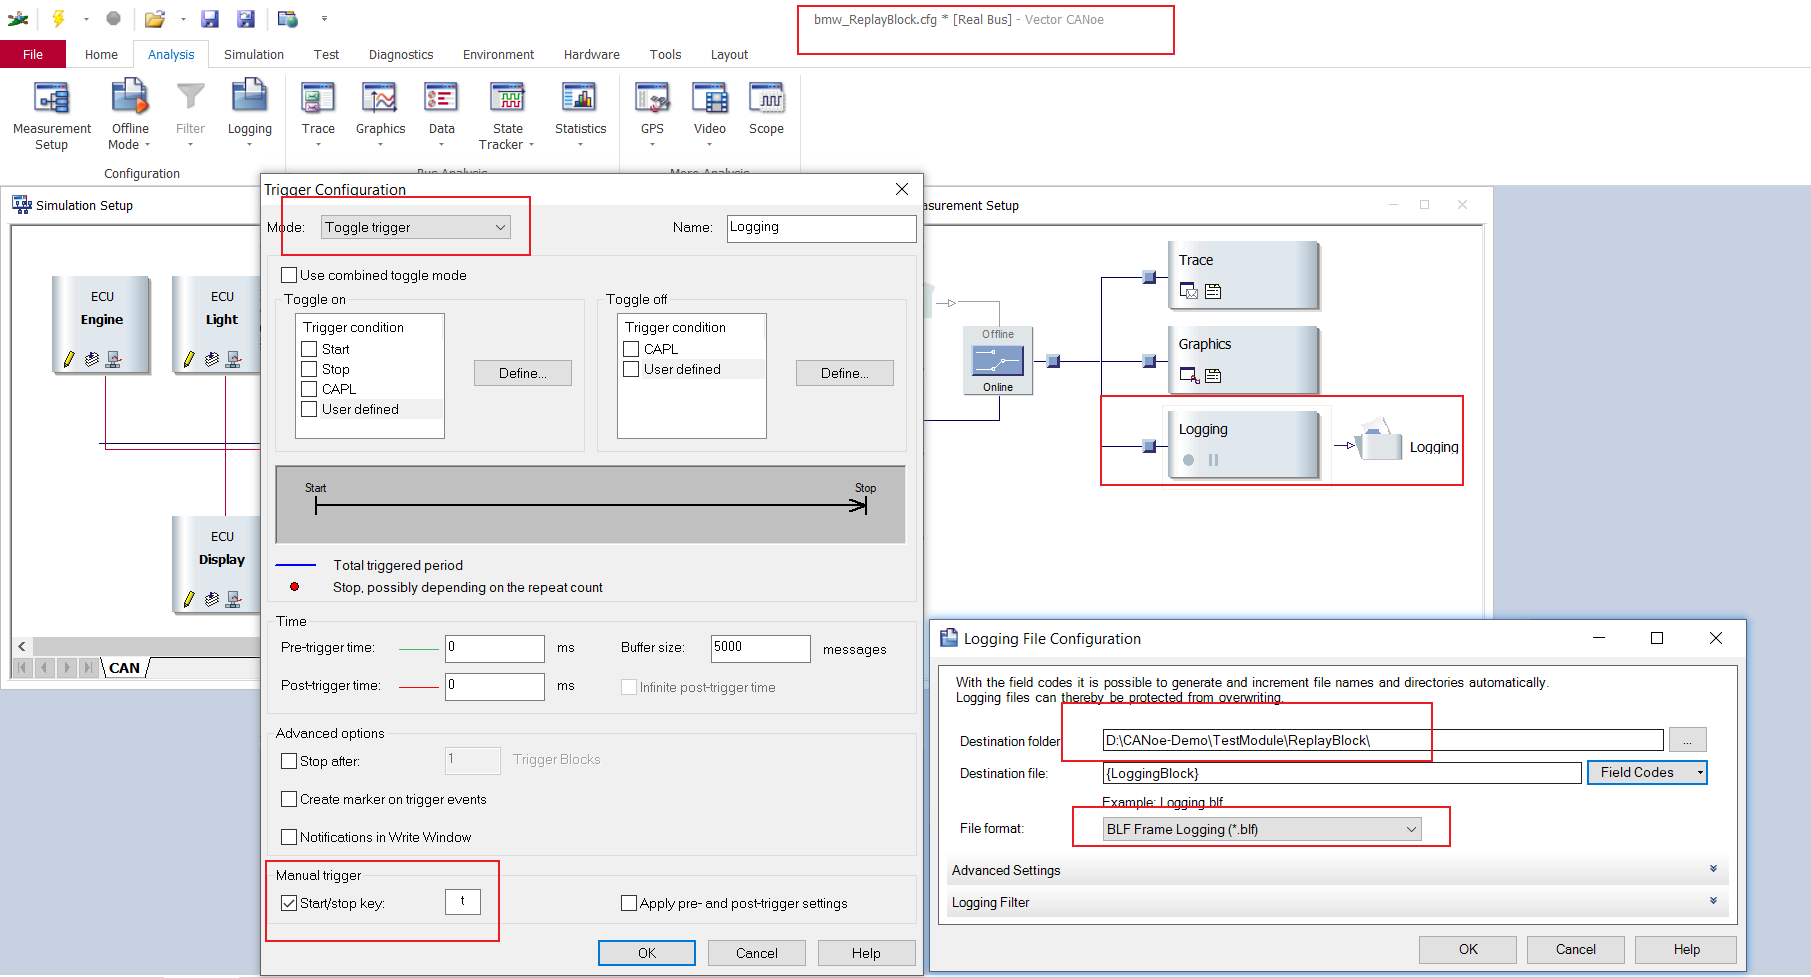
CANoe的数据回放(Replay Block),还是要结合CAPL脚本才能说的明白
Installation of pagoda and deployment of flask project
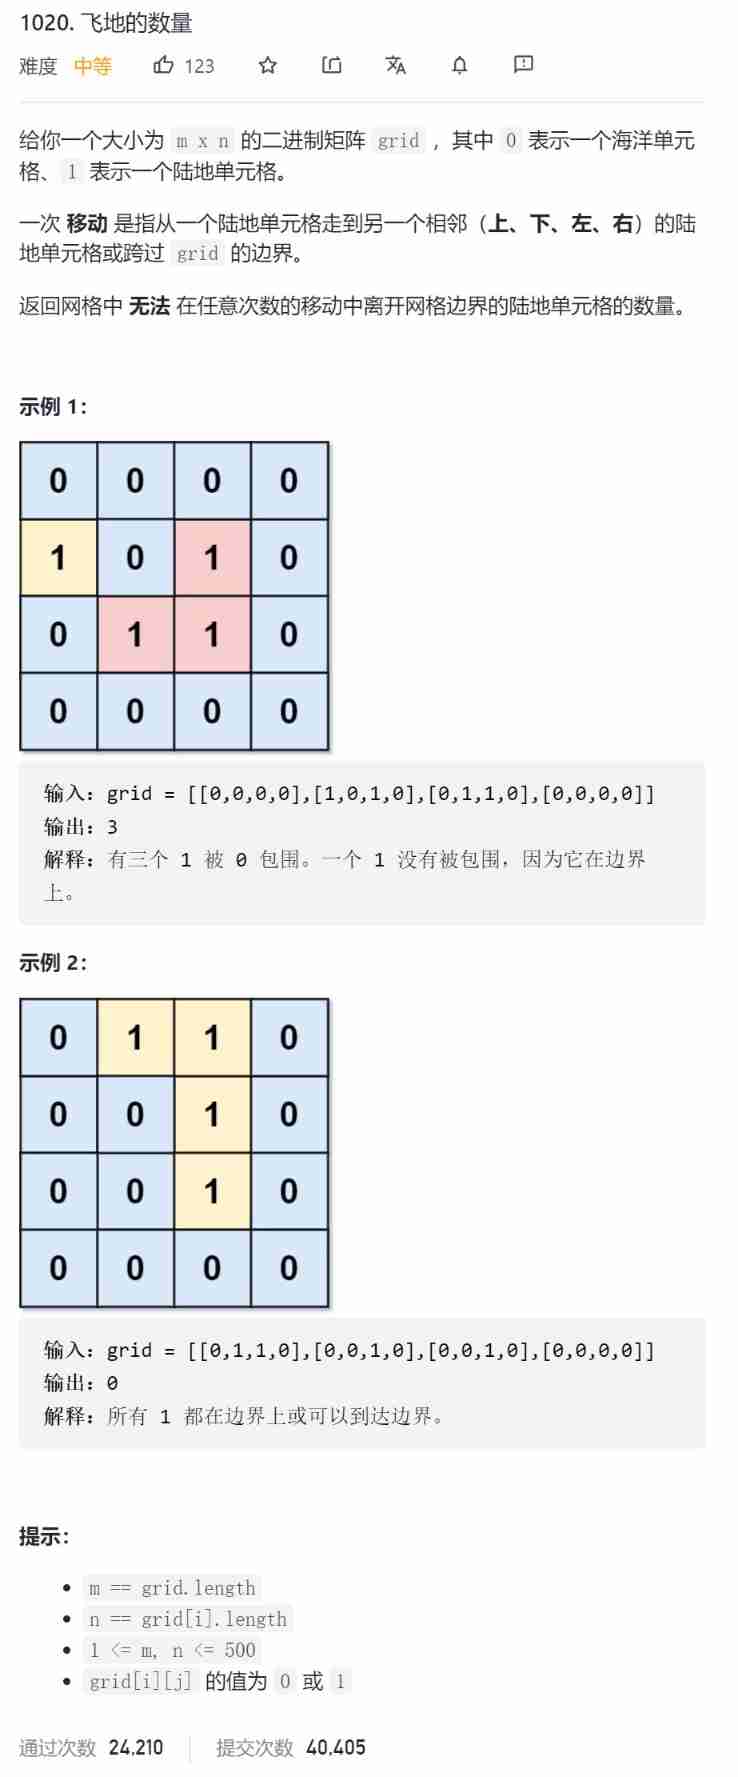
Combined search /dfs solution - leetcode daily question - number of 1020 enclaves

Nc29 search in two-dimensional array
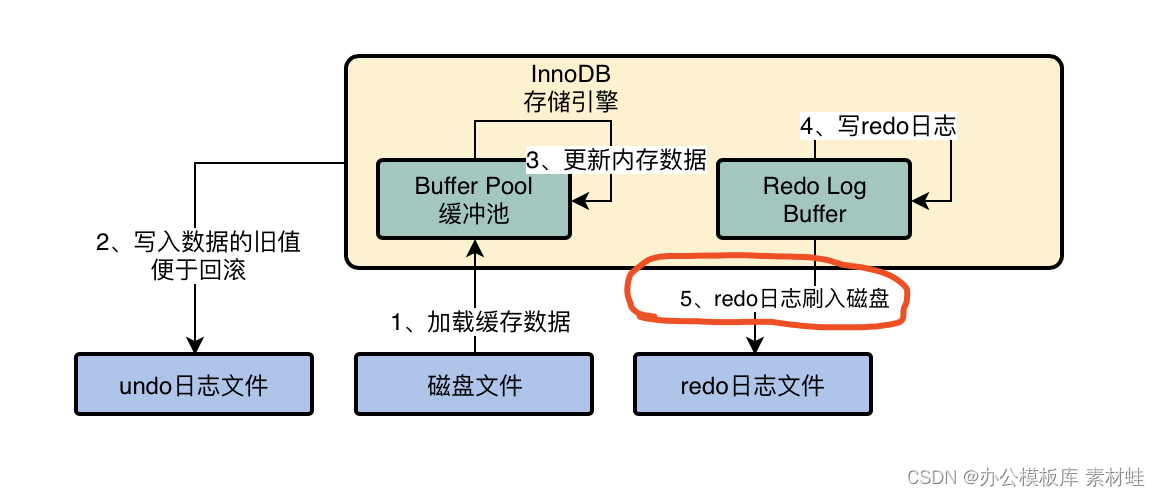
MySQL combat optimization expert 03 uses a data update process to preliminarily understand the architecture design of InnoDB storage engine
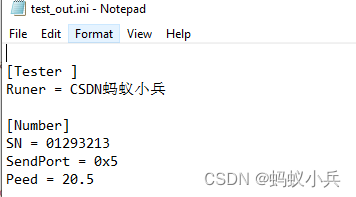
CAPL 脚本对.ini 配置文件的高阶操作

Contest3145 - the 37th game of 2021 freshman individual training match_ B: Password
随机推荐
Jar runs with error no main manifest attribute
CANoe下载地址以及CAN Demo 16的下载与激活,并附录所有CANoe软件版本
MySQL实战优化高手12 Buffer Pool这个内存数据结构到底长个什么样子?
Safety notes
Preliminary introduction to C miscellaneous lecture document
flask运维脚本(长时间运行)
NLP routes and resources
Regular expressions are actually very simple
Single chip microcomputer realizes modular programming: Thinking + example + system tutorial (the degree of practicality is appalling)
Contrôle de l'exécution du module d'essai par panneau dans Canoe (primaire)
Tianmu MVC audit II
Retention policy of RMAN backup
如何让shell脚本变成可执行文件
颜值爆表,推荐两款JSON可视化工具,配合Swagger使用真香
South China Technology stack cnn+bilstm+attention
C miscellaneous two-way circular linked list
Compress decompress
Delayed note learning
docker MySQL解决时区问题
Configure system environment variables through bat script