当前位置:网站首页>Entropy method to calculate weight
Entropy method to calculate weight
2022-07-03 10:36:00 【Also far away】
One 、 Principle analysis of entropy method
1、 Select data
m Samples , common n Indicators , X i j X_{ij} Xij For the first i i i Of samples j j j The number of indicators , i = 1 , 2 , 3 , . . . m ; j = 1 , 2 , 3... n . i = 1 , 2 , 3 , . . . m ; j = 1 , 2 , 3... n. i=1,2,3,...m;j=1,2,3...n.
2、 Data standardization
When the measurement units and directions of various indicators are not unified , The data needs to be standardized , In order to avoid the meaningless logarithm when calculating entropy , You can add a real number of a smaller order to each value , Such as 0.001
(1) Positive correlation index
X ′ = X i j − M i n ( X i j ) M a x ( X i j ) − M i n ( X i j ) X'= \frac{X_{ij}- Min(X_{ij})}{Max(X_{ij})-Min(X_{ij})} X′=Max(Xij)−Min(Xij)Xij−Min(Xij)
(2) For negative indicators ( The smaller the better indicator )
X ′ = M a x ( X i j ) − X i j M a x ( X i j ) − M i n ( X i j ) X' = \frac{Max(X_{ij})-X_{ij}}{Max(X_{ij})-Min(X_{ij})} X′=Max(Xij)−Min(Xij)Max(Xij)−Xij
3、 Computation first j j j Item... Under this indicator i i i The proportion of samples in this index
Calculate the sample weight :
P i j = X i j ∑ i = 1 n X i j P_{ij} = \frac{X_{ij}}{\sum_{i=1}^nX_{ij}} Pij=∑i=1nXijXij
4、 Computation first j j j The entropy of this index
Calculate the index entropy :
e j = − 1 l n ( m ) ∗ ∑ i = 1 m ( P i j ∗ l n ( P i j ) ) e_j = -\frac{1}{ln(m)}*\sum_{i=1}^m(P_{ij}*ln(P_{ij})) ej=−ln(m)1∗i=1∑m(Pij∗ln(Pij))
, among m Is the number of samples .
5、 Computation first j j j The difference coefficient of each index
The information utility value of an index depends on the information entropy and 1 Difference between , Its value directly affects the size of the weight . The greater the value of information utility , The greater the importance of evaluation , The greater the weight .
d j = 1 − e j d_j=1-e_j dj=1−ej
6、 Calculate the weight of evaluation index
Use entropy method to estimate the weight of each index , Its essence is to use the difference coefficient of the index information to calculate , The higher the coefficient of difference , The greater the importance of evaluation ( Or the greater the weight , The greater the contribution to the evaluation results )
The first j jj The weight of each indicator :
w j = d j ∑ j = 1 m d j w_j=\frac{d_j}{\sum_{j=1}^md_j} wj=∑j=1mdjdj
7、 Calculate the comprehensive score of each sample
z i = ∑ j = 1 m w j x i j z_i=\sum_{j=1}^mw_jx_{ij} zi=j=1∑mwjxij
Two 、 Test cases
1、 This case data set is based on 2012 Mathematical modeling of national college students A Take some data of question as an example
| Sample No | Total amino acids | Aspartic acid | Threonine | Serine | Glutamate | Proline |
|---|---|---|---|---|---|---|
| Grape samples 1 | 2027.96 | 101.22 | 393.42 | 77.61 | 266.6 | 723.88 |
| Grape samples 2 | 2128.82 | 64.43 | 140.62 | 71.94 | 39.26 | 1560.97 |
| Grape samples 3 | 8397.28 | 108.07 | 222.35 | 173.08 | 67.54 | 7472.28 |
| Grape samples 4 | 2144.68 | 79.39 | 133.83 | 158.74 | 156.72 | 1182.23 |
| Grape samples 5 | 1844 | 52.28 | 145.09 | 164.05 | 102.43 | 816.08 |
| Grape samples 6 | 3434.17 | 68.01 | 102.42 | 75.78 | 80.6 | 2932.76 |
| Grape samples 7 | 2391.16 | 65.1 | 267.76 | 239.2 | 208.97 | 1096.28 |
| Grape samples 8 | 1950.76 | 72.09 | 345.87 | 44.23 | 176.02 | 962.01 |
2、 Complete code
import numpy as np
import pandas as pd

##  Reading data
data=pd.read_csv('redputao.csv',encoding='utf-8',index_col=0)
indicator=data.columns.tolist()   ##  The number of indicators   How many columns
project=data.index.tolist()       ##  Number of samples   How many rows?
value=data.values
print(indicator)
print(project)
print(value)


##  Define data standardization functions . In order to avoid the meaningless logarithm when calculating entropy , Translate the data , A constant is added to the standardized data 0.001
def std_data(value,flag):
    for i in range(len(indicator)):
        if flag[i]=='+':
            value[:,i]=(value[:,i]-np.min(value[:,i],axis=0))/(np.max(value[:,i],axis=0)-np.min(value[:,i],axis=0))+0.01
        elif flag[i]=='-':
            value[:,i]=(np.max(value[:,i],axis=0)-value[:,i])/(np.max(value[:,i],axis=0)-np.min(value[:,i],axis=0))+0.01
    return value


#  Define entropy function 、 Entropy method calculates the weight of variables
def cal_weight(indicator, project, value):
    p = np.array([[0.0 for i in range(len(indicator))] for i in range(len(project))])
    # print(p)
    for i in range(len(indicator)):
        p[:, i] = value[:, i] / np.sum(value[:, i], axis=0)

    e = -1 / np.log(len(project)) * sum(p * np.log(p))  #  Calculate the entropy
    g = 1 - e  #  Calculate the degree of consistency
    w = g / sum(g)  #  Calculate weight
    return w

#  Indicates whether each indicator is a positive indicator or a negative indicator
flag=["+","+","+","+","+",    "+","+","+","+","+",
      "+","+","+","+","+",    "+","+","+","+","+",
      "+","+","+","+","+",    "+","+","+","+","+",
      "+","+","+","+","+",    "+","+","+","+","+",
      "+","+","+","+","+",    "+","+","+","+","+",
      "+","+","+","+"]

#  Call the function to standardize the data , That is, add a positive or negative correlation flag for each data
std_value=std_data(value, flag)

#  Call the function to calculate the weight
w = cal_weight(indicator, project, std_value)
w = pd.DataFrame(w, index=data.columns, columns=[' The weight '])
print(w)

#  Call the function to get the score
score = np.dot(std_value, w).round(4)         #  The corresponding data is multiplied by the weight to get the score , Keep the result to four decimal places
score = pd.DataFrame(score, index=data.index, columns=[' Comprehensive score ']).sort_values(by=[' Comprehensive score '], ascending=False)
print(score)
3、 ... and 、 Test case running results
Running results 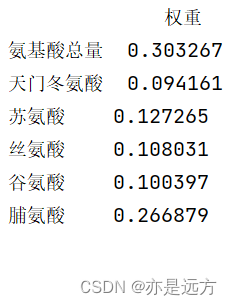

Four 、 Test forms
1、 Directly copy the above table to Excel
2、csv Download link Extraction code :1234
边栏推荐
- [LZY learning notes dive into deep learning] 3.4 3.6 3.7 softmax principle and Implementation
- LeetCode - 715. Range module (TreeSet)*****
- Leetcode刷题---263
- 熵值法求权重
- Advantageous distinctive domain adaptation reading notes (detailed)
- 20220608 other: evaluation of inverse Polish expression
- Leetcode skimming ---832
- Adaptive Propagation Graph Convolutional Network
- Leetcode刷题---283
- The imitation of jd.com e-commerce project is coming
猜你喜欢
![Step 1: teach you to trace the IP address of [phishing email]](/img/a5/c30bc51da560c4da7fc15f434dd384.png)
Step 1: teach you to trace the IP address of [phishing email]
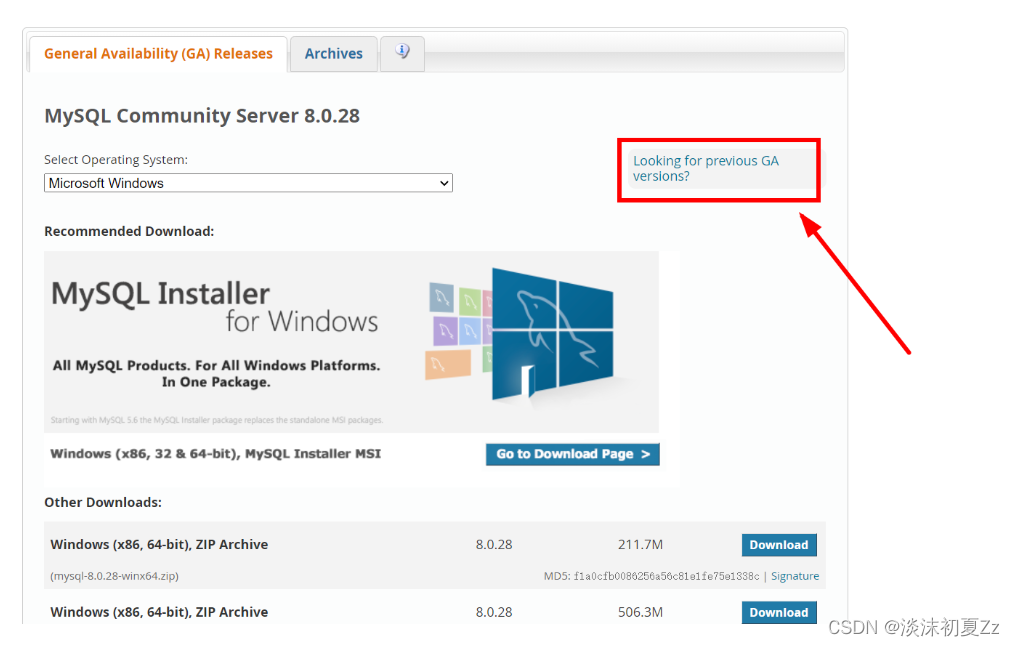
mysql5.7安装和配置教程(图文超详细版)

Leetcode - 705 design hash set (Design)

Realize an online examination system from zero
Linear regression of introduction to deep learning (pytorch)
Preliminary knowledge of Neural Network Introduction (pytorch)

Convolutional neural network (CNN) learning notes (own understanding + own code) - deep learning
What did I read in order to understand the to do list

An open source OA office automation system

A super cool background permission management system
随机推荐
Softmax 回归(PyTorch)
Yolov5 creates and trains its own data set to realize mask wearing detection
Adaptive Propagation Graph Convolutional Network
Judging the connectivity of undirected graphs by the method of similar Union and set search
六、MySQL之数据定义语言(一)
Hands on deep learning pytorch version exercise solution - 3.1 linear regression
High imitation Netease cloud music
20220604 Mathematics: square root of X
Leetcode skimming ---263
Leetcode skimming ---75
Policy gradient Method of Deep Reinforcement learning (Part One)
Weight decay (pytorch)
An open source OA office automation system
深度学习入门之线性回归(PyTorch)
Hands on deep learning pytorch version exercise solution - 2.4 calculus
Leetcode - the k-th element in 703 data flow (design priority queue)
Matrix calculation of Neural Network Introduction (pytoch)
Configure opencv in QT Creator
Ut2013 learning notes
Leetcode刷题---189