当前位置:网站首页>Matplotlib draws three-dimensional scatter and surface graphs
Matplotlib draws three-dimensional scatter and surface graphs
2022-07-05 04:26:00 【Bai Yanling】
This blog post mainly introduces how to use matplotlib The library draws three-dimensional scatter diagrams and surface diagrams .
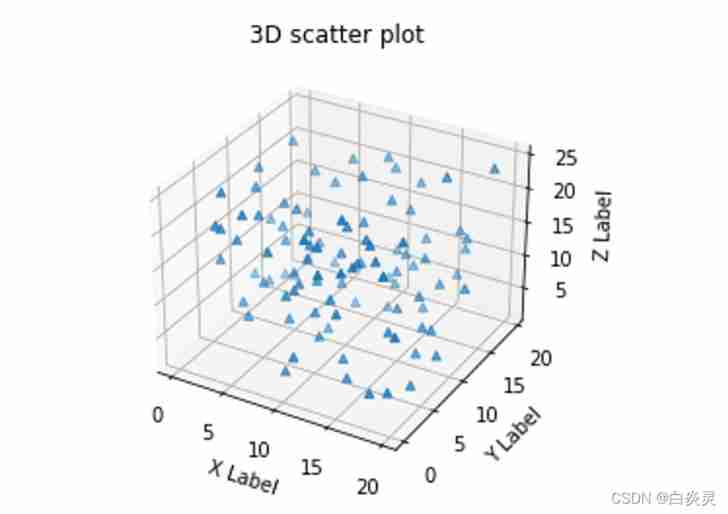
Three dimensional scatter plot
numpy Of random.rand(d0,d1,d2…) Function generates obedience according to dimension 0~1 Uniformly distributed random sample points ;
x、y、z They are all one-dimensional arrays
# -*- coding: utf-8 -*-

import matplotlib.pyplot as plt
import numpy as np

def randrange(n, vmin, vmax):
    return (vmax - vmin)*np.random.rand(n)

fig = plt.figure()
ax = fig.add_subplot(projection="3d")

n = 100
x = randrange(n,0,20)
y = randrange(n,0,20)
z = randrange(n,-30,-5)

ax.scatter(x,y,z,marker="^")
ax.set_xlabel("X Label")
ax.set_ylabel("Y Label")
ax.set_zlabel("Z Label")

ax.set_title("3D scatter plot")
plt.show()
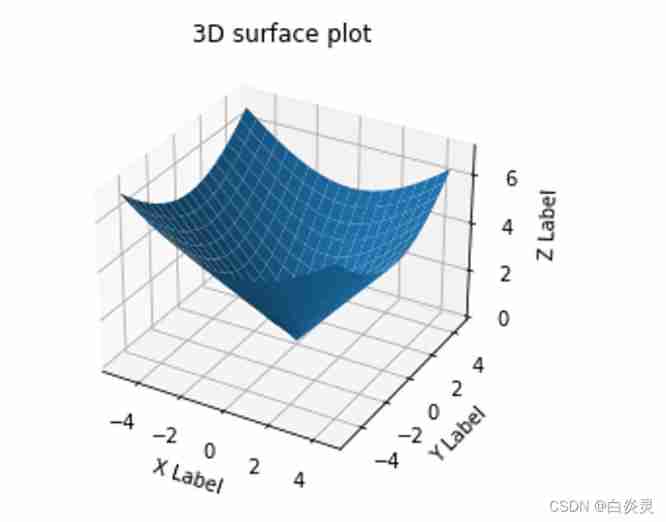
3D Surface graph
Here we need to use numpy Of meshgrid() Function generation x and y Grid point coordinates (x,y), That is to say, put the first and second coordinates of the elements in the Cartesian product of two arrays into two matrices respectively . When drawing a surface ,z It has to be two-dimensional .
import matplotlib.pyplot as plt
import numpy as np

fig = plt.figure()
ax = fig.add_subplot(projection="3d")

x = np.arange(-5,5,0.5)
y = np.arange(-5,5,0.5)
x,y = np.meshgrid(x, y)
z = np.sqrt(x**2 + y**2)

ax.plot_surface(x,y,z)
ax.set_xlabel("X Label")
ax.set_ylabel("Y Label")
ax.set_zlabel("Z Label")

ax.set_title("3D surface plot")
plt.show()
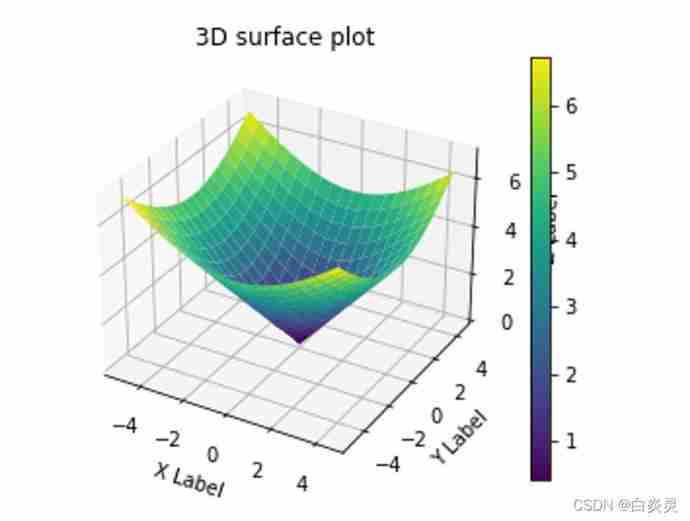
When drawing a surface , We can also add color and colorbar
import matplotlib.pyplot as plt
import numpy as np

fig = plt.figure()
ax = fig.add_subplot(projection="3d")

x = np.arange(-5,5,0.5)
y = np.arange(-5,5,0.5)
x,y = np.meshgrid(x, y)
z = np.sqrt(x**2 + y**2)

#rstride Indicates the line step size ,cmap Color the surface
surf = ax.plot_surface(x,y,z,rstride=1,cstride=1,cmap=plt.cm.viridis)
#colorbar You can add a color bar to the image
fig.colorbar(surf)
ax.set_xlabel("X Label")
ax.set_ylabel("Y Label")
ax.set_zlabel("Z Label")

ax.set_title("3D surface plot")
plt.show()
边栏推荐
猜你喜欢

Fuel consumption calculator

Threejs rendering obj+mtl model source code, 3D factory model

美国5G Open RAN再遭重大挫败,抗衡中国5G技术的图谋已告失败
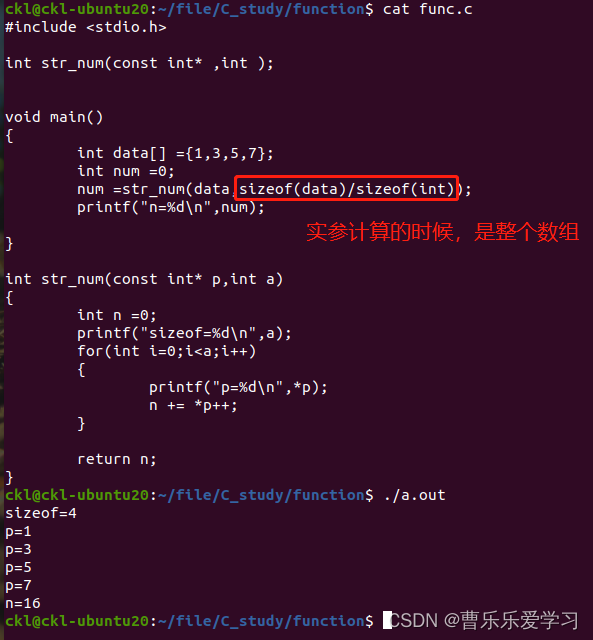
Fonction (sujette aux erreurs)
![[phantom engine UE] realize the animation production of mapping tripod deployment](/img/89/351641c3da7e2acdbf389bc298b75e.png)
[phantom engine UE] realize the animation production of mapping tripod deployment
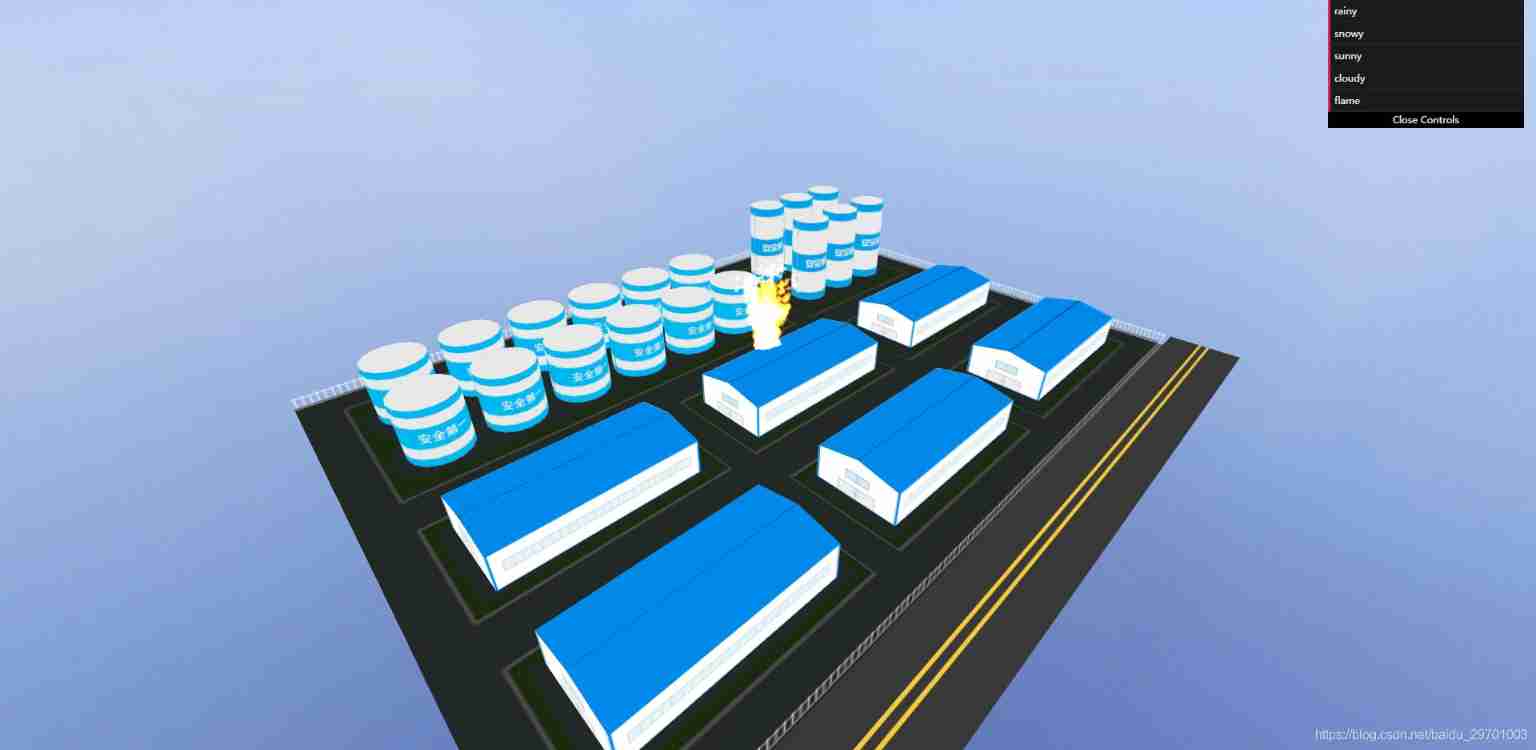
Threejs Internet of things, 3D visualization of factory
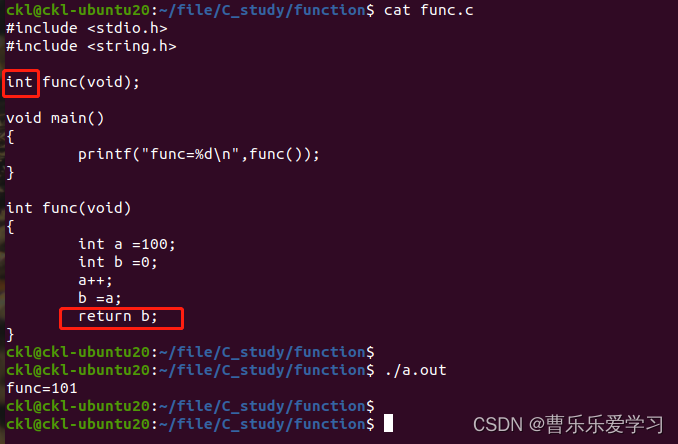
Pointer function (basic)
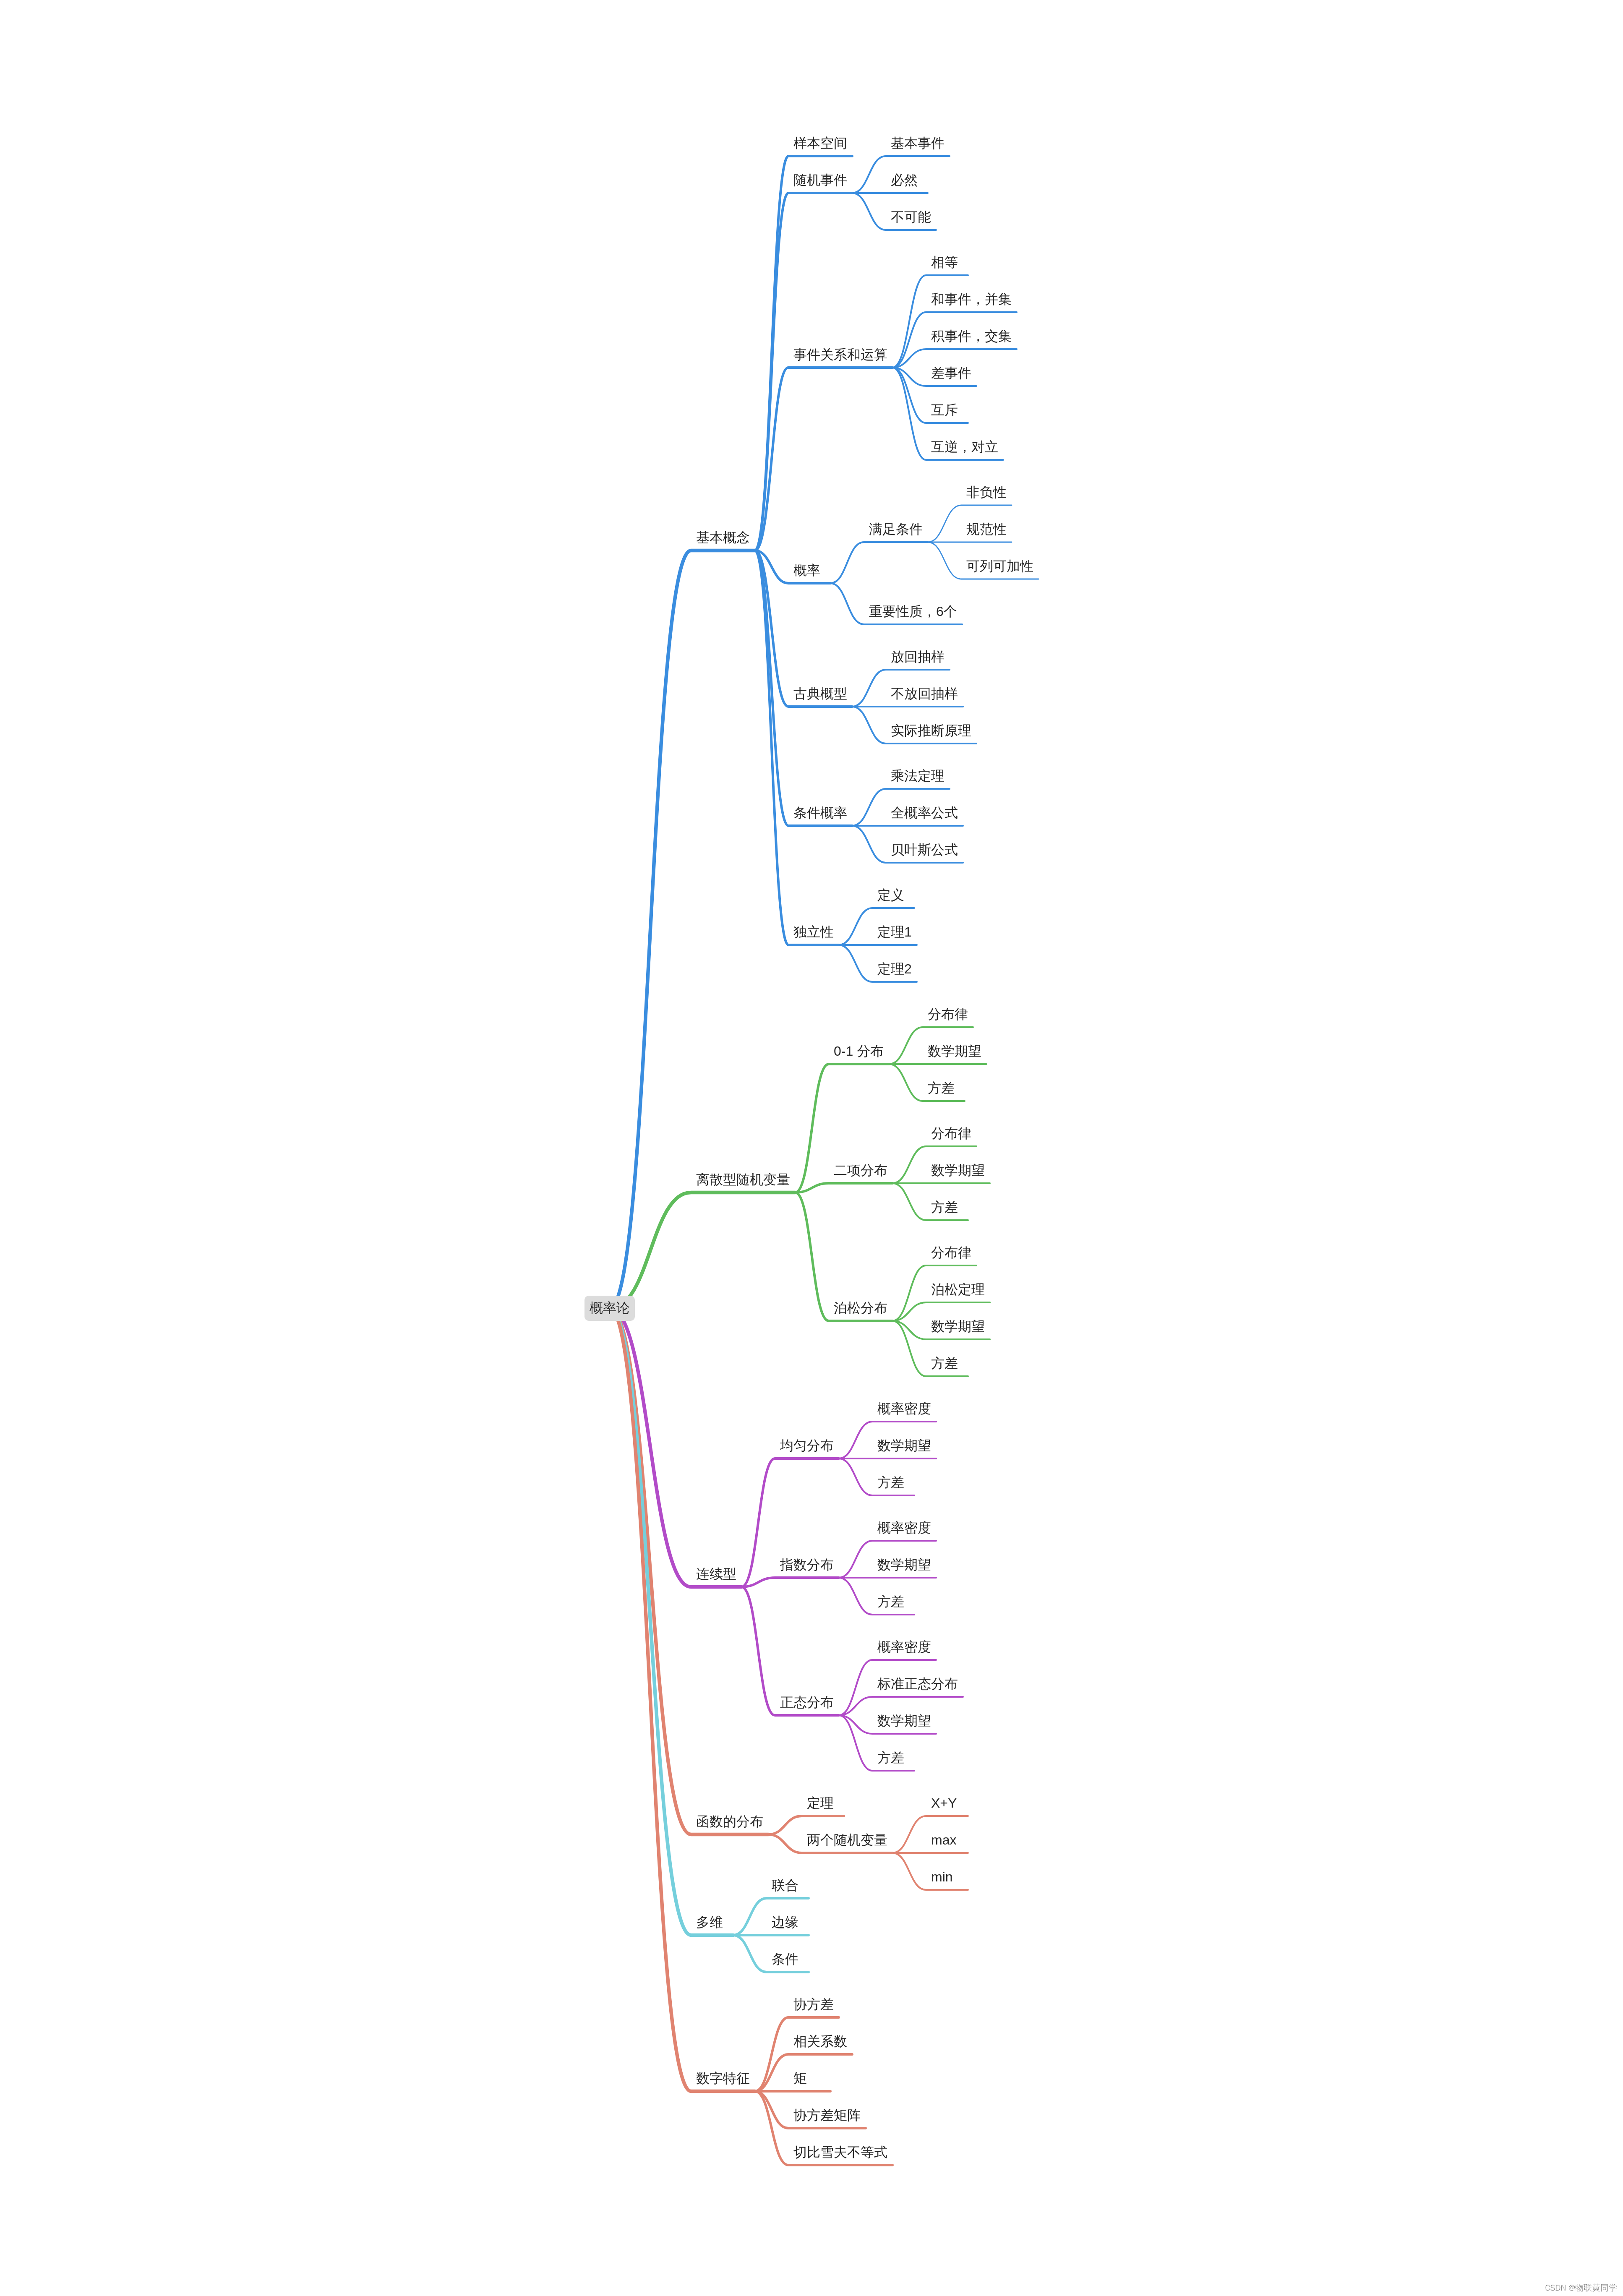
概率论与数理统计考试重点复习路线

快手、抖音、视频号交战内容付费

The scale of computing power in China ranks second in the world: computing is leaping forward in Intelligent Computing
随机推荐
Mixed compilation of C and CC
美国5G Open RAN再遭重大挫败,抗衡中国5G技术的图谋已告失败
【虛幻引擎UE】實現UE5像素流部署僅需六步操作少走彎路!(4.26和4.27原理類似)
[finebi] the process of making custom maps using finebi
How to get the first few pieces of data of each group gracefully
Study notes 7
【虚幻引擎UE】实现背景模糊下近景旋转操作物体的方法及踩坑记录
A應用喚醒B應該快速方法
程序员应该怎么学数学
Decimal to hexadecimal
官宣!第三届云原生编程挑战赛正式启动!
Threejs rendering obj+mtl model source code, 3D factory model
FFmepg使用指南
揭秘技术 Leader 必备的七大清奇脑回路
Cookie learning diary 1
防护电路中的元器件
Sequelize. JS and hasmany - belongsto vs hasmany in serialize js
Bit operation skills
托管式服务网络:云原生时代的应用体系架构进化
概率论与数理统计考试重点复习路线