当前位置:网站首页>Seaborn绘制11个柱状图
Seaborn绘制11个柱状图
2022-07-05 15:43:00 【俊红的数据分析之路】
本文介绍的是如何使用seaborn来绘制各种柱状图
基础柱状图
水平柱状图
标题设置
基于DataFrame绘图
hue参数设置
颜色处理
多维度处理
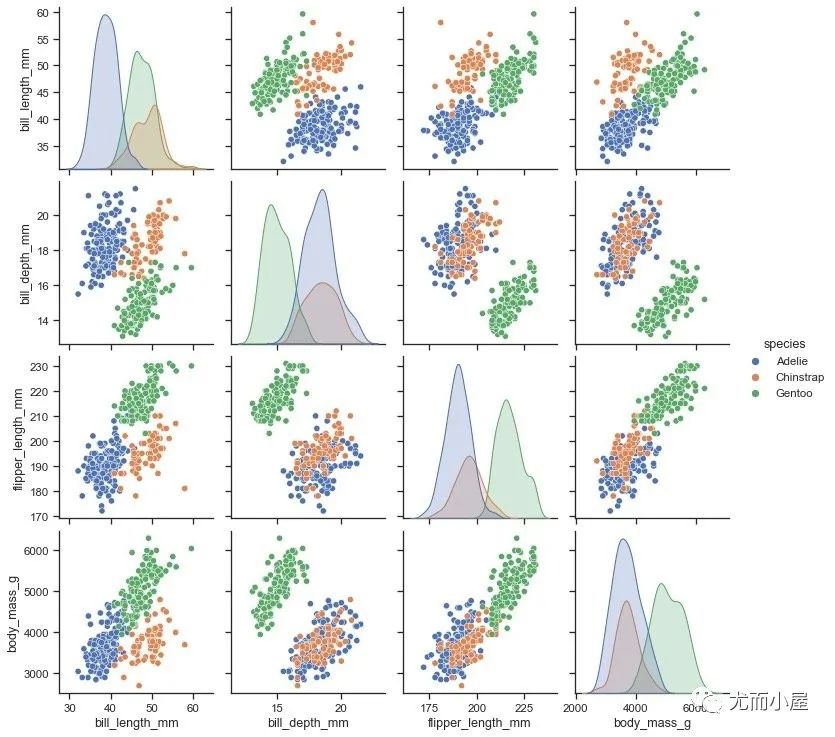
个人很喜欢的一个Seaborn绘制的图形:
导入库
Seaborn是matplotlib的高级封装,所以matplotlib还是要同时导入:
In [1]:
import pandas as pd
import numpy as np

import matplotlib.pyplot as plt
import seaborn as sns
%matplotlib inline

sns.set_theme(style="whitegrid")
sns.set_style('darkgrid')
导入内置数据
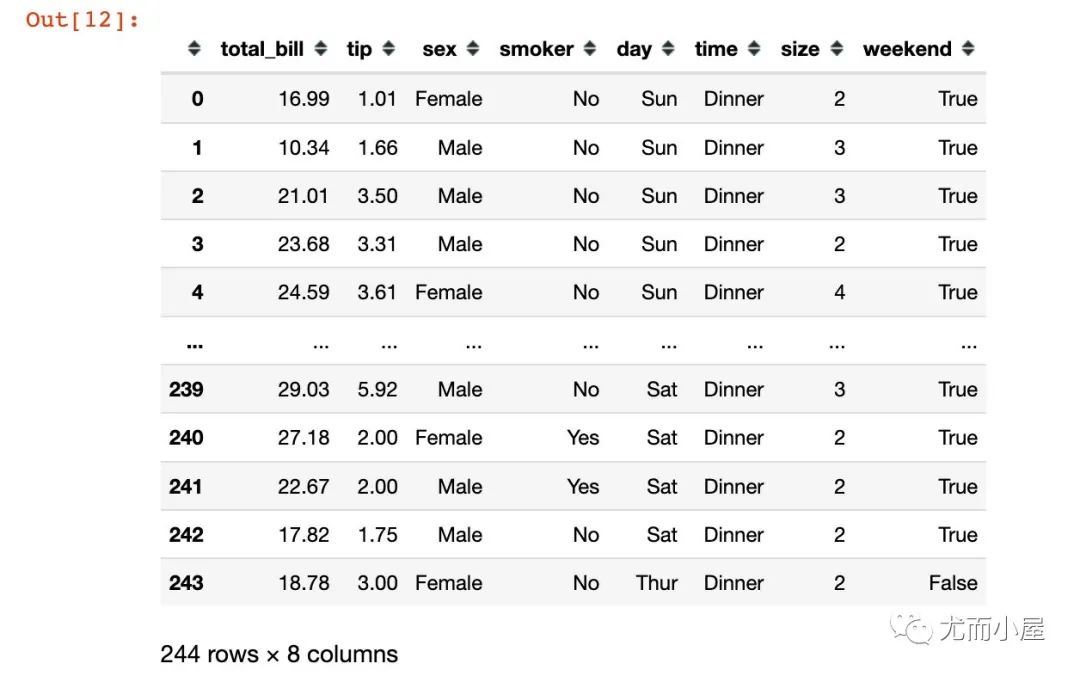
使用的是seaborn中内置的一份消费tips数据集:
In [2]:
tips = sns.load_dataset("tips")
tips.head()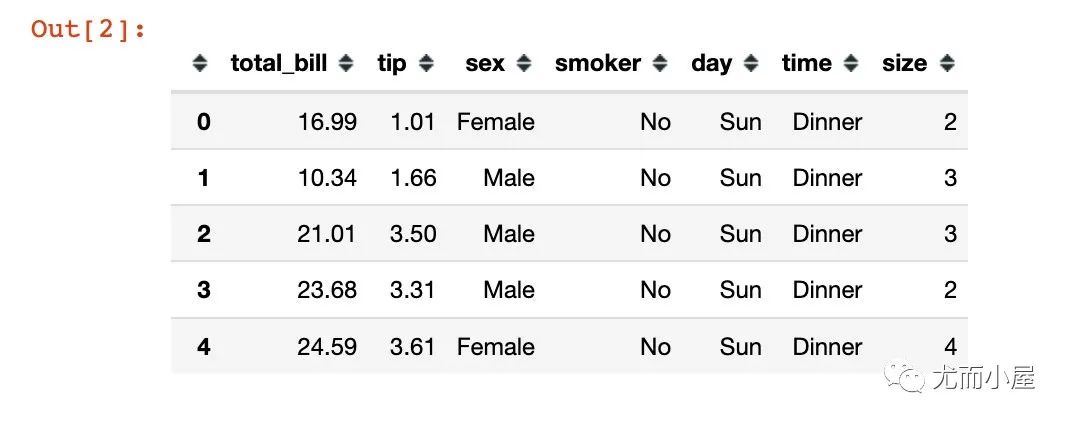
基础柱状图
In [3]:
x = ["A","B","C"]
y = [1, 2, 3]

sns.barplot(x, y)
plt.show()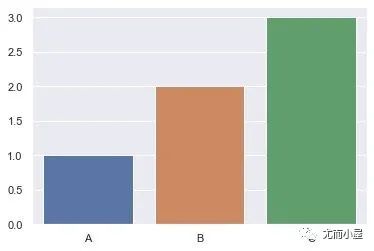
绘制水平柱状图:
# 水平柱状图

x = ["A","B","C"]
y = [1, 2, 3]

sns.barplot(y, x)
plt.show()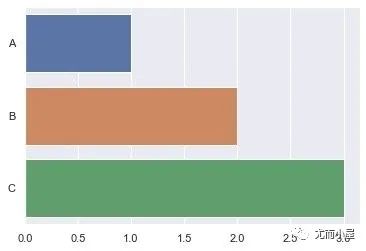
设置标题
In [14]:
x = ["A","B","C"]
y = [1, 2, 3]

fig = sns.barplot(x, y)
fig.set_title('title of seaborn')

plt.show()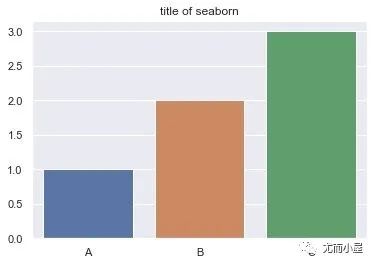
指定x-y-data
In [5]:
# 通过DataFrame来指定

ax = sns.barplot(x="day", y="tip", data=tips)
plt.show()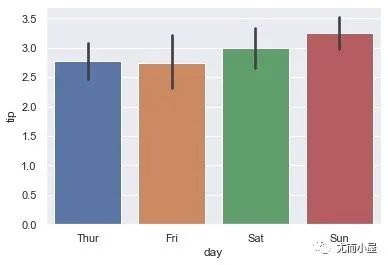
hue参数
实现的分组显示数据
In [6]:
ax = sns.barplot(x="day",
        y="total_bill",
        hue="sex",
        data=tips)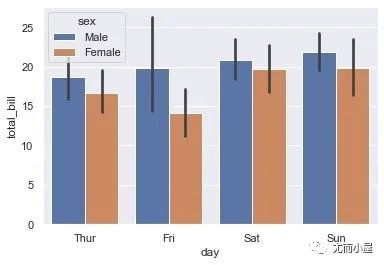
水平柱状图
In [7]:
ax = sns.barplot(x="total_bill",
                 y="day",
                 data=tips)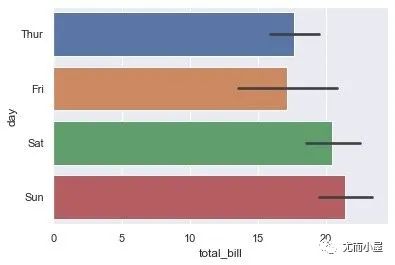
自定义顺序
In [8]:
ax = sns.barplot(x="total_bill",
                 y="day",
                 # 添加order参数,指定顺序
                 order=["Sat","Fri","Sun","Thur"],  # 自定义
                 data=tips)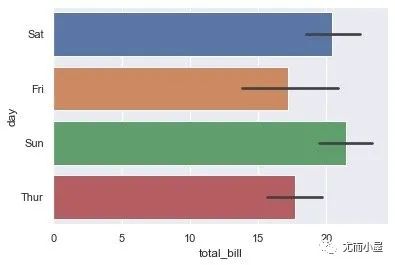
颜色处理
使用一种颜色
In [9]:
ax = sns.barplot(x="size",
                 y="total_bill",
                 data=tips,
                 color="salmon",
                 saturation=.5)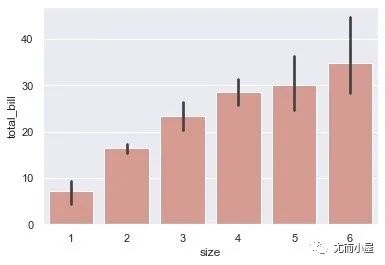
颜色渐变
In [10]:
ax = sns.barplot(x="size",
                 y="tip",
                 data=tips,
                 palette="Blues")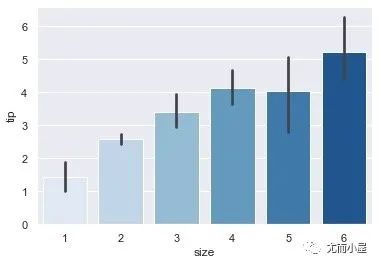
多维分组
In [11]:
g = sns.catplot(x="sex",
                y="total_bill",
                hue="smoker",
                col="time",
                data=tips,
                kind="bar",
                height=4,
                aspect=.7)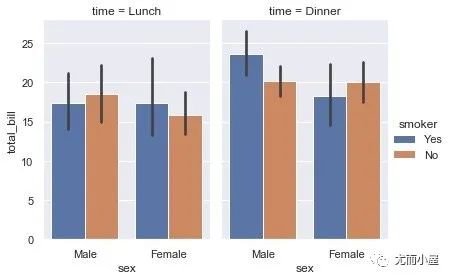
True/False分组
In [12]:
tips["weekend"] = tips["day"].isin(["Sat", "Sun"])
tips
Out[12]:
In [13]:
ax = sns.barplot(x="day",
                 y="tip",
                 hue="weekend",
                 data=tips,
                 dodge=False)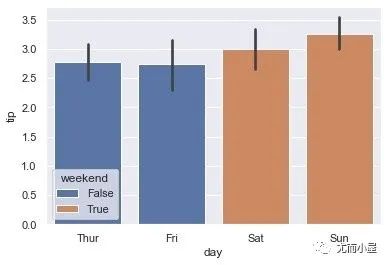
- END -边栏推荐
- 研发效能度量指标构成及效能度量方法论
- verilog实现计算最大公约数和最小公倍数
- [vulnerability warning] cve-2022-26134 conflict Remote Code Execution Vulnerability POC verification and repair process
- RepLKNet:不是大卷积不好,而是卷积不够大,31x31卷积了解一下 | CVPR 2022
- 企业级备份软件Veritas NetBackup(NBU) 8.1.1服务端的安装部署
- Coding devsecops helps financial enterprises run out of digital acceleration
- DataArts Studio数据架构——数据标准介绍
- 项目中批量update
- Noi / 1.4 07: collect bottle caps to win awards
- vlunhub- BoredHackerBlog Moriarty Corp
猜你喜欢
Research and development efficiency measurement index composition and efficiency measurement methodology
CISP-PTE之SQL注入(二次注入的应用)
Vulnhub-Moneybox

Quick completion guide for manipulator (IX): forward kinematics analysis
![17.[STM32]仅用三根线带你驱动LCD1602液晶](/img/c6/b56c54da2553a451b526179f8b5867.png)
17.[STM32]仅用三根线带你驱动LCD1602液晶
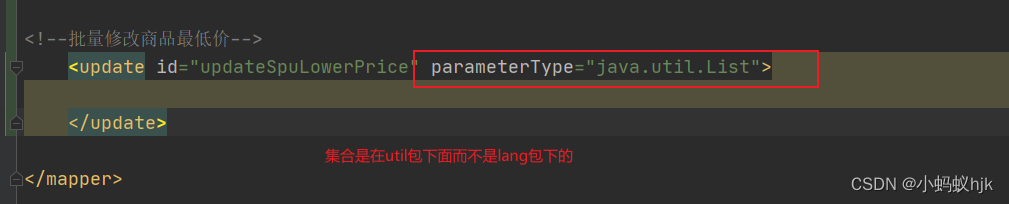
项目sql中批量update的时候参数类型设置错误

具有倍数关系的时钟切换

示例项目:简单的六足步行者
Intelligent metal detector based on openharmony
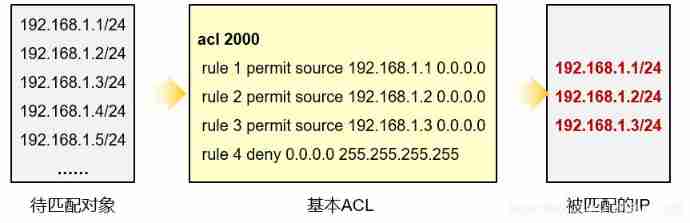
Data communication foundation ACL access control list
随机推荐
Batch update in the project
漫画:什么是蓝绿部署?
Find the root of the following equation by chord cutting method, f (x) =x^3-5x^2+16x-80=0
Using graylog alarm function to realize the regular work reminder of nail group robots
CISP-PTE之PHP伪协议总结
研发效能度量指标构成及效能度量方法论
The computer is busy, and the update is a little slow
自己要有自己的坚持
Coding devsecops helps financial enterprises run out of digital acceleration
后台系统发送验证码功能
效果编辑器新版上线!3D渲染、加标注、设置动画,这次一个编辑器就够了
MySQL giant pit: update updates should be judged with caution by affecting the number of rows!!!
RepLKNet:不是大卷积不好,而是卷积不够大,31x31卷积了解一下 | CVPR 2022
17. [stm32] use only three wires to drive LCD1602 LCD
20.[STM32]利用超声波模块和舵机实现智能垃圾桶功能
The list set is summed up according to a certain attribute of the object, the maximum value, etc
ES6 deep - ES6 class class
The database of the server is not connected to 200310060 "unknown error" [the service is up, the firewall is off, the port is on, and the netlent port is not connected]
16.[STM32]从原理开始带你了解DS18B20温度传感器-四位数码管显示温度
具有倍数关系的时钟切换