当前位置:网站首页>Matplotlib快速入门
Matplotlib快速入门
2022-07-07 21:42:00 【51CTO】
Matplotlib是什么?
Matplotlib是一个全面的库,用于在Python中创建静态,动画和交互式的可视化图像。
目前(22年6月)最新稳定版是3.5.2
安装:
使用pip进行安装
pip install matplotlib
快速上手
我们首先要导入matplotlib
Matplotlib在图(Figure)(例如,窗口,Jupyter小部件等)上绘制数据,图可以包含一个或多个轴域(Axes)。
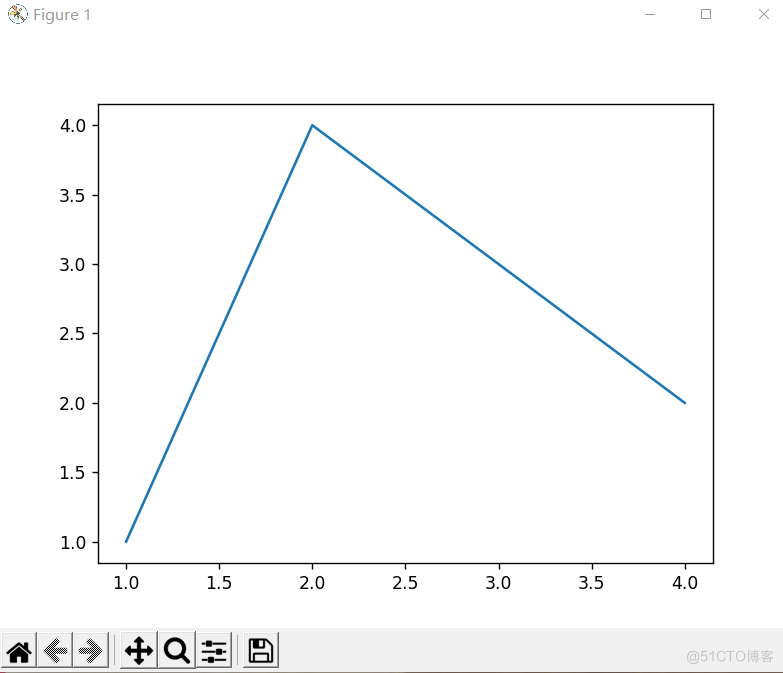
Axes是一个可以根据x-y坐标指定点的绘图区域(或极坐标图中的θ-r,3D图中的x-y-z等)。创建带有Axes的图的最简单方法是使用 pyplot.subplots。然后,我们可以使用 Axes.plot在Axes上绘制一些数据:
运行后将显示折线图:
图(Figure)的结构
一幅图有下面这些部分:标题(Title)、图例(Legend)、x、y轴标签(xlabel、ylabel)等等......
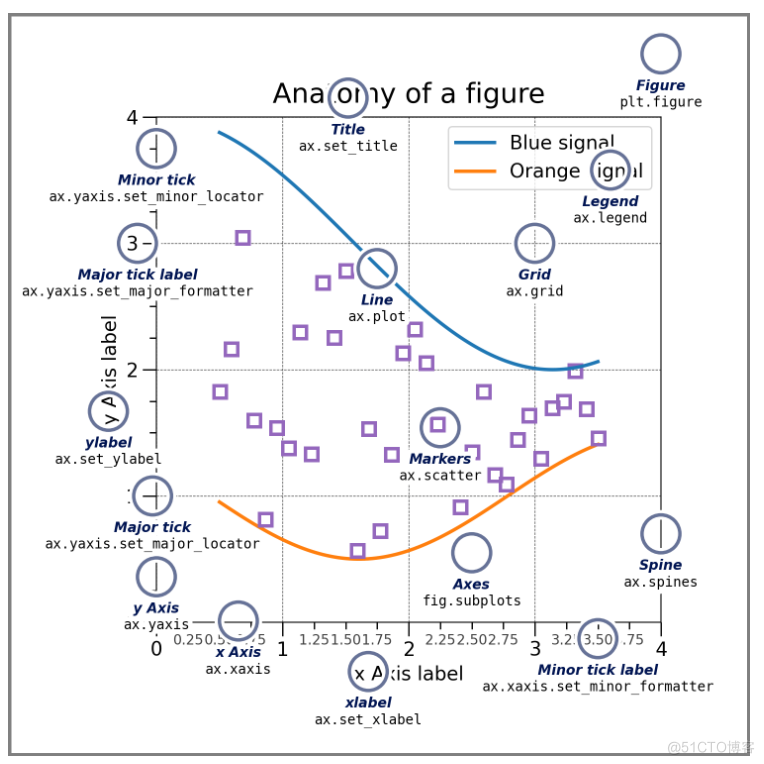
下面逐个部分介绍。
图 Figure
完整的图像。该图跟踪所有子轴域(Axes)---- 一组“特殊”画作(标题,图例,彩条等),甚至嵌套的子图。
创建新图的最简单方法是使用 pyplot:
通常,将轴域(Axes)与 Figure 一起创建很方便,但您也可以在以后手动添加轴域。
轴域 Axes
轴域(Axes)是附加到图(Figure)上,包含用于绘制数据的图形。
通常包括两个轴(Axis)对象。两个轴分别提供刻度(ticks)和标签(tick label),以便为轴中的数据提供比例。每个 轴域还有一个标题(通过 set_title())设置)、一个 x 标签(通过 set_xlabel()) 设置)和一个y 标签(通过 set_ylabel()) 设置)。
Axes 类及其成员函数是使用 OOP 接口的主要入口点,并且在其上定义了大多数绘图方法(例如,如上所示,使用 plot方法)ax.plot()
轴 Axis
轴设置刻度(scale)和限制(limits)并且生成刻度(ticks,轴上的标记)和刻度标签(ticklabels,标记刻度的字符串)ticks位置由定位器(Locator)确定,ticklabel 字符串由 格式器(Formatter)设置。正确的 定位器(Locator)和 格式器(Formatter)的组合可以对刻度位置和标签进行非常精细的控制。
Artist
Artist这里翻译成艺术家或画家了。
基本上,图形上可见的所有内容都是艺术家(甚至是 图形, 轴域和 轴对象)。这包括 文本、 Line2D 、 集合、 Patch等。渲染图形时,所有艺术家都将被绘制到画布上。大多数艺术家都与轴域关联;这样的艺术家不能由多个轴域共享,也不能从一个轴移动到另一个轴。
绘图函数的输入数据类型
绘图函数接收 numpy.array或numpy.ma.masked_array作为输入,或者是可以被传递给numpy.asarray的数据。pandas数据或numpy.matrix可能不会正常工作。常见的约定是在绘图前将数据转换成numpy.array。例如:
大多数方法还可以解析可寻址对象,如 dict,np.recarray或pandas.DataFrame。
Matplotlib允许使用关键字参数生成图像,传递和x,y相应的字符串。
绘制出来的图,第二幅是去掉了s,c参数后的图像:

编码风格 Coding Styles
面向对象(OO)和pyplot函数接口。
基本上有两种使用 Matplotlib 的方法:
- 显式创建“图形(Figures)”和“轴域(Axes)”,并在其上调用方法(“面向对象 (OO) 样式”)。
- 依靠 pyplot 自动创建和管理图形和轴,并使用 pyplot 函数进行绘图。
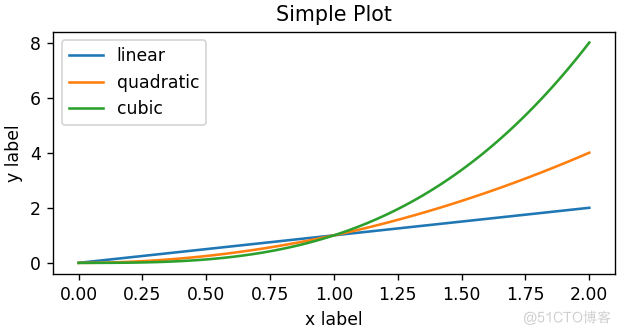
使用OO样式(笔者觉得OO样式比较好,只需要在轴域(Axes)对象上设置就可以,非常清晰):
或者使用pyplot函数风格:
(此外,还有第三种方法,用于在GUI应用程序中嵌入Matplotlib的情况,即使对于图形创建也是如此。有关详细信息,请参阅库中的相应部分: 在图形用户界面中嵌入 Matplotlib。
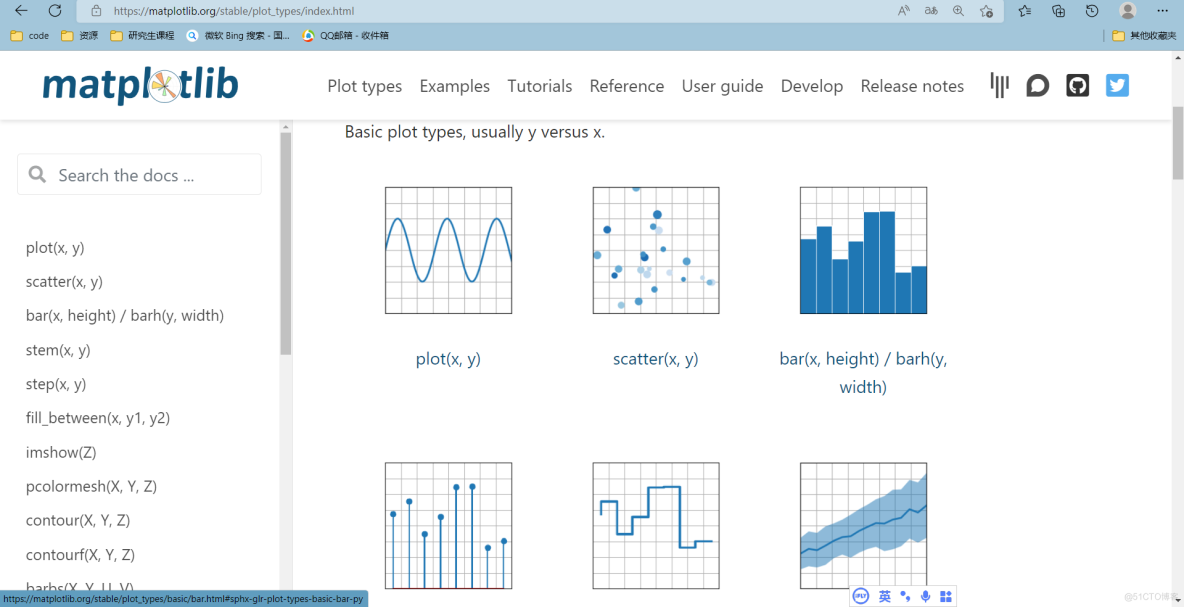
常用的绘图类型
从官网的首页 进入Plot types,就可以看到常用的不同类型的图怎么绘制了。

可以看到,常见的折线图、散点图、柱状图等。点击相应的图就可以进入对应的案例了。
主要用法基本就是这样,后面的一些样式的调整我们下回再说。
参考:
Matplotlib documentation — Matplotlib 3.5.2 documentation
https://matplotlib.org/stable/index.html
边栏推荐
- Open source OA development platform: contract management user manual
- Leetcode SQL first day
- OpenGL jobs - shaders
- [JDBC Part 1] overview, get connection, CRUD
- Which financial products will yield high returns in 2022?
- 使用 CustomPaint 绘制基本图形
- 【JDBC Part 1】概述、获取连接、CRUD
- 建立自己的网站(18)
- Win11如何解禁键盘?Win11解禁键盘的方法
- The essence of analog Servlet
猜你喜欢
PKPM 2020 software installation package download and installation tutorial
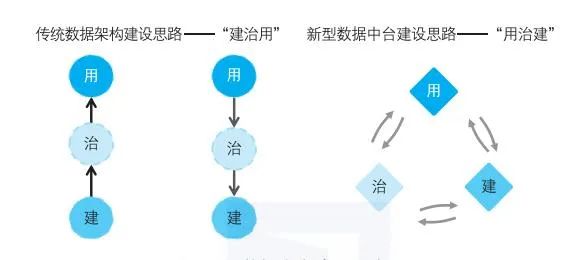
Implementation method of data platform landing
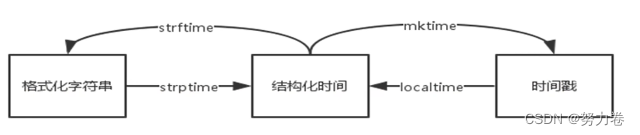
Time standard library
Preparing for the interview and sharing experience
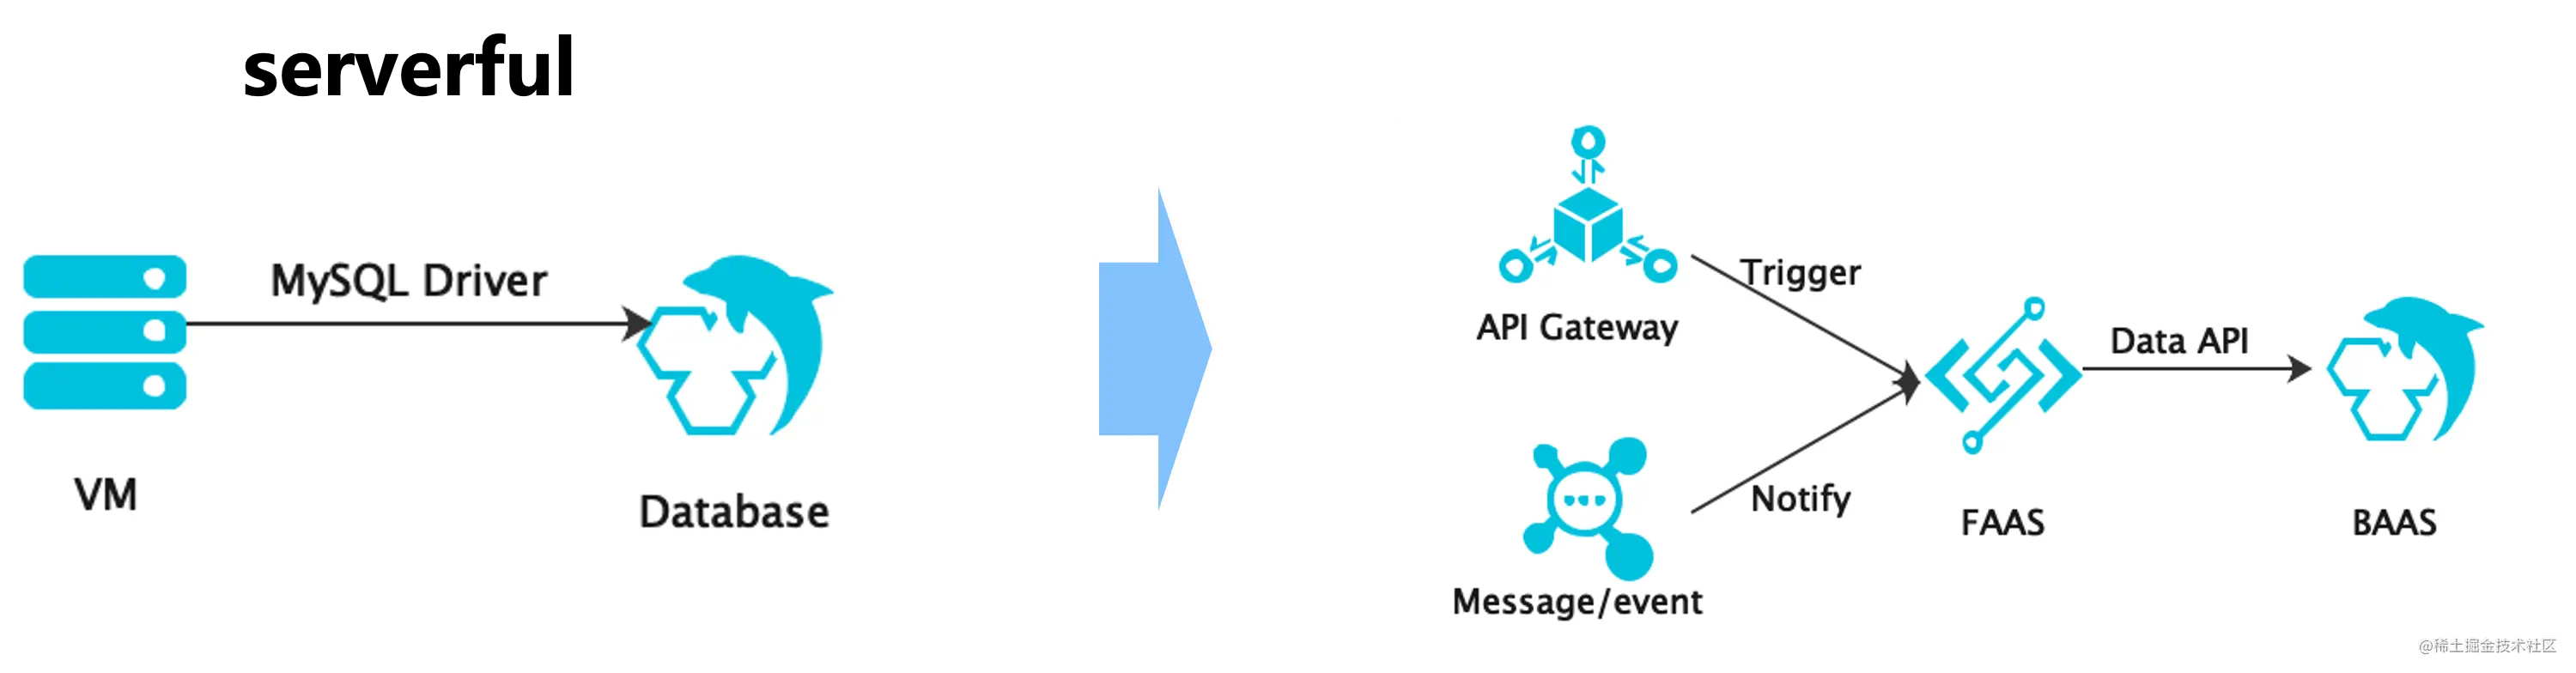
Talk about relational database and serverless
![Jerry's initiation of ear pairing, reconnection, and opening of discoverable and connectable cyclic functions [chapter]](/img/14/1c8a70102c106f4631853ed73c4d82.png)
Jerry's initiation of ear pairing, reconnection, and opening of discoverable and connectable cyclic functions [chapter]
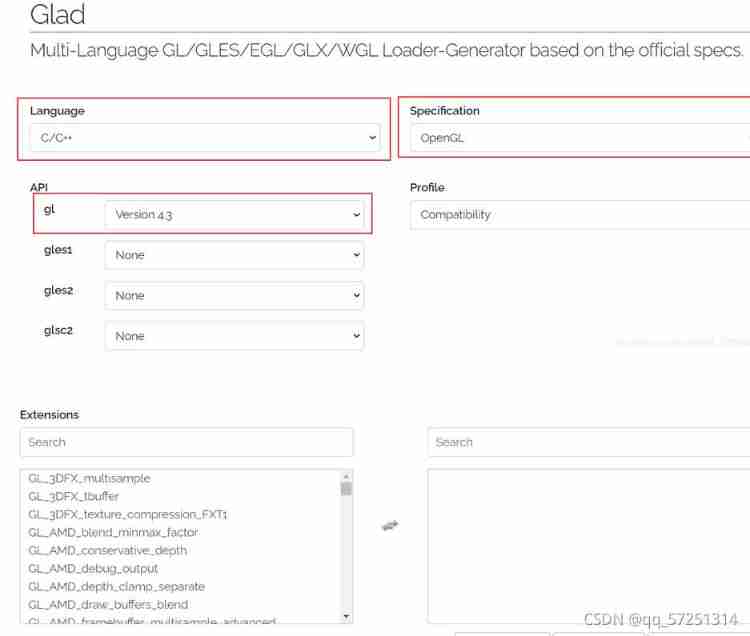
OpenGL configuration vs2019
Overseas agent recommendation
![Jerry's manual matching method [chapter]](/img/92/74281c29565581ecb761230fbfd0f3.png)
Jerry's manual matching method [chapter]
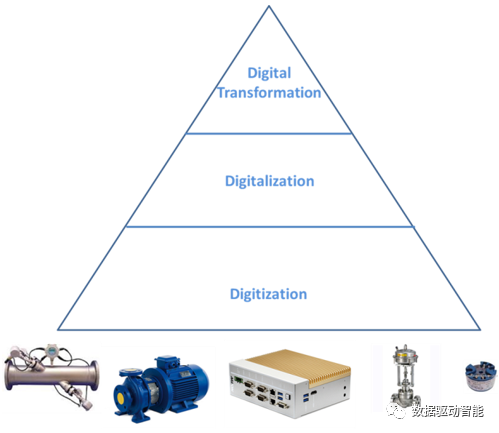
How to make agile digital transformation strategy for manufacturing enterprises
随机推荐
Interview question 01.02 Determine whether it is character rearrangement - auxiliary array algorithm
Typescript TS basic knowledge type declaration
How to write an augmented matrix into TXT file
npm uninstall和rm直接删除的区别
Oracle advanced (VI) Oracle expdp/impdp details
Debugging and handling the problem of jamming for about 30s during SSH login
100million single men and women "online dating", supporting 13billion IPOs
NVR hard disk video recorder is connected to easycvr through the national standard gb28181 protocol. What is the reason why the device channel information is not displayed?
Two kinds of updates lost and Solutions
Reptile combat (VII): pictures of the king of reptiles' heroes
谈谈制造企业如何制定敏捷的数字化转型策略
Cv2.resize function reports an error: error: (-215:assertion failed) func= 0 in function ‘cv::hal::resize‘
Display optimization when the resolution of easycvr configuration center video recording plan page is adjusted
operator
客户案例|华律网,通过观测云大幅缩短故障定位时间
强化学习-学习笔记9 | Multi-Step-TD-Target
DNS series (I): why does the updated DNS record not take effect?
Meta force force meta universe system development fossage model
Which futures company is the safest to open a futures account?
Validutil, "Rethinking the setting of semi supervised learning on graphs"