当前位置:网站首页>实战解惑 | OpenCV中如何提取不规则ROI区域
实战解惑 | OpenCV中如何提取不规则ROI区域
2022-07-04 12:52:00 【小白学视觉】
点击上方“小白学视觉”,选择加"星标"或“置顶”
重磅干货,第一时间送达什么是ROI
ROI是英文Region Of Interest的三个首字母缩写,很多时候我们对图像的分析就是对图像特定ROI的分析与理解,对细胞与医疗图像来说,ROI提取正确才可以进行后续的分析、测量、计算密度等,而且这些ROI区域往往不是矩形区域,一般都是不规则的多边形区域,很多OpenCV初学者都不知道如何提取这些不规则的ROI区域。其实OpenCV中有个非常方便的API函数可以快速提取各种非正常的ROI区域。
提取ROI区域
在做这个之前,首先来了解一下什么图像处理中的mask(遮罩),OpenCV中是如此定义Mask的:八位单通道的Mat对象,每个像素点值为零或者非零区域。当Mask对象添加到图像区上时,只有非零的区域是可见,Mask中所有像素值为零与图像重叠的区域就会不可见,也就是说Mask区域的形状与大小直接决定了你看到最终图像的大小与形状。一个具体的示例如下:

可以看出,mask的作用是可以 帮助我们提取各种不规则的区域。OpenCV中完成上述步骤操作只需要简单调用API函数 bitwise_and 即可。
于是另外一个问题也随之而来,我们怎么生成这样mask区域,答案是在OpenCV中有两种方法搞定Mask区域生成。
方法一:
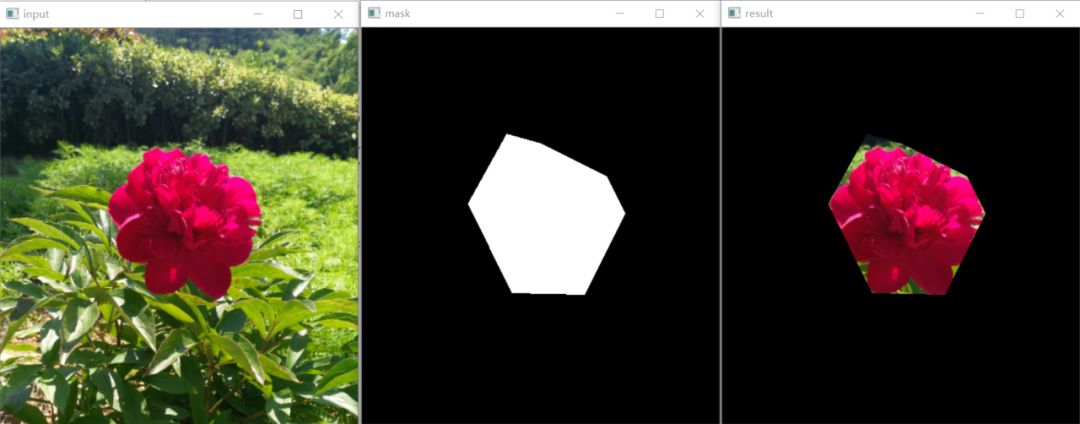
通过手动选择,然后通过多边形填充即可做到,代码实现如下:
import cv2 as cv
import numpy as np

src = cv.imread("D:/images/gc_test.png")
cv.imshow("input", src)
h, w, c = src.shape

# 手工绘制ROI区域
mask = np.zeros((h, w), dtype=np.uint8)
x_data = np.array([124, 169, 208, 285, 307, 260, 175])
y_data = np.array([205, 124, 135, 173, 216, 311, 309])
pts = np.vstack((x_data, y_data)).astype(np.int32).T
cv.fillPoly(mask, [pts], (255), 8, 0)
cv.imshow("mask", mask)

# 根据mask,提取ROI区域
result = cv.bitwise_and(src, src, mask=mask)
cv.imshow("result", result)
cv.waitKey(0)
运行效果如下:
方法二:
这个也是OpenCV新手最迷茫的地方,如何通过程序生成mask,其实真的很简单。看代码演示吧!
src = cv.imread("D:/images/gc_test.png")
cv.imshow("input", src)

# 生成mask区域
hsv = cv.cvtColor(src, cv.COLOR_BGR2HSV)
mask = cv.inRange(hsv, (156, 43, 46), (180, 255, 255))
cv.imshow("mask", mask)

# 提取ROI区域,根据mask
result = cv.bitwise_and(src, src, mask=mask)
cv.imshow("result", result)
cv.waitKey(0)
效果如下:
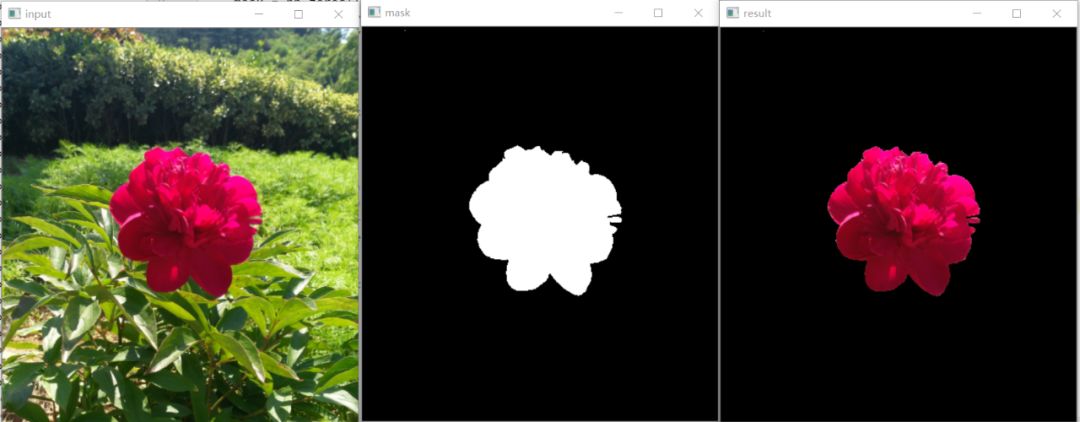
主要是分为三步
提取轮廓ROI
生成Mask区域
提取指定轮廓
特别需要注意的是->其中生成Mask可以根据轮廓、二值化连通组件分析、inRange等处理方法得到。这里基于inRange方式得到mask区域,然后提取。
实际应用演示
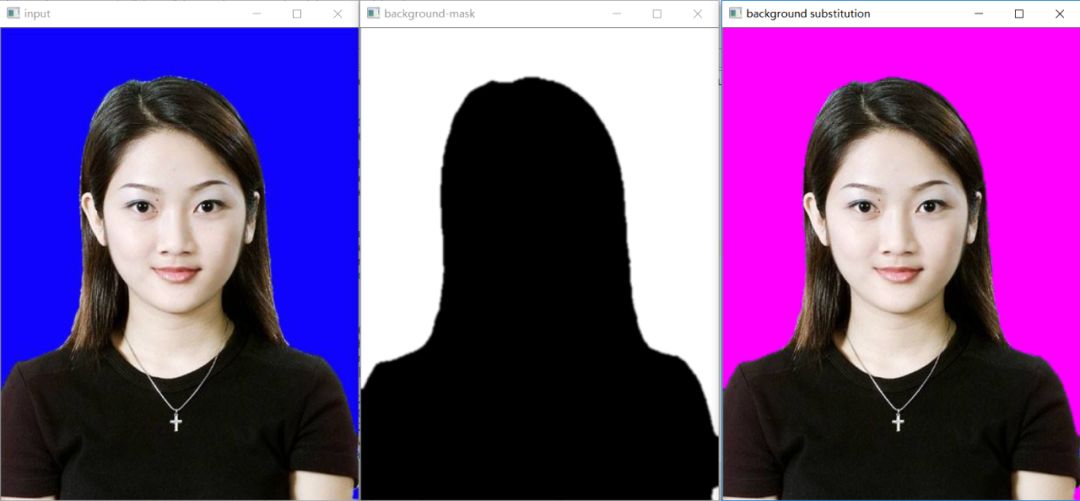
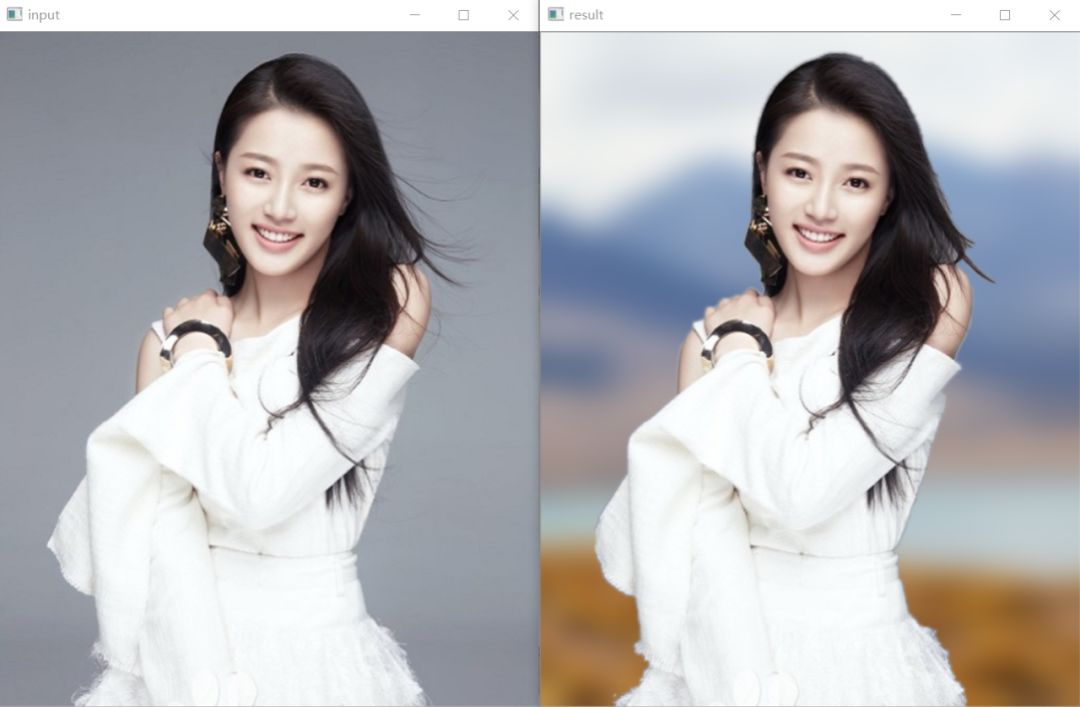
最后看两个在实际处理会用到mask实现ROI提取然后重新背景融合之后生成新图像效果:
好消息!
小白学视觉知识星球
开始面向外开放啦

下载1:OpenCV-Contrib扩展模块中文版教程

在「小白学视觉」公众号后台回复:扩展模块中文教程,即可下载全网第一份OpenCV扩展模块教程中文版,涵盖扩展模块安装、SFM算法、立体视觉、目标跟踪、生物视觉、超分辨率处理等二十多章内容。


下载2:Python视觉实战项目52讲
在「小白学视觉」公众号后台回复:Python视觉实战项目,即可下载包括图像分割、口罩检测、车道线检测、车辆计数、添加眼线、车牌识别、字符识别、情绪检测、文本内容提取、面部识别等31个视觉实战项目,助力快速学校计算机视觉。


下载3:OpenCV实战项目20讲
在「小白学视觉」公众号后台回复:OpenCV实战项目20讲,即可下载含有20个基于OpenCV实现20个实战项目,实现OpenCV学习进阶。


交流群

欢迎加入公众号读者群一起和同行交流,目前有SLAM、三维视觉、传感器、自动驾驶、计算摄影、检测、分割、识别、医学影像、GAN、算法竞赛等微信群(以后会逐渐细分),请扫描下面微信号加群,备注:”昵称+学校/公司+研究方向“,例如:”张三 + 上海交大 + 视觉SLAM“。请按照格式备注,否则不予通过。添加成功后会根据研究方向邀请进入相关微信群。请勿在群内发送广告,否则会请出群,谢谢理解~边栏推荐
- Basic mode of service mesh
- Leetcode T47: 全排列II
- sql优化之查询优化器
- codeforce:C. Sum of Substrings【边界处理 + 贡献思维 + 灵光一现】
- Unity shader learning (3) try to draw a circle
- 【信息检索】链接分析
- Ws2818m is packaged in cpc8. It is a special circuit for three channel LED drive control. External IC full-color double signal 5v32 lamp programmable LED lamp with outdoor engineering
- 数据湖(十三):Spark与Iceberg整合DDL操作
- 【Matlab】conv、filter、conv2、filter2和imfilter卷积函数总结
- GCC [6] - 4 stages of compilation
猜你喜欢
![[antd step pit] antd form cooperates with input Form The height occupied by item is incorrect](/img/96/379d1692f9d3c05a7af2e938cbc5d7.png)
[antd step pit] antd form cooperates with input Form The height occupied by item is incorrect
Data warehouse interview question preparation
![[FAQ] summary of common causes and solutions of Huawei account service error 907135701](/img/43/1a9786c89a5ab21d1fb8903cb7b77e.png)
[FAQ] summary of common causes and solutions of Huawei account service error 907135701
Use of tiledlayout function in MATLAB
Oppo find N2 product form first exposure: supplement all short boards
Product identification of intelligent retail cabinet based on paddlex
CVPR 2022 | greatly reduce the manual annotation required for zero sample learning, and propose category semantic embedding rich in visual information (source code download)

sql优化之查询优化器

Innovation and development of independent industrial software

Understand chisel language thoroughly 05. Chisel Foundation (II) -- combinational circuits and operators
随机推荐
QT how to detect whether the mouse is on a control
R language uses the mutation function of dplyr package to standardize the specified data column (using mean function and SD function), and calculates the grouping mean of the standardized target varia
RK1126平台OSD的实现支持颜色半透明度多通道支持中文
The game goes to sea and operates globally
基于51单片机的超声波测距仪
Leetcode T48:旋转图像
【云原生】我怎么会和这个数据库杠上了?
Error in find command: paths must precede expression (turn)
实时数据仓库
ML之shap:基于boston波士顿房价回归预测数据集利用shap值对XGBoost模型实现可解释性案例
[matlab] summary of conv, filter, conv2, Filter2 and imfilter convolution functions
Golang uses JSON unmarshal number to interface{} number to become float64 type (turn)
【算法leetcode】面试题 04.03. 特定深度节点链表(多语言实现)
Rich text editing: wangeditor tutorial
golang fmt. Printf() (turn)
ML之shap:基于boston波士顿房价回归预测数据集利用Shap值对LiR线性回归模型实现可解释性案例
海外游戏代投需要注意的
Map of mL: Based on Boston house price regression prediction data set, an interpretable case of xgboost model using map value
LiveData
AI and Life Sciences