当前位置:网站首页>MATLAB综合练习:信号与系统中的应用
MATLAB综合练习:信号与系统中的应用
2022-07-06 09:25:00 【Bitter tea seeds】
MATLAB 2018b
前言
“老爸,你昨天给我发的时域信号的频谱分析作业老师超级满意,她又留新的作业了,你帮找你那个员工在帮我做一下吧,我都不咋会。”
苦茶子老板,没好气的哼了一声:“你就不能自己学一点吗?你以后出来能干什么?就天天指着我给你每个月50万的零花钱,你这样以后怎么活下去啊!”
“别唠叨了,臭老头,拜拜,老子耍去了!”
“哎!“苦茶子老板叹了口气,接着让女秘书把小刘叫到办公室来。
”小刘啊!昨天你做的作业,我呢,真的是非常的满意,为了继续锻炼你的能力,这里还有几道题,你也做了吧!啊,不咋多。“苦茶子老板板着脸说着。
小刘想着拒绝,当看见老板板着生气的脸,也不敢张开那个嘴了,只是糯糯的说了声:”好的,老板。“
”文档发你了,赶紧写了去吧!“老板把小刘赶出了办公室。
小刘回到了办公桌前,看着那么多的题,默默的打开了CSDN搜索到:”如何和老板提涨工资啊?“
一、产生数值信号
利用MATLAB产生信号 x(t)=cos(10Πt),y(t)=sin(10Πt2)
,分别画出信号的波形,并画在一张图上比较这两个信号的波形。
代码如下,所示:
>> t=linspace(0,8*pi,100);%创建0到4Π的线性分隔数值向量t,元素为100个
>> x=cos(10*pi*t);%x(t)的波形;
>> plot(t,x,'r'),title('x(t)波形曲线'),xlabel('t数值向量')
>> y=sin(10*pi*t.^2);%y(t)的波形;
>> plot(t,y,'c'),title('y(t)波形曲线'),xlabel('t数值向量')
>> plot(t,x,'r',t,y,'c')
>> title('x(t)和y(t)进行比较')
>> xlabel('t数值向量')
1.单独x的波形图: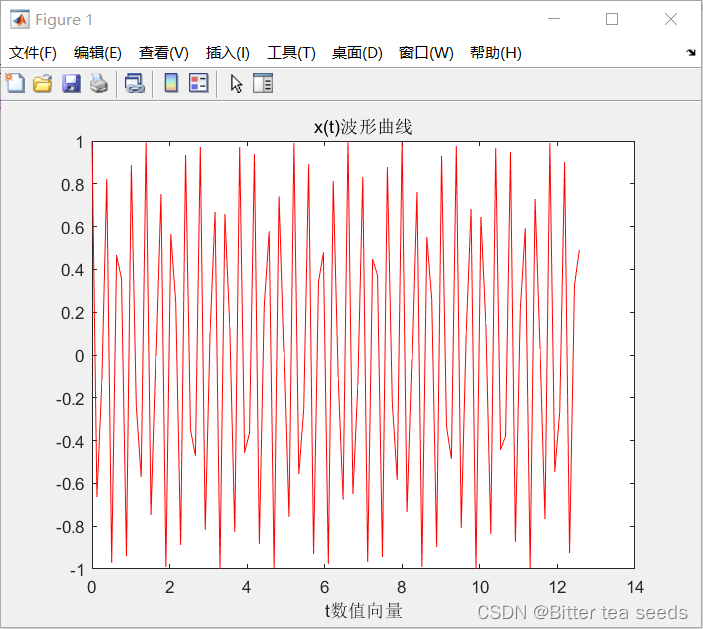
2.单独y的波形图: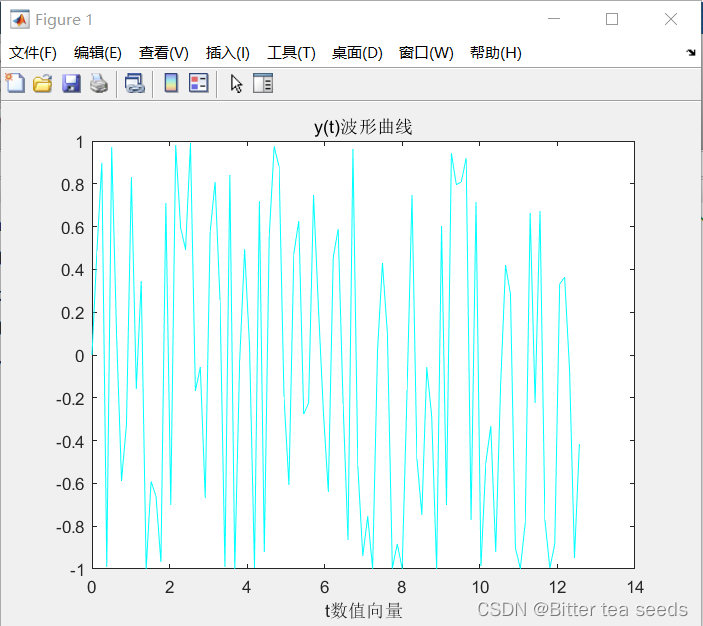
3.x(t)信号波形和y(t)信号波形进行比较: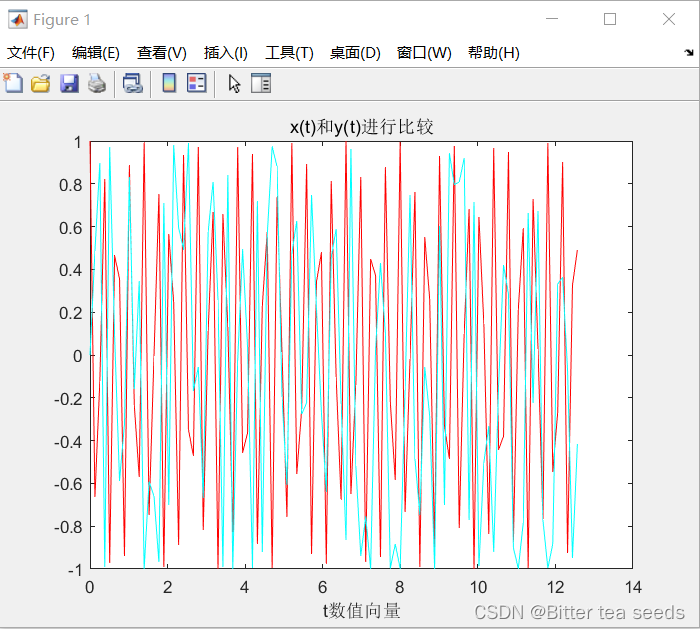
二、信号的基本运算
利用MATLAB实现信号f1 (t)=sin(πt),f2(t)=sin(10πt)的相加和相乘,试分别绘制这两个信号及它们的和信号和积信号的波形。
代码如下,所示:
>> t=linspace(0,8*pi,100);%创建0到4Π的线性分隔数值向量t,元素为100个
>> f1=sin(pi*t);%f1信号函数表达式
>> f2=sin(10*pi*t);%f2信号函数表达式
>> subplot(1,2,1),plot(t,f1,'m'),title('x(t)的波形曲线')
>> subplot(1,2,2),plot(t,f2,'w'),title('y(t)的波形曲线')
>> f3=f1+f2;
>> format short,f3;
>> plot(t,f3),title('f3为信号和波形曲线')
>> f4=f1.*f2;
>> plot(t,f4,'m'),title('f4为信号乘积波形曲线')
1.f1、f2的波形曲线: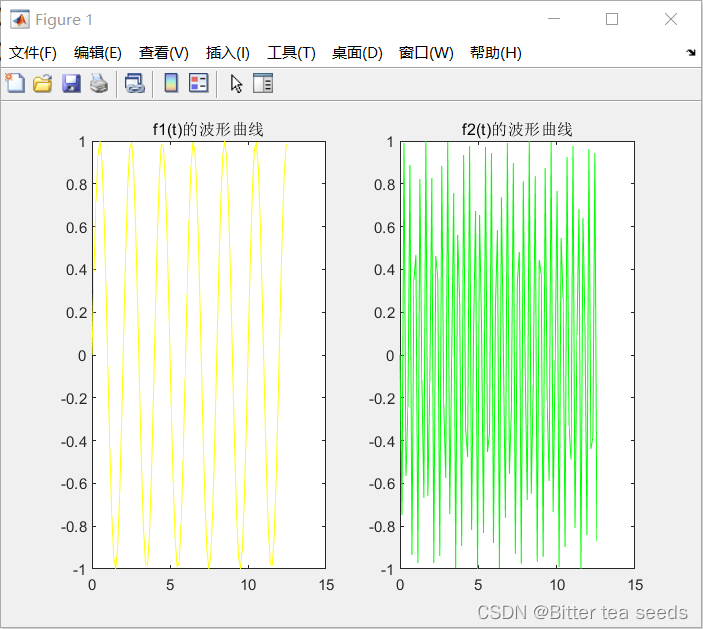
2.f3俩信号乘积和的波形曲线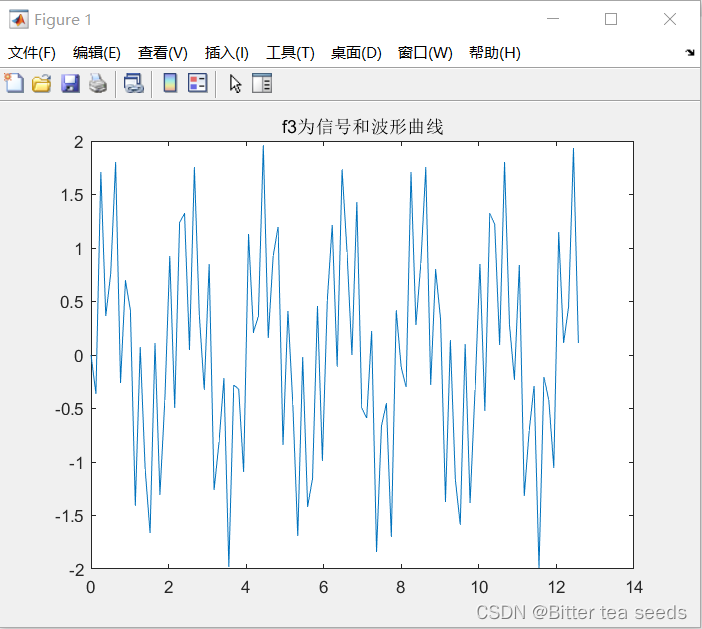
3.f4俩信号乘积的波形曲线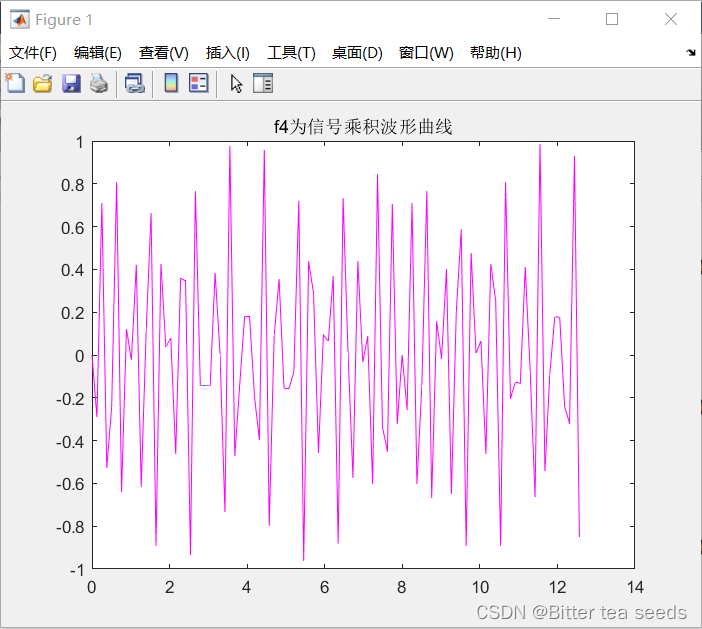
三、卷积的运算
用MATLAB画出门函数3[u(t+1)-u(t-2)]与指数函数2e^(-2t)卷积图形。
代码如下,所示:
>> dt=0.01; t=0:dt:5;
>> f1=3*(u.*(t+1)-u.*(t-2)); subplot(1,3,1), plot(t,f1,'g') ,title('门函数波形曲线')
>> f2=2*exp(-2.*t); subplot(1,3,2), plot(t,f2,'r'),title('指数函数波形曲线')
>> y =conv(f1,f2)*dt;%调用卷积conv()函数
>> subplot(1,3,3), plot(dt*([1:length(y)]-1),y,'m'), title('卷积曲线'),grid  % 不知t的长度,绘图时t数组设定方法
门函数,指数函数、还有俩信号的卷积波形如下: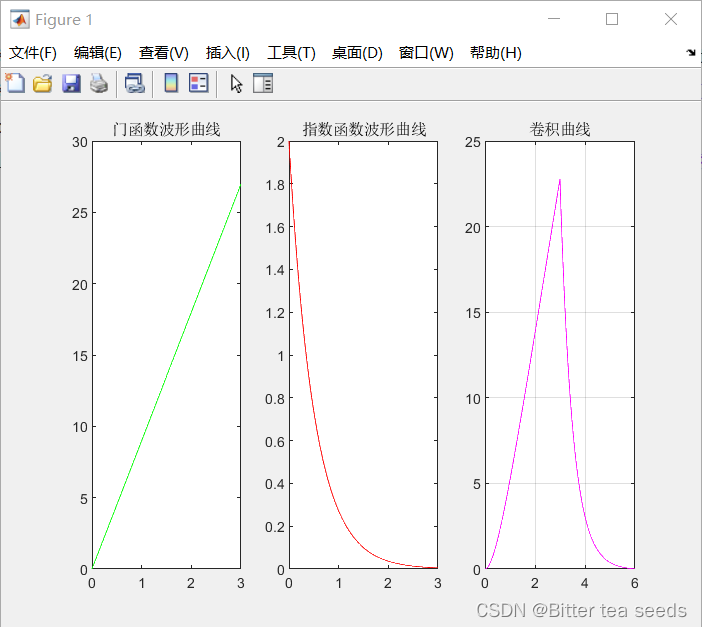
四、傅里叶级数展开
利用MATLAB将基频为50Hz的方波展开为傅里叶级数。
代码如下,所示:
>> N = 500; %取项,并且项数越高,波形越不失真。
>> T = 0.02;%方波周期为0.02;
>> fs = 1/T;%方波基频为50Hz;
>> N_point = 150; %设置每个周期的采样点个数
>> dt = T/N_point;%步长
>> t=1:dt:100*T-dt;%取值范围,”不宜过大“
>> ft = zeros(1,length(t));
>> %ft为全0矩阵
>> for n=1:N
an = (2*sin(pi*n) - sin(2*pi*n))/(pi*n);
bn = (1-2*cos(n*pi)+cos(2*pi*n))/(pi*n);
ft = ft + an*cos(n*2*pi*fs*t)+bn*(sin(n*2*pi*fs*t));%傅里叶展开级数
end
>> plot(t,ft,'m')
>> title('基频为50Hz的方波展开为傅里叶级数')
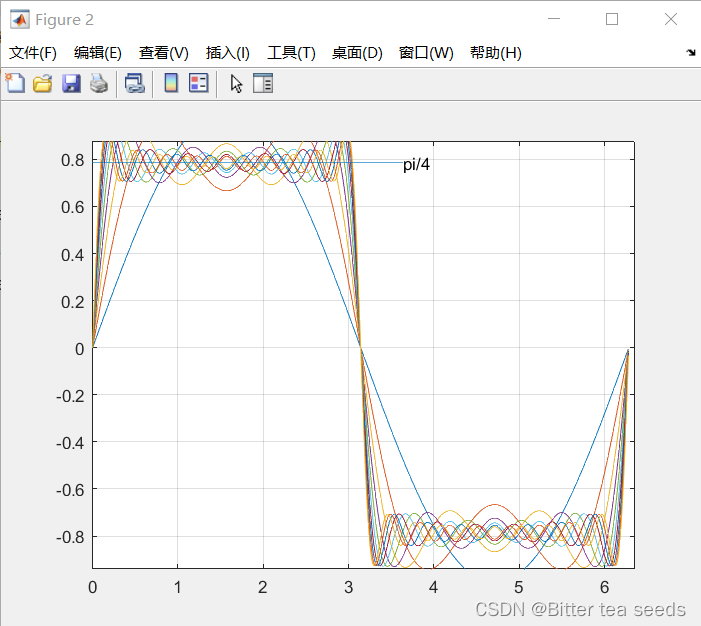
基频为50Hz的方波: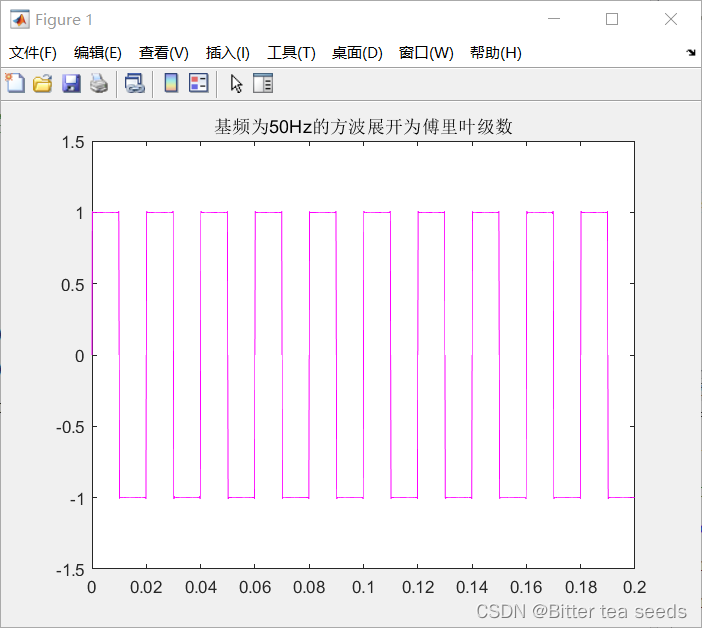
各次谐波合成方波的情况: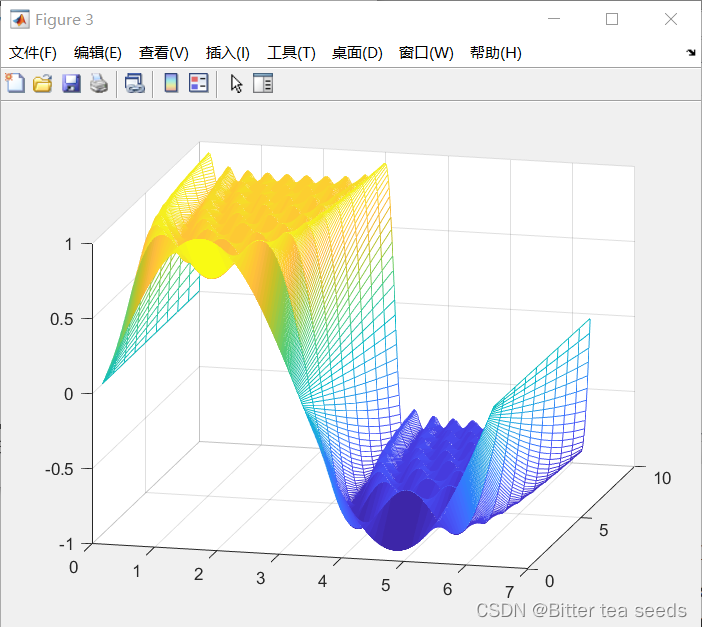
五、频谱分析
用MATLAB画出H(s)=s2/((s+1)2+1)的零、极点分布图,并画出该系统的冲激响应h(n)的波形和频率响应H(jω)的曲线,判断系统是低通、高通、带通、带阻中哪一种?
代码如下,所示:
>> a = [1 2 2];% 分母向量
>> b = [1]; % 分子向量
>> zs=roots(b) %求系统的零点
zs =
空的 0×1 double 列向量
>> ps=roots(a) %求系统的极点
ps =
-1.0000 + 1.0000i
-1.0000 - 1.0000i
>> plot(real(zs), imag(zs), 'go', real(ps), imag(ps), 'mx', 'markersize', 12);
>> grid; legend('零点','极点');
>>figure(1); pzmap(sys); % 画出零点极点图
>> figure(2);freqs(b, a, w);% 画出幅频特性曲线和相频特性曲线
>> dn=0.1; n=0:dn:6;%n取值范围
>> [r,p,k]=residue( b, a);%用极点留数法求冲击函数
>> H=zeros(1,length(n));
>> for i=1:length(a)-1
H=H+r(i)*exp(p(i)*n);% 冲击函数h(n)的通用式
end
>> plot(n,H); grid; title('冲激响应H(t)')
>> freqs(b,a,w) %滤波器的频率响应
1.零、极点图: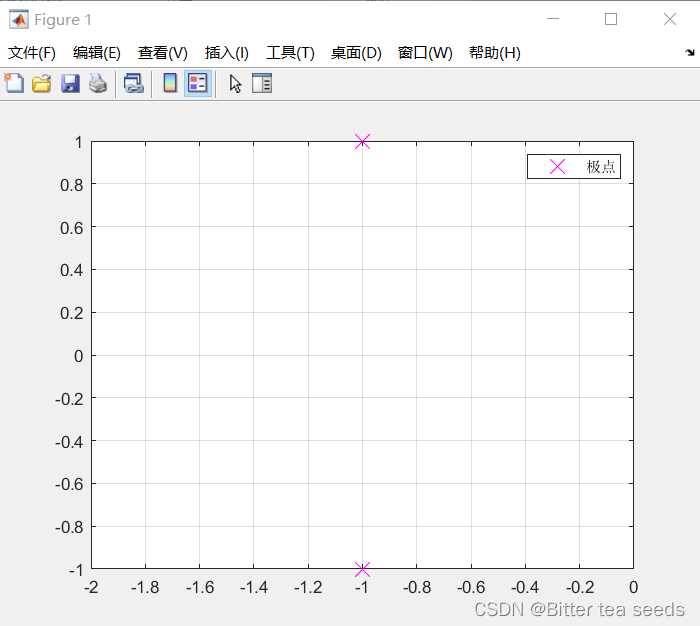
2.幅频特性曲线和相频特性曲线: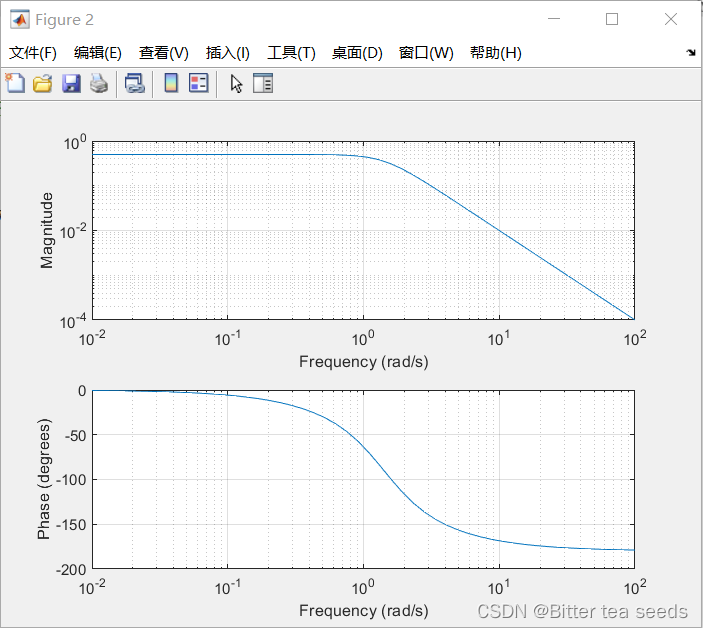
3.冲激函数H(t):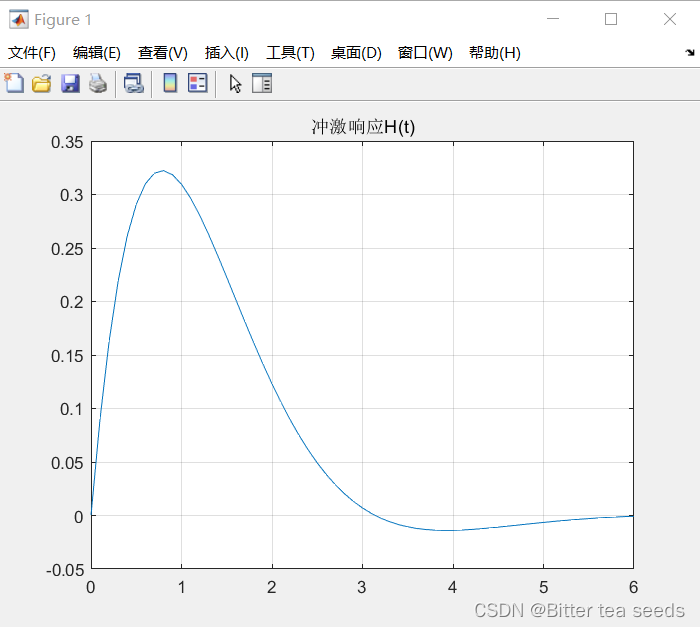
4.频率响应H(jω)的曲线:
总结
小刘终于将这些题给做完了,他伸了伸懒腰,看了看时间,已经晚上21:35了,看了看老板办公室已经熄灯了,估计老板已经回家睡觉了,明天再发给他吧。再看了看周围没走几个人的办公室,摇了摇头,给自己冲了杯咖啡,继续看着今天下午的提问:”如何让老板给自己加薪呢?“
边栏推荐
- FSM和i2c实验报告
- MySQL数据库(三)高级数据查询语句
- ucorelab3
- 12306: mom, don't worry about me getting the ticket any more (1)
- Brief introduction to libevent
- Portapack application development tutorial (XVII) nRF24L01 launch B
- FSM and I2C experiment report
- STM32学习记录:玩转按键控制蜂鸣器和LED
- JS --- JS function and scope (II)
- ucore Lab 1 系统软件启动过程
猜你喜欢
MySQL数据库(一)
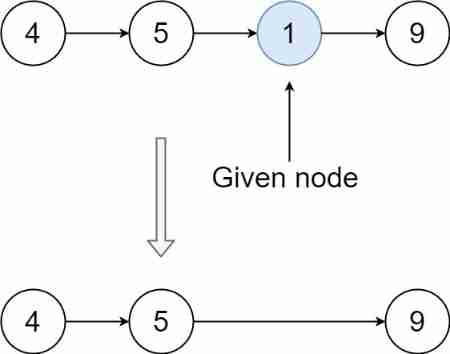
LeetCode#237. Delete nodes in the linked list
![Unpleasant error typeerror: cannot perform 'ROR_‘ with a dtyped [float64] array and scalar of type [bool]](/img/dc/834463f460c085207dc9d531805e90.jpg)
Unpleasant error typeerror: cannot perform 'ROR_‘ with a dtyped [float64] array and scalar of type [bool]
Brief introduction to libevent
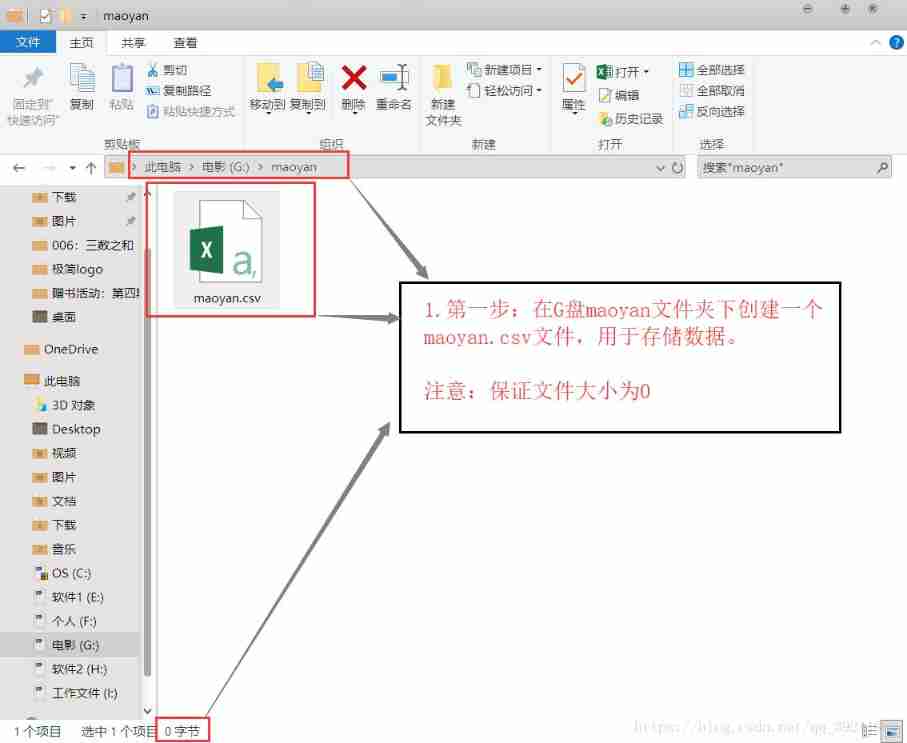
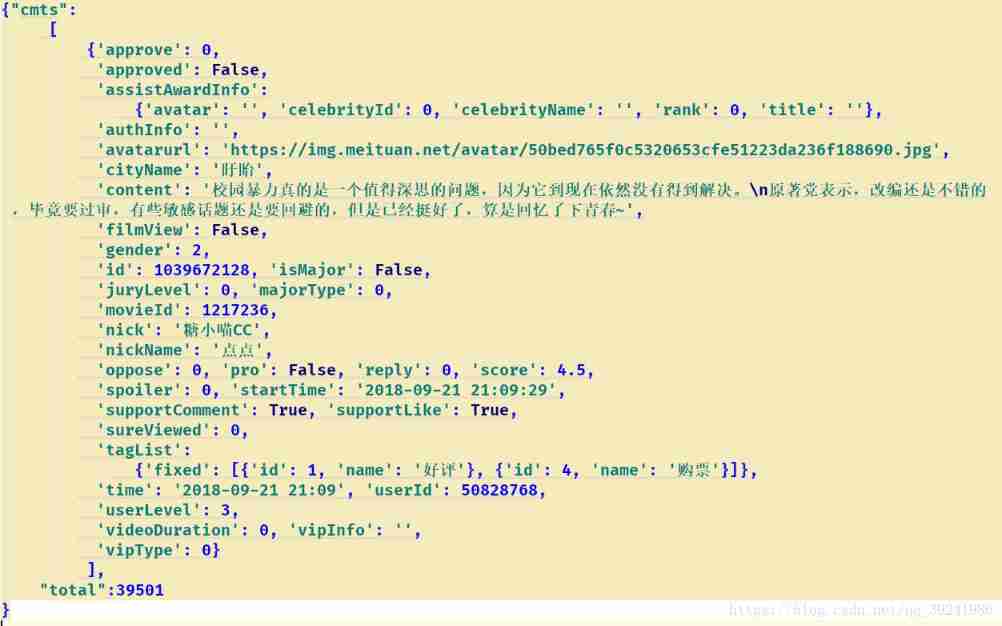
Crawling cat's eye movie review, data visualization analysis source code operation instructions
Visual analysis of data related to crawling cat's eye essays "sadness flows upstream into a river" | the most moving film of Guo Jingming's five years
Servlet
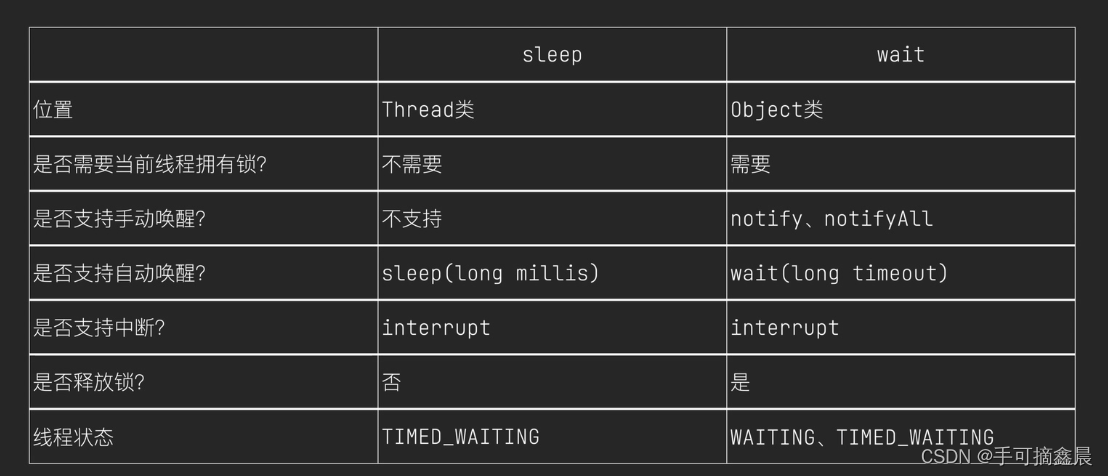
Threads and thread pools
Interview answering skills for software testing
In Oracle, start with connect by prior recursive query is used to query multi-level subordinate employees.

随机推荐
LeetCode#237. Delete nodes in the linked list
Mysql database (I)
Pedestrian re identification (Reid) - Overview
MySQL数据库(二)DML数据操作语句和基本的DQL语句
STM32学习记录:输入捕获应用
Your wechat nickname may be betraying you
Research Report on medical anesthesia machine industry - market status analysis and development prospect prediction
UCORE Lab 1 system software startup process
Learning record: Tim - capacitive key detection
How to rename multiple folders and add unified new content to folder names
安全测试入门介绍
Mysql database (V) views, stored procedures and triggers
Should wildcard import be avoided- Should wildcard import be avoided?
The most detailed postman interface test tutorial in the whole network. An article meets your needs
Crawler series (9): item+pipeline data storage
[pytorch] simple use of interpolate
LeetCode#198. raid homes and plunder houses
ucorelab3
JS --- detailed explanation of JS DOM (IV)
Crawling cat's eye movie review, data visualization analysis source code operation instructions