当前位置:网站首页>Spinningup drawing curve
Spinningup drawing curve
2022-07-05 06:47:00 【hanjialeOK】
Address https://spinningup.openai.com/en/latest/user/plotting.html
download spinningup
git clone https://github.com/openai/spinningup.git
In fact, all you need to draw a curve is spiningup/spinup/utils/plot.py This file . Best in make_plots Add a sentence at the end of the function to save pdf
def make_plots(all_logdirs, legend=None, xaxis=None, values=None, count=False,
               font_scale=1.5, smooth=1, select=None, exclude=None, estimator='mean'):
    data = get_all_datasets(all_logdirs, legend, select, exclude)
    values = values if isinstance(values, list) else [values]
    condition = 'Condition2' if count else 'Condition1'
    estimator = getattr(np, estimator)      # choose what to show on main curve: mean? max? min?
    for value in values:
        plt.figure()
        plot_data(data, xaxis=xaxis, value=value, condition=condition, smooth=smooth, estimator=estimator)
    plt.show()
    plt.savefig('fig.pdf')
Data file storage form .
data/
    bench_ours/
        bench_ours-seed0/
        bench_ours-seed1/
        bench_ours-seed2/
        bench_ours-seed3/
        bench_ours-seed4/
    bench_others/
        bench_others-seed0/
        bench_others-seed1/
        bench_others-seed2/
        bench_others-seed3/
        bench_others-seed4/
Every bench_ours-seed*/ There are two files under the folder
bench_ours-seed0/
	progress.txt
	config.json
among ,config.json The name of the experiment should be included
{
    "exp_name": "ours"}
progress.txt The first line is the data name , The second line is followed by data . Each column of data is represented by \t Separate
Updates	eplenmean	AverageEpRet	number of episodes	send data fps	send data interval	steps	total steps
0	17.94	-0.1197456899999999	113	414.0	4.946493625640869	2048	999424
1	16.93	-0.68175405	232	524.0	3.901179075241089	4096	999424
2	17.78	0.42339543	346	527.0	3.8832526206970215	6144	999424
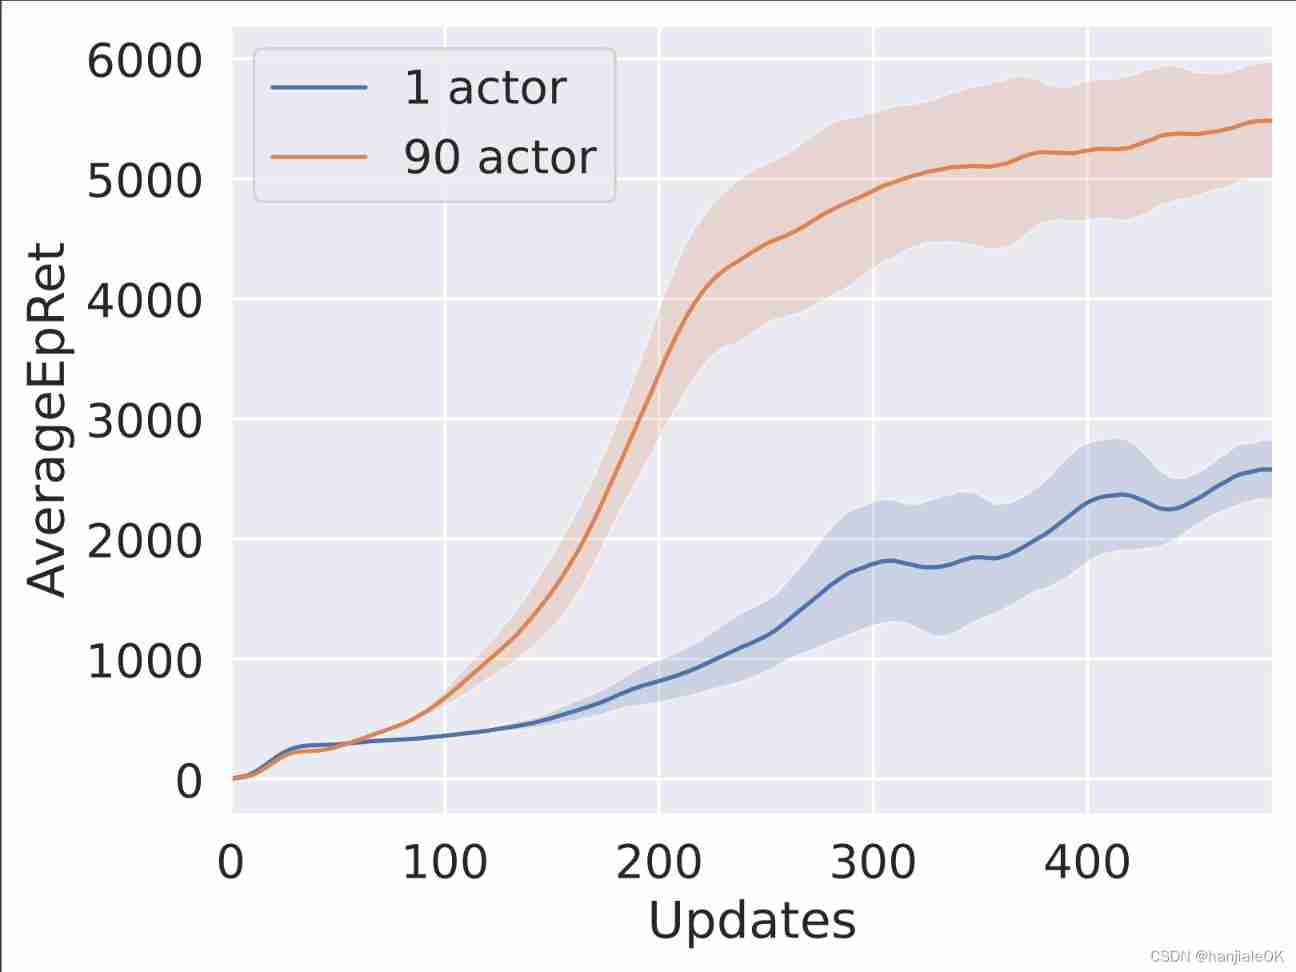
After all the above preparations have been made , You can draw pictures
pip install seaborn==0.8.1
python spinningup/spinup/utils/plot.py data/bench --xaxis 'Updates' --value 'AverageEpRet' --smooth=8
边栏推荐
- Get class files and attributes by reflection
- Chinese remainder theorem acwing 204 Strange way of expressing integers
- Find the combination number acwing 887 Find combination number III
- 2048 project realization
- Configuration method and configuration file of SolidWorks GB profile library
- 代码中的英语全部
- Use the Paping tool to detect TCP port connectivity
- Page type
- Instruction execution time
- The differences and connections among cookies, sessions, JWT, and tokens
猜你喜欢

Utf8 encoding

Find the combination number acwing 888 Find the combination number IV

Rehabilitation type force deduction brush question notes D1
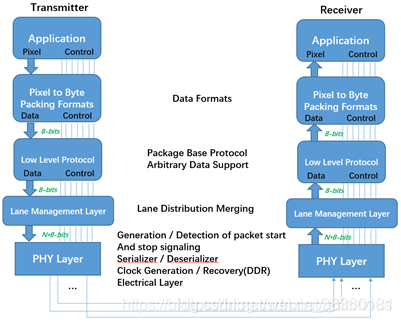
摄像头的MIPI接口、DVP接口和CSI接口
Page type
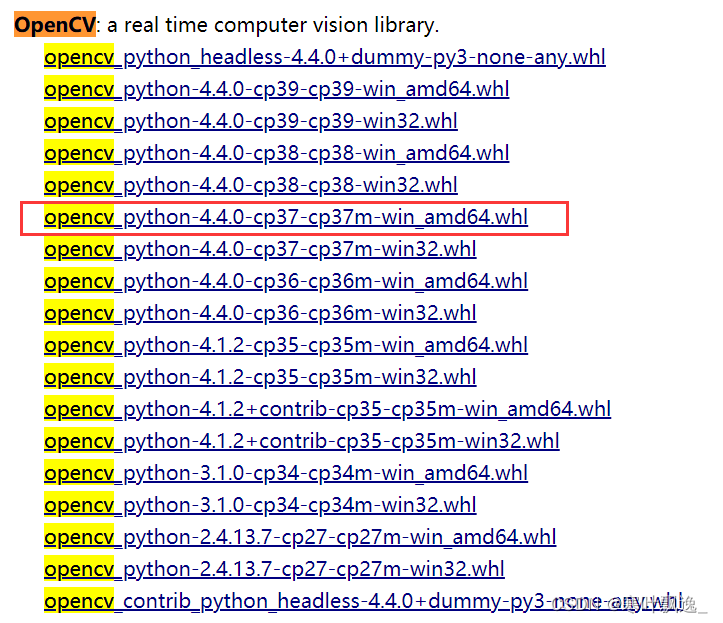
Install opencv -- CONDA to establish a virtual environment and add the kernel of this environment in jupyter
Client use of Argo CD installation

Marvell 88E1515 PHY loopback模式测试
Record of problems in ollvm compilation

Volcano 资源预留特性
随机推荐
GDB code debugging
Vant weapp swippecell set multiple buttons
3.Oracle-控制文件的管理
Record of problems in ollvm compilation
Utf8 encoding
inux摄像头(mipi接口)简要说明
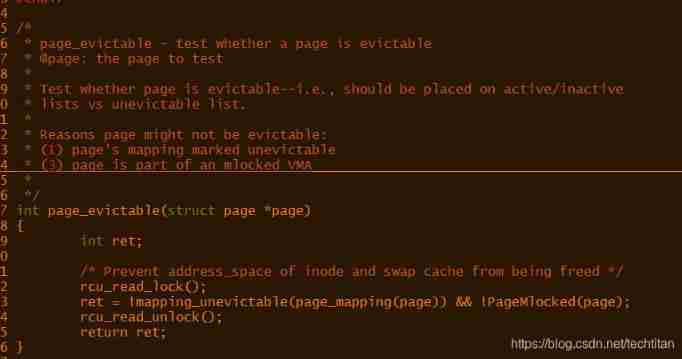
cgroup_ memcg
Redis-02.Redis命令
Redis-02. Redis command
2022/6/29-日报
how to understand the “model independent.“
.net core踩坑实践
MySQL (UDF authorization)
Ffmpeg build download (including old version)
Architecture
将webApp或者H5页面打包成App
Adg5412fbruz-rl7 applies dual power analog switch and multiplexer IC
Vscode configures the typera editor for MD
SRE核心体系了解
. Net core stepping on the pit practice