当前位置:网站首页>Data analysis course notes (III) array shape and calculation, numpy storage / reading data, indexing, slicing and splicing
Data analysis course notes (III) array shape and calculation, numpy storage / reading data, indexing, slicing and splicing
2022-07-07 00:21:00 【M Walker x】
Data analysis course notes
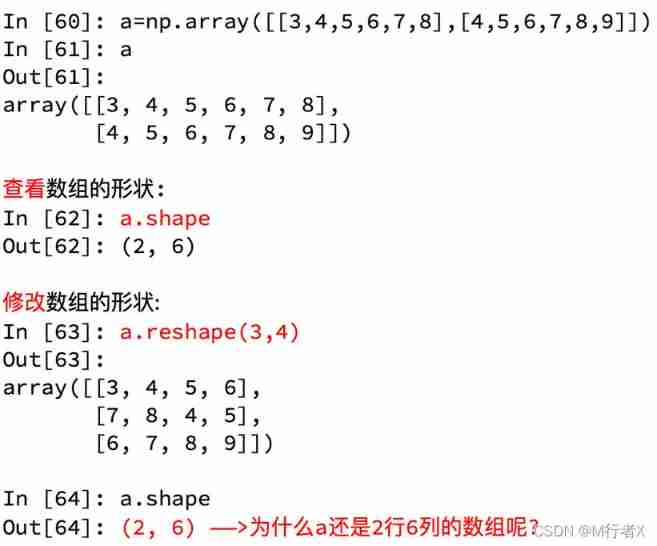
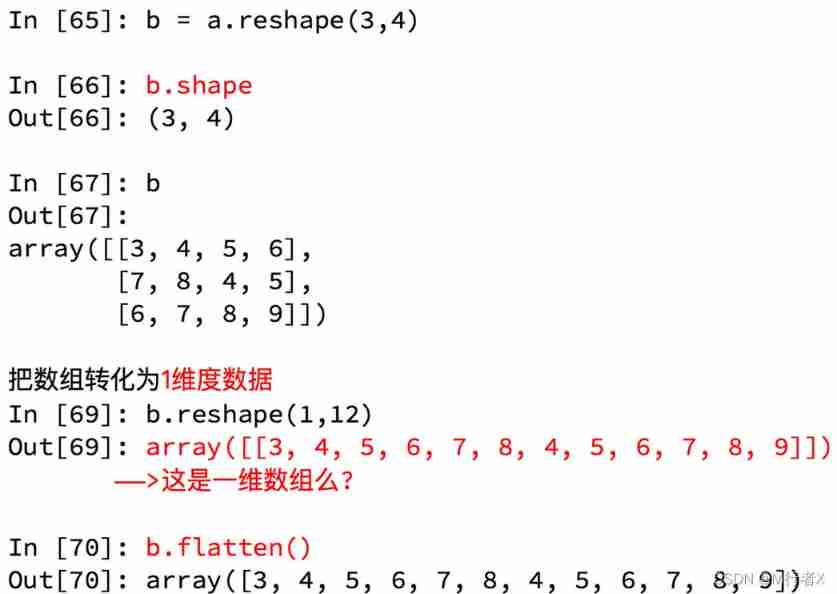
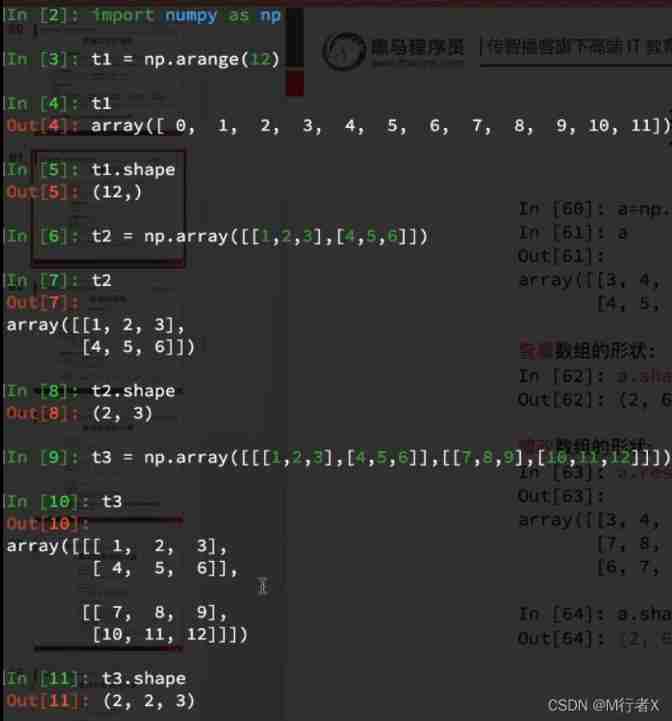
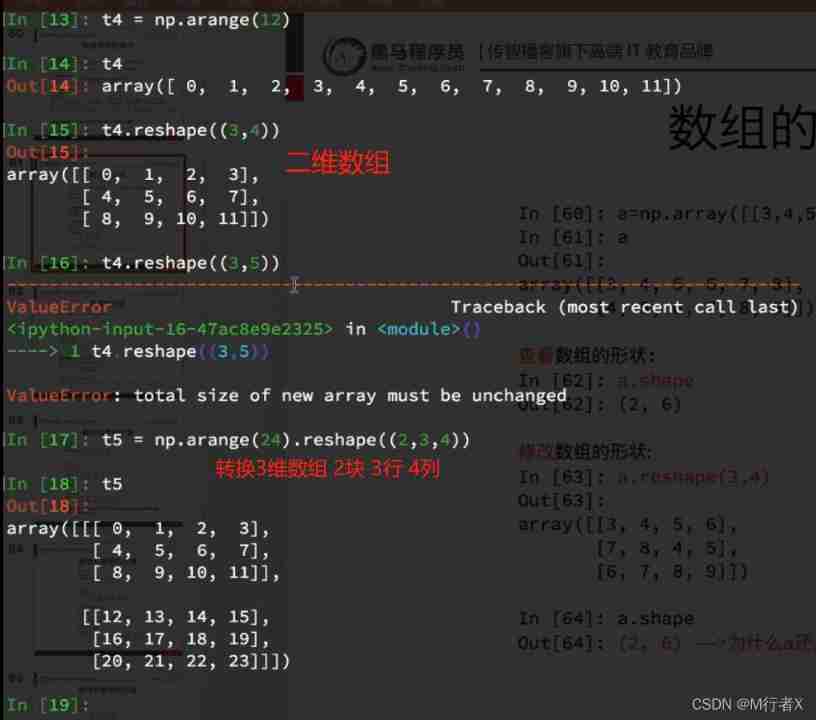
The shape of the array
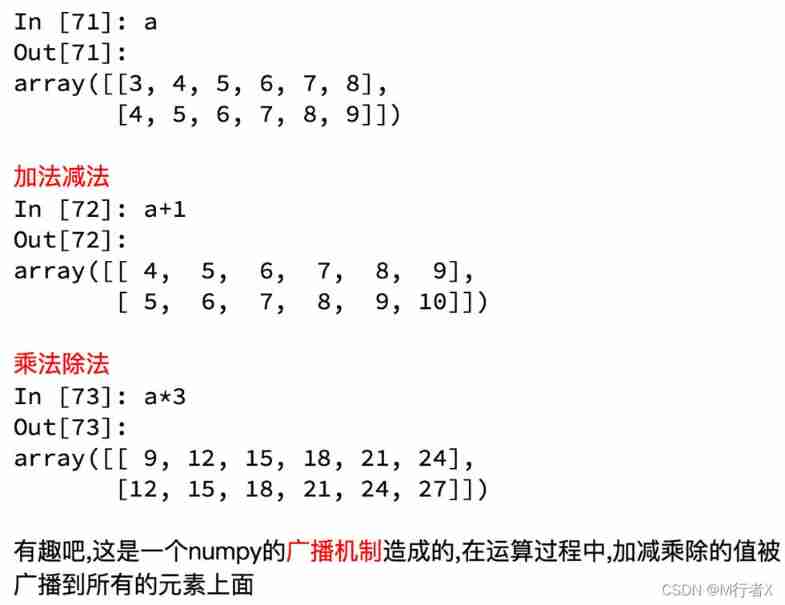
The calculation of array
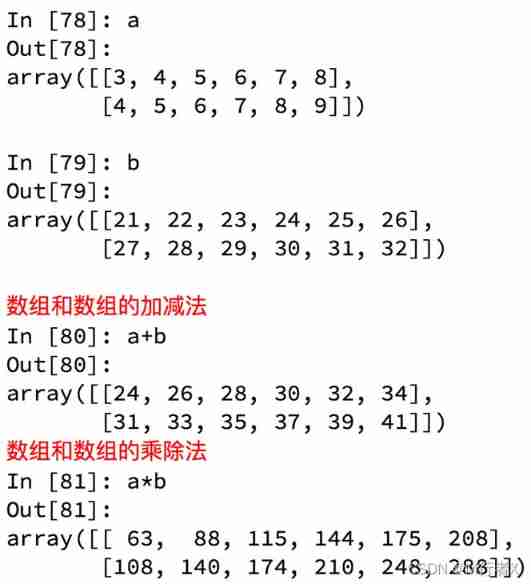
Calculate in different dimensions
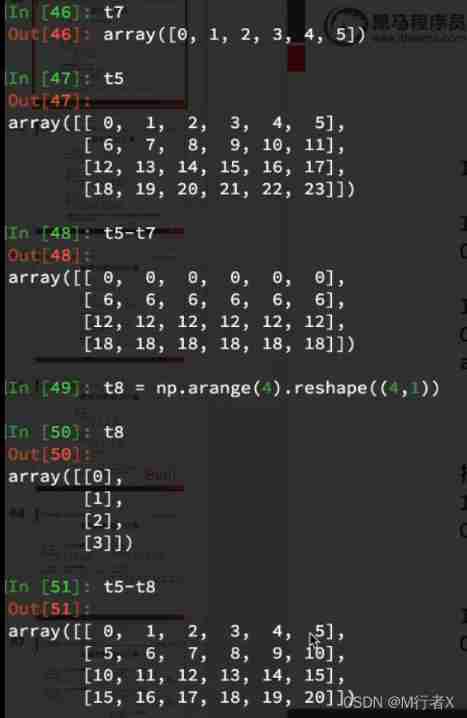
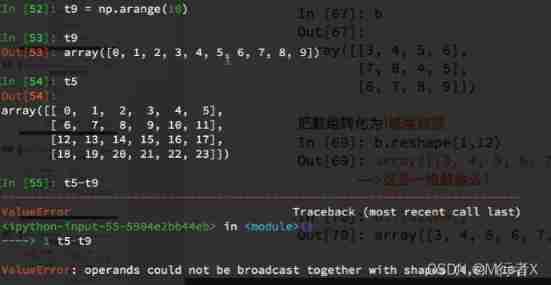
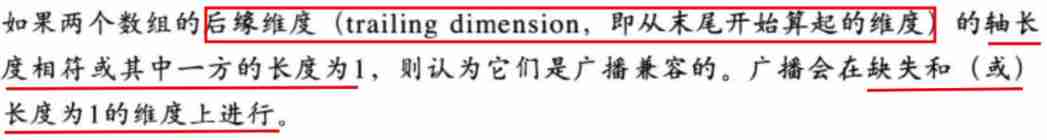
Broadcasting principles

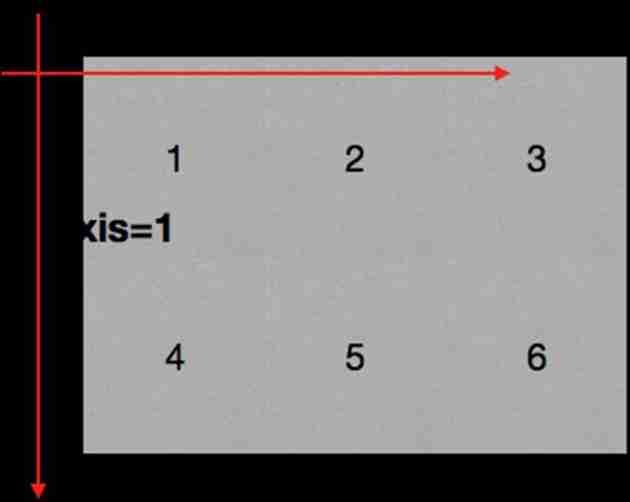
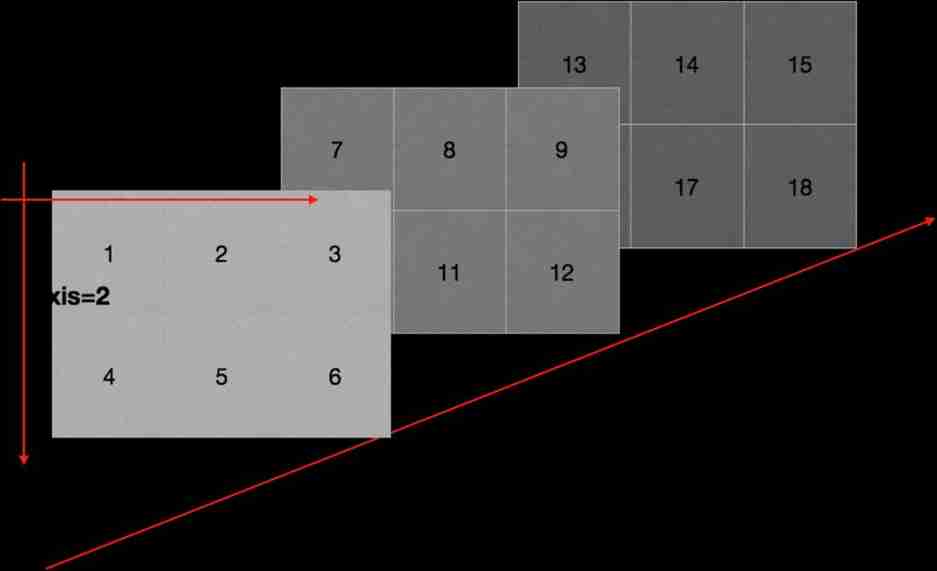
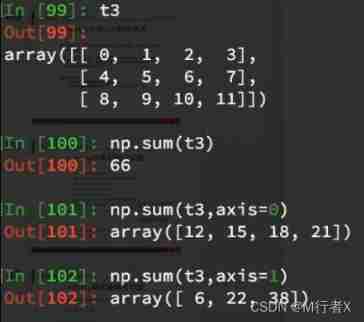
Axis (axis)

numpy Reading data

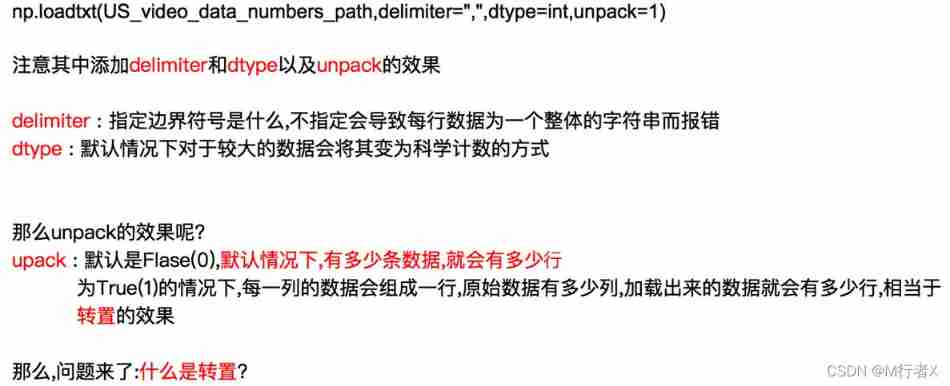
np.loadtxt(fname,dtype=np.float,delimiter=None,skiprows=0,usecols=None,unpack=False)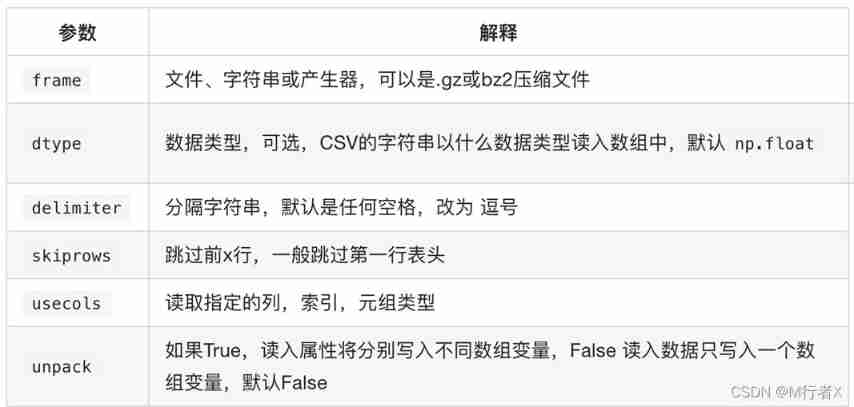

Data sources : https://www.kaggle.com/datasnaek/youtube/data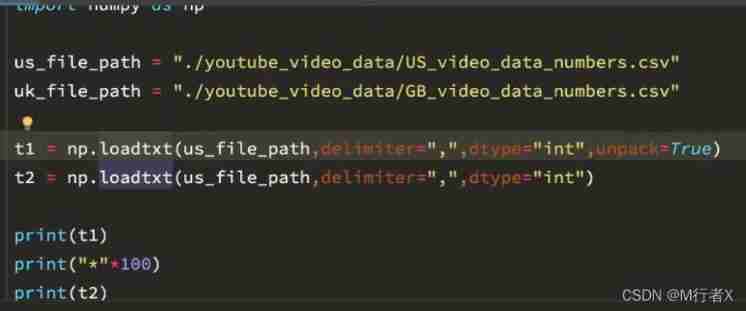

# coding=utf-8
import numpy as np

us_file_path = "./youtube_video_data/US_video_data_numbers.csv"
uk_file_path = "./youtube_video_data/GB_video_data_numbers.csv"

# t1 = np.loadtxt(us_file_path,delimiter=",",dtype="int",unpack=True)
t2 = np.loadtxt(us_file_path,delimiter=",",dtype="int")

# print(t1)
print(t2)

print("*"*100)

# Take row
# print(t2[2])

# Take consecutive multiple lines
# print(t2[2:])

# Take discontinuous multiple lines
# print(t2[[2,8,10]])

# print(t2[1,:])
# print(t2[2:,:])
# print(t2[[2,10,3],:])

# Fetch
# print(t2[:,0])

# Take consecutive Columns
# print(t2[:,2:])

# Take discontinuous multiple columns
# print(t2[:,[0,2]])

# Go to rows and columns , Take the first place 3 That's ok , The value of the fourth column
# a = t2[2,3]
# print(a)
# print(type(a))

# Fetching multiple rows and columns , Take the first place 3 Line to line five , The first 2 Column to the first 4 The results of the column
# Go to the intersection of rows and columns
b = t2[2:5,1:4]
# print(b)

# Take multiple non adjacent points
# The result is (0,0) (2,1) (2,3)
c = t2[[0,2,2],[0,1,3]]
print(c)
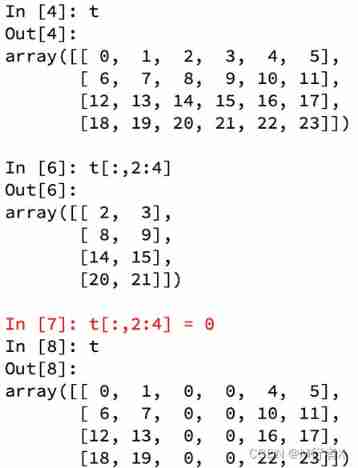
numpy Index and slice

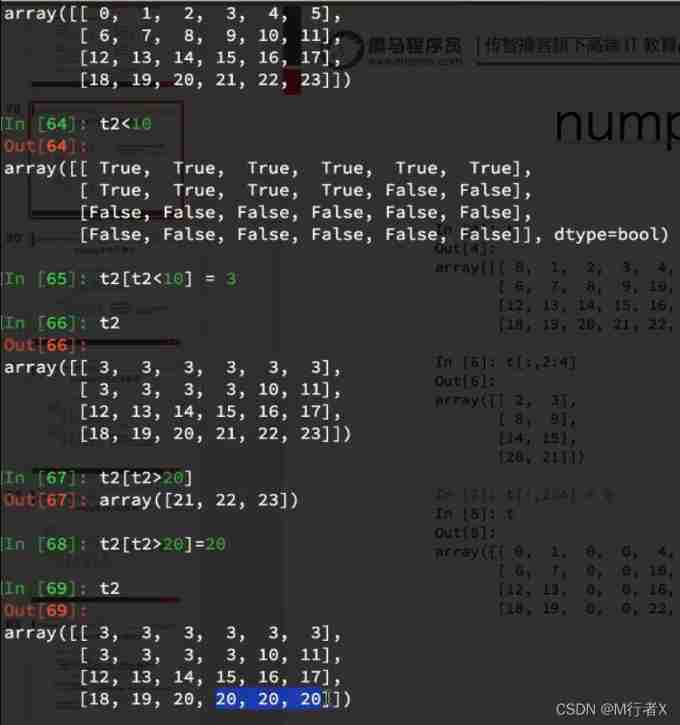
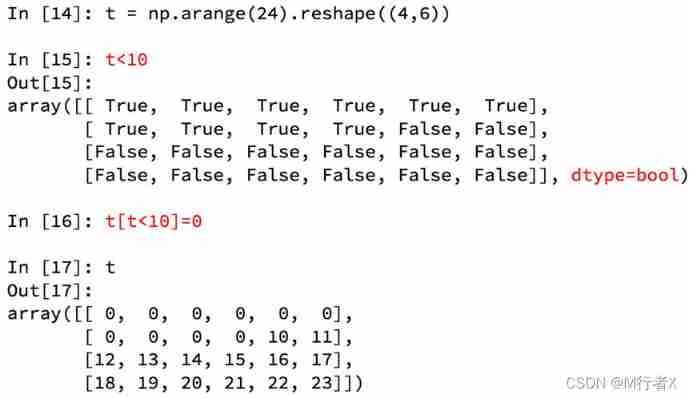
numpy Boolean index in

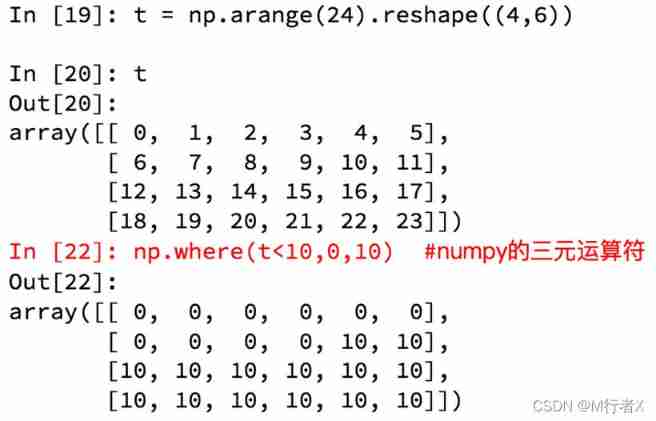
numpy Ternary operator in

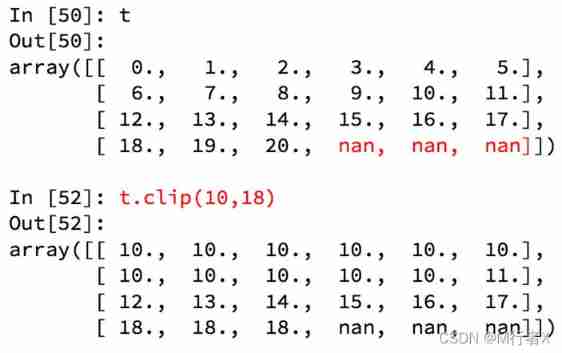
numpy Medium clip( tailoring )

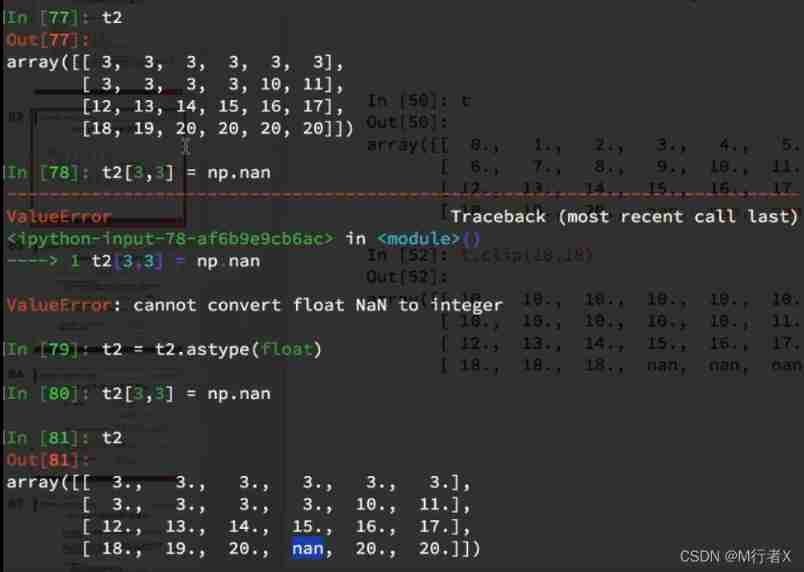
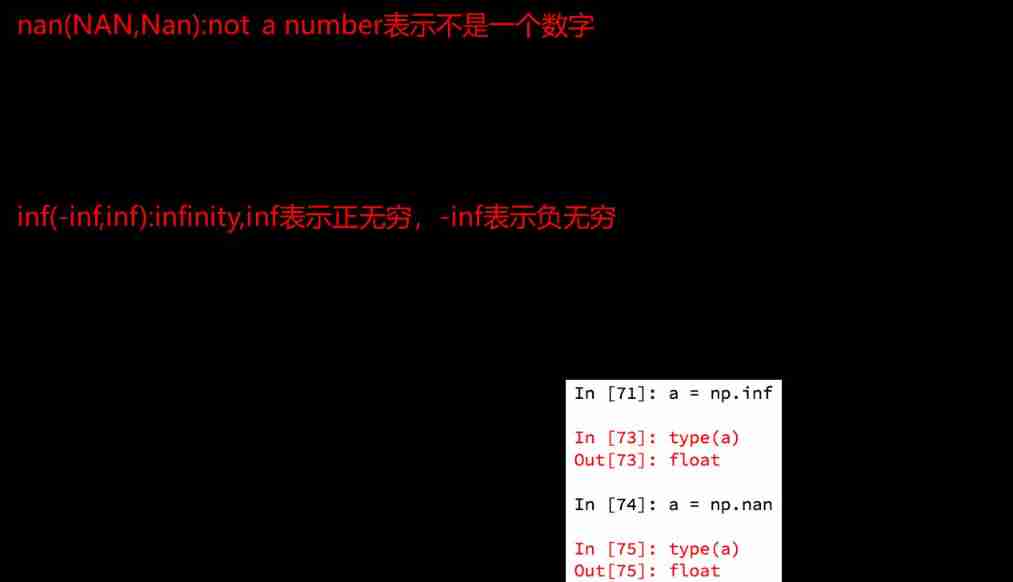
numpy Medium nan and inf
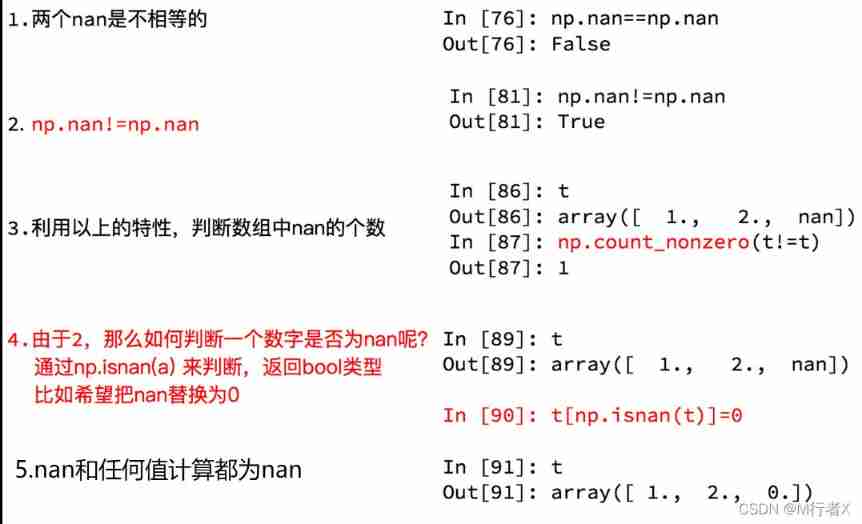
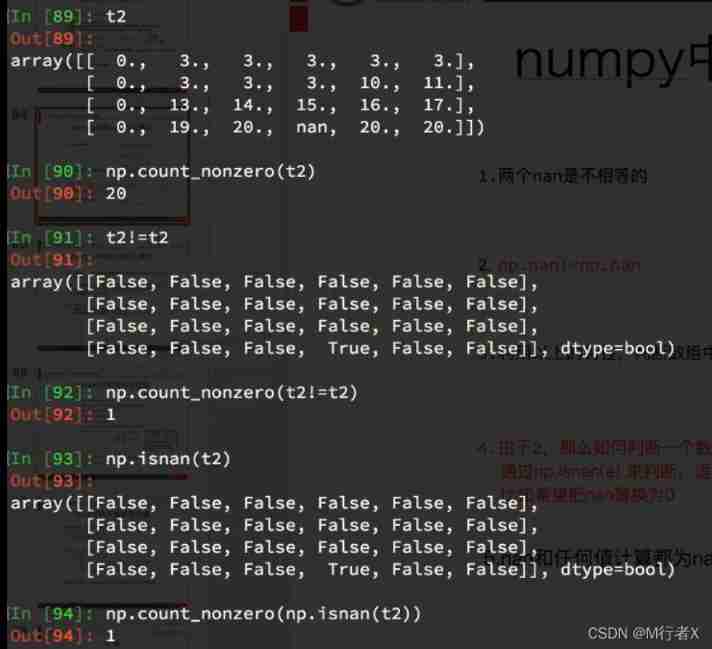
numpy Medium nan Points for attention

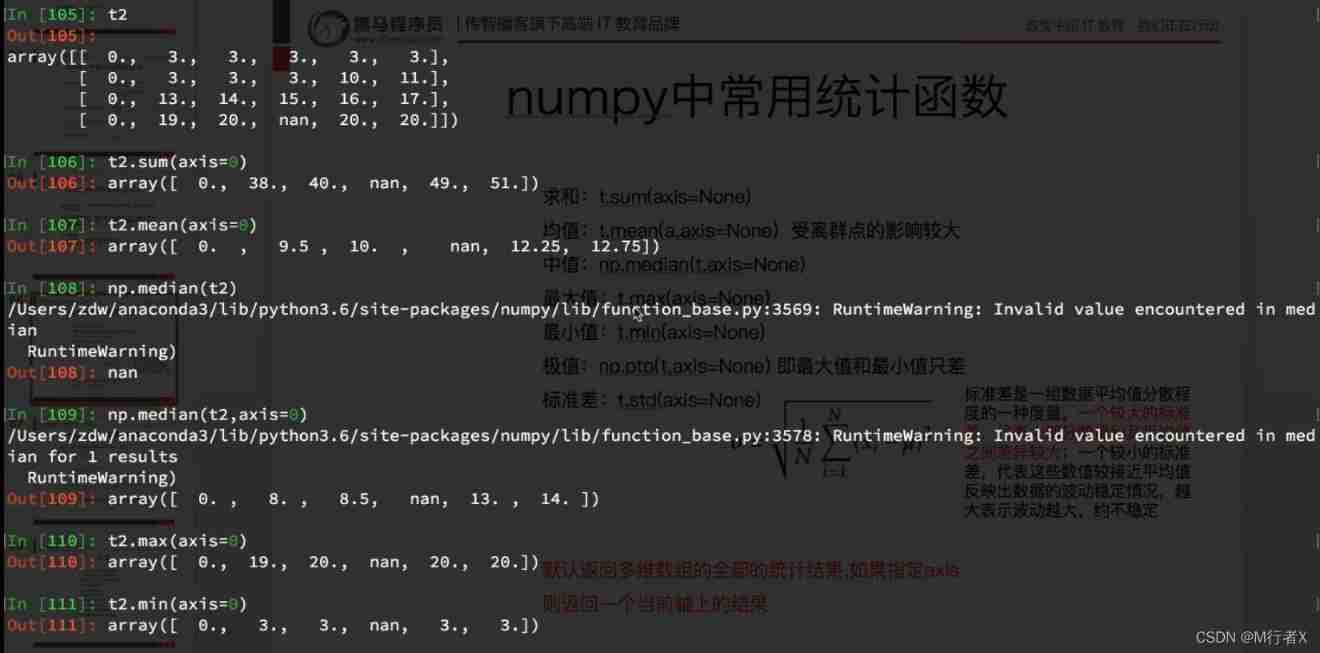
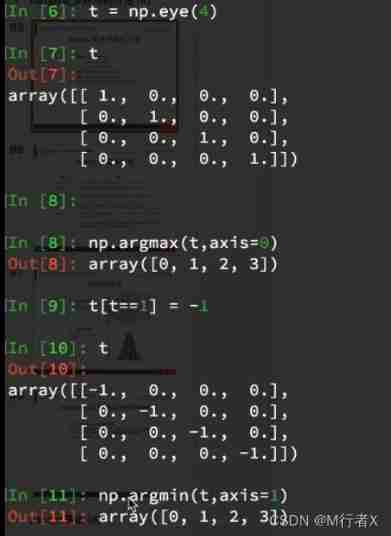
numpy Statistical functions commonly used in

All statistical results of multidimensional array are returned by default , If specified axis Returns a result on the current axis 
Missing value processing
# coding=utf-8
import numpy as np


# print(t1)
def fill_ndarray(t1):
    for i in range(t1.shape[1]):  # Traverse each column
        temp_col = t1[:,i]  # The current column
        nan_num = np.count_nonzero(temp_col!=temp_col)
        if nan_num !=0: # Not for 0, Indicates that there are... In the current column nan
            temp_not_nan_col = temp_col[temp_col==temp_col] # The current column is not nan Of array

            #  Check that the current is nan The location of , Assign a value that is not nan The average of
            temp_col[np.isnan(temp_col)] = temp_not_nan_col.mean()
    return t1

if __name__ == '__main__':
    t1 = np.arange(24).reshape((4, 6)).astype("float")
    t1[1, 2:] = np.nan
    print(t1)
    t1 = fill_ndarray(t1)
    print(t1)
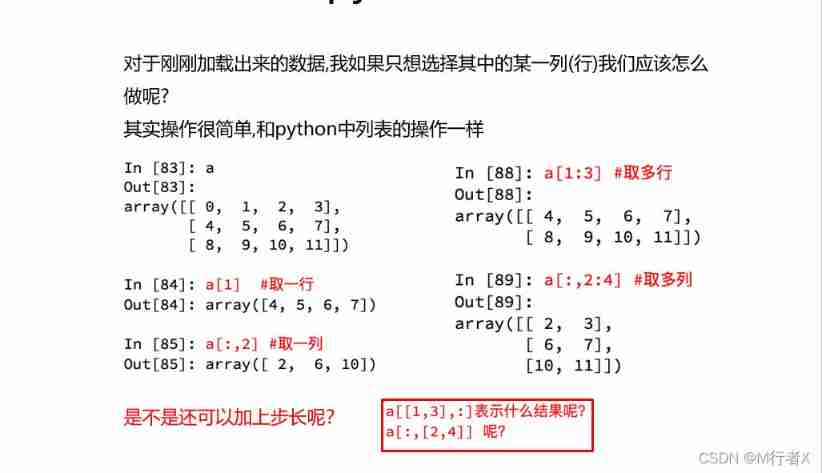
- How to select one or more rows of data ( Column )?
- How to assign values to selected rows or columns ?
- How to make it bigger than 10 Replace the value of with 10?
- np.where How to use ?
- np.clip How to use ?
- How to transpose ( Exchange axis )?
- Read and save data as csv
- np.nan and np.inf What is it?
- How many common statistical functions do you remember ?
- What information does the standard deviation reflect about the data
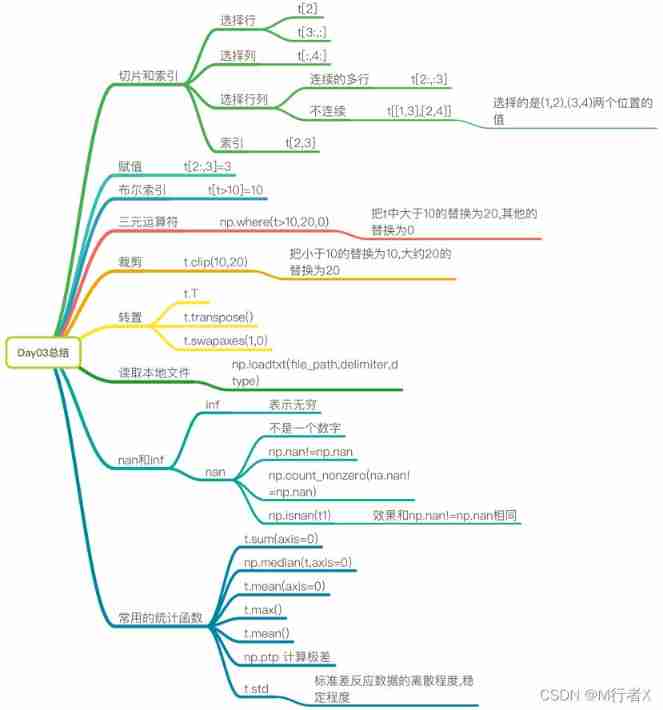
#### numpy Index and slice of
- t[10,20]
- `t[[2,5],[4,8]]`
- t[3:]
- t[[2,5,6]]
- t[:,:4]
- t[:,[2,5,6]]
- t[2:3,5:7]
#### numpy Medium bool Indexes ,where,clip Use
- t[t<30] = 2
- np.where(t<10,20,5)
- t.clip(10,20)
#### Transpose and read local files
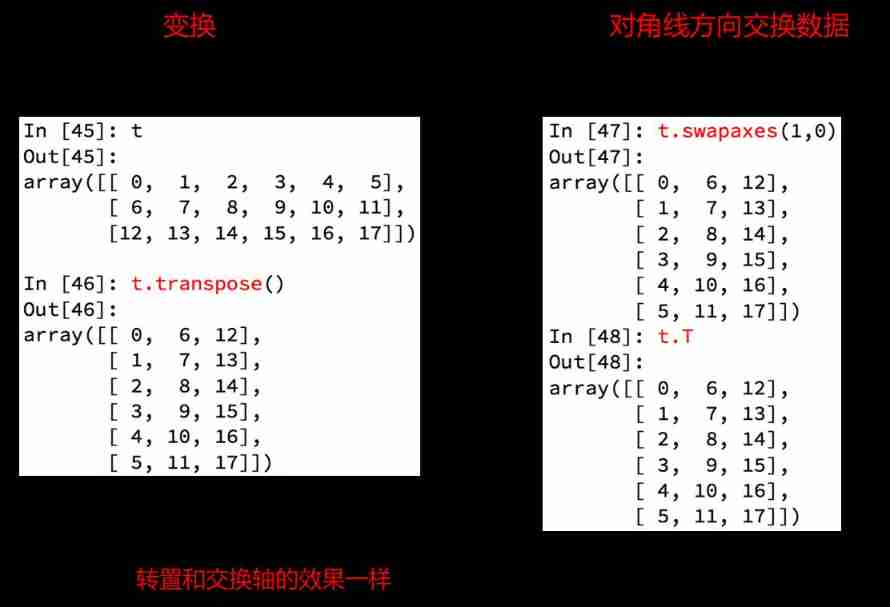
- t.T
- t.transpose()
- t.sawpaxes()
- np.loadtxt(file_path,delimiter,dtype)
#### nan and inf What is it?
- nan not a number
- np.nan != np.nan
- Any value sum nan All calculations are nan
- inf infinite
#### Commonly used statistical functions
- t.sum()
- t.mean()
- np.meadian()
- t.max()
- t.min()
- np.ptp()
- t.std()

import numpy as np
from matplotlib import  pyplot as plt

us_file_path = "./youtube_video_data/US_video_data_numbers.csv"
uk_file_path = "./youtube_video_data/GB_video_data_numbers.csv"

# t1 = np.loadtxt(us_file_path,delimiter=",",dtype="int",unpack=True)
t_us = np.loadtxt(us_file_path,delimiter=",",dtype="int")

# Take the data of the comment
t_us_comments = t_us[:,-1]

# Choose more than 5000 Small data
t_us_comments = t_us_comments[t_us_comments<=5000]

print(t_us_comments.max(),t_us_comments.min())

d = 50

bin_nums = (t_us_comments.max()-t_us_comments.min())//d

# mapping
plt.figure(figsize=(20,8),dpi=80)

plt.hist(t_us_comments,bin_nums)


plt.show()
import numpy as np
from matplotlib import  pyplot as plt

us_file_path = "./youtube_video_data/US_video_data_numbers.csv"
uk_file_path = "./youtube_video_data/GB_video_data_numbers.csv"

# t1 = np.loadtxt(us_file_path,delimiter=",",dtype="int",unpack=True)
t_uk = np.loadtxt(uk_file_path,delimiter=",",dtype="int")

# Choose to like books better than 50 Ten thousand small data
t_uk = t_uk[t_uk[:,1]<=500000]

t_uk_comment = t_uk[:,-1]
t_uk_like = t_uk[:,1]


plt.figure(figsize=(20,8),dpi=80)
plt.scatter(t_uk_like,t_uk_comment)

plt.show()
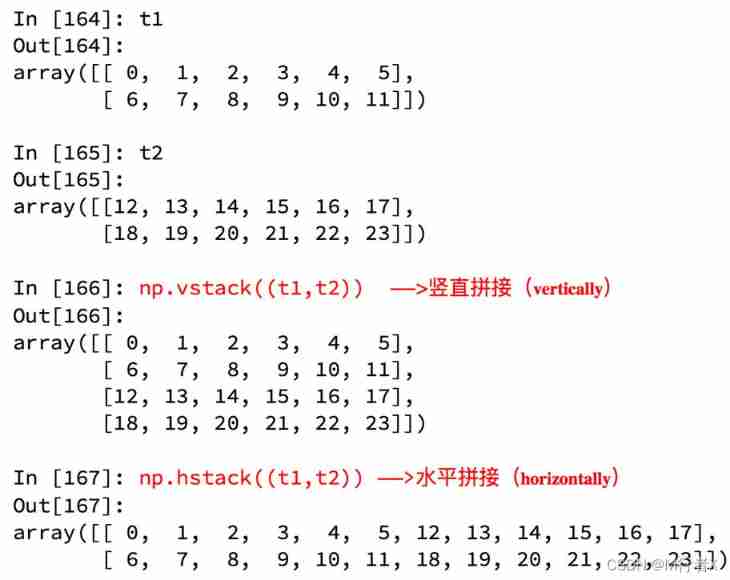
Data splicing

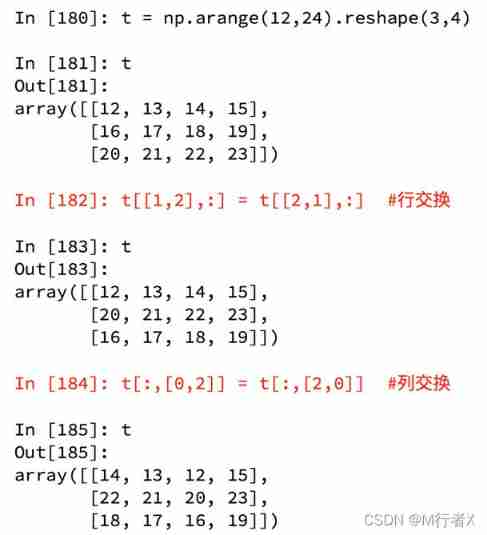
Data row column exchange
Now I hope to study and analyze the data methods of the two countries in the previous case , So what should I do ?
# coding=utf-8
import numpy as np
us_data = "./youtube_video_data/US_video_data_numbers.csv"
uk_data = "./youtube_video_data/GB_video_data_numbers.csv"
# Load country data
us_data = np.loadtxt(us_data,delimiter=",",dtype=int)
uk_data = np.loadtxt(uk_data,delimiter=",",dtype=int)
# Add country information
# The structure is all 0 The data of
zeros_data = np.zeros((us_data.shape[0],1)).astype(int)
ones_data = np.ones((uk_data.shape[0],1)).astype(int)
# Add a column with all 0,1 Array of
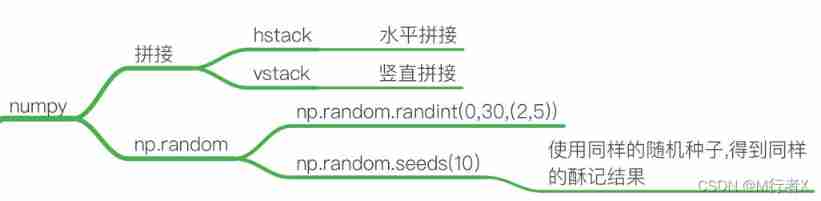
us_data = np.hstack((us_data,zeros_data))
uk_data = np.hstack((uk_data,ones_data))
# Splice two sets of data
final_data = np.vstack((us_data,uk_data))
print(final_data)
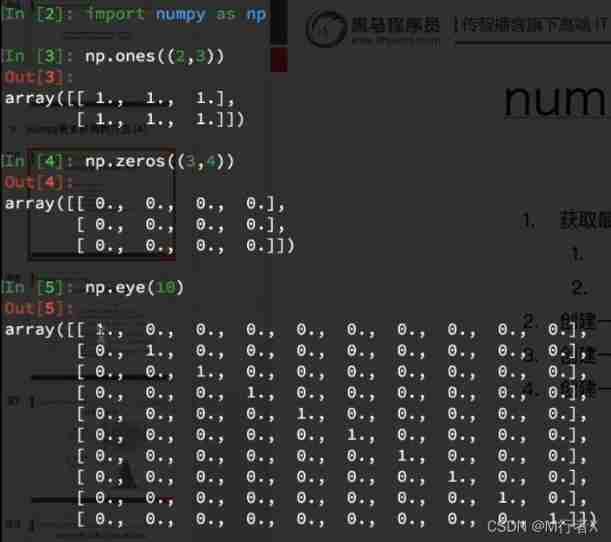
More easy-to-use methods

numpy Generate random number
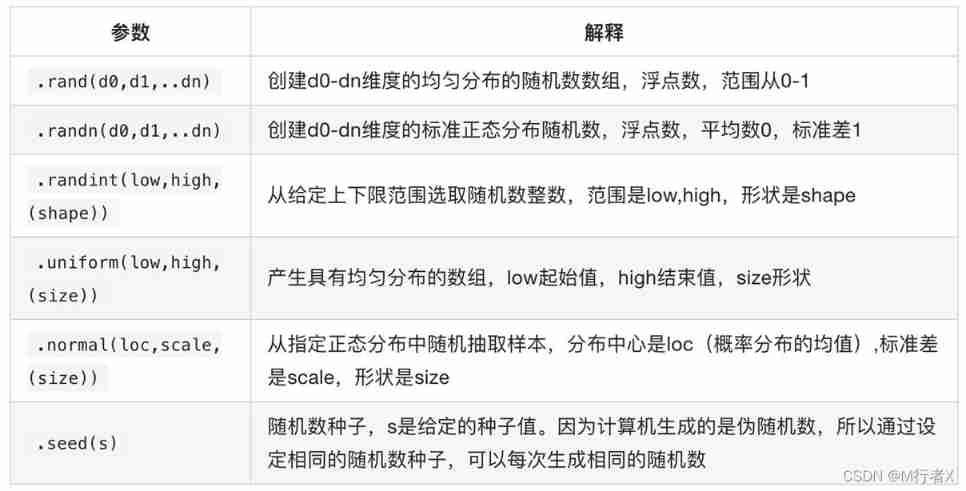
# coding=utf-8
import numpy as np


np.random.seed(10)
t = np.random.randint(0,20,(3,4))
print(t)
numpy Points for attention copy and view

边栏推荐
- DAY TWO
- What is AVL tree?
- Google, Baidu and Yahoo are general search engines developed by Chinese companies_ Baidu search engine URL
- What is web penetration testing_ Infiltration practice
- [CVPR 2022] semi supervised object detection: dense learning based semi supervised object detection
- GPIO簡介
- [automated testing framework] what you need to know about unittest
- 48页数字政府智慧政务一网通办解决方案
- X.509 certificate based on go language
- Interface joint debugging test script optimization v4.0
猜你喜欢

DAY FIVE

什么是响应式对象?响应式对象的创建过程?
DAY FIVE
![[boutique] Pinia Persistence Based on the plug-in Pinia plugin persist](/img/53/95ab85bfd99d943f98881596d0aa8c.png)
[boutique] Pinia Persistence Based on the plug-in Pinia plugin persist
【精品】pinia 基于插件pinia-plugin-persist的 持久化
2022 PMP project management examination agile knowledge points (9)

从外企离开,我才知道什么叫尊重跟合规…
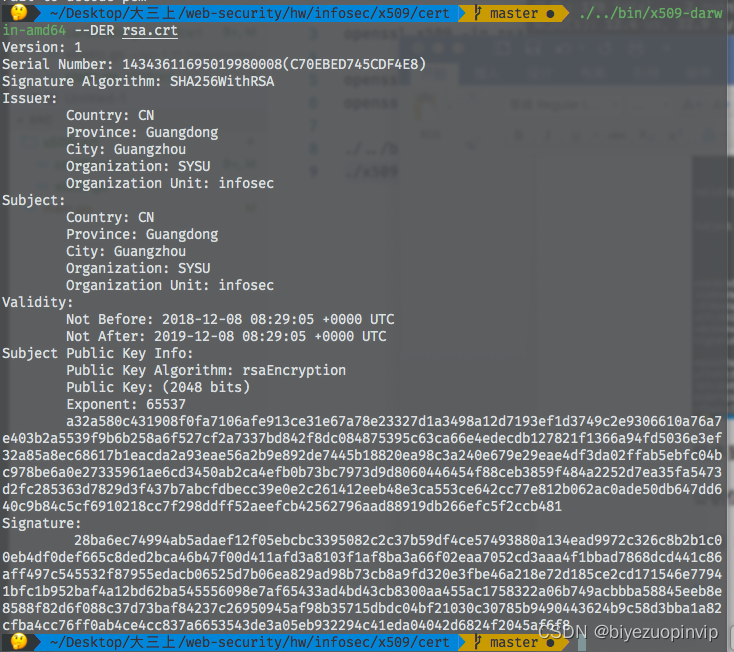
基於GO語言實現的X.509證書
MySQL learning notes (mind map)

Clipboard management tool paste Chinese version
随机推荐
VTK volume rendering program design of 3D scanned volume data
Use package FY in Oracle_ Recover_ Data. PCK to recover the table of truncate misoperation
St table
Automatic test tool katalon (WEB) test operation instructions
Encryption algorithm - password security
Compilation of kickstart file
[CVPR 2022] semi supervised object detection: dense learning based semi supervised object detection
2022/2/12 summary
智能运维应用之道,告别企业数字化转型危机
openresty ngx_lua子请求
The difference between redirectto and navigateto in uniapp
ldap创建公司组织、人员
509 certificat basé sur Go
三维扫描体数据的VTK体绘制程序设计
Geo data mining (III) enrichment analysis of go and KEGG using David database
Designed for decision tree, the National University of Singapore and Tsinghua University jointly proposed a fast and safe federal learning system
System activity monitor ISTAT menus 6.61 (1185) Chinese repair
MIT 6.824 - Raft学生指南
JS import excel & Export Excel
App general function test cases