当前位置:网站首页>Histogram-2 (add 50 pixels and subtract 50 pixels and grayscale histogram mask for each pixel value in the picture)
Histogram-2 (add 50 pixels and subtract 50 pixels and grayscale histogram mask for each pixel value in the picture)
2022-07-08 02:20:00 【So come on】
1、 Increase the value of each pixel in the picture 50 Pixels and subtraction 50 Pixel
# 1  Import library
import cv2
import matplotlib.pyplot as plt
import numpy as np

# 2  Method : display picture
def show_image(image, title, pos):
    #   Sequential conversion :BGR TO RGB
    image_RGB = image[:, :, ::-1] # shape : (height, width, channel)
    #  Show title
    plt.title(title)
    plt.subplot(2, 3, pos) #  location
    plt.imshow(image_RGB)

# 3  Method : Display the gray histogram of the picture
def show_histogram(hist, title, pos, color):
    #  Show title
    plt.title(title)
    plt.subplot(2, 3, pos) #  Positioning pictures
    plt.xlabel("Bins") #  Horizontal axis information
    plt.ylabel("Pixels") #  Vertical axis information
    plt.xlim([0, 256]) #  Range
    plt.plot(hist, color=color) #  Draw histogram


# 4  The main function  main()
def main():
    # 5  Create a canvas
    plt.figure(figsize=(15, 6)) #  Canvas size
    plt.suptitle("Gray Image Histogram", fontsize=14, fontweight="bold") #  Set the title form

    # 6  Loading pictures
    img = cv2.imread("children.jpg")

    # 7  Gray scale conversion
    img_gray = cv2.cvtColor(img, cv2.COLOR_BGR2GRAY)

    # 8  Calculate the histogram of gray image
    hist_img = cv2.calcHist([img_gray], [0], None, [256], [0, 256])

    # 9  Display gray histogram
    #  Gray scale image is converted into BGR Format picture
    img_BGR = cv2.cvtColor(img_gray, cv2.COLOR_GRAY2BGR)
    show_image(img_BGR, "BGR image", 1)
    show_histogram(hist_img, "gray image histogram", 4, "m")

    # 10  Increase the value of each pixel in the picture 50 Pixel
    M = np.ones(img_gray.shape, np.uint8) * 50 #  Build the matrix
    # np.ones() Function returns a new array of the given shape and data type , Where the value of the element is set to 1.   multiply 50

    added_img = cv2.add(img_gray, M)
    add_img_hist = cv2.calcHist([added_img], [0], None, [256], [0, 256]) #  Calculate the histogram    List elements
    added_img_BGR = cv2.cvtColor(added_img, cv2.COLOR_GRAY2BGR)  #BGR
    show_image(added_img_BGR, "added image", 2)
    show_histogram(add_img_hist, "added image hist", 5, "m")

    # 11  Subtract... From each pixel value in the picture 50 Pixel
    subtract_img = cv2.subtract(img_gray, M)
    subtract_img_hist = cv2.calcHist([subtract_img], [0], None, [256], [0, 256]) #  Calculate the histogram
    subtract_img_BGR = cv2.cvtColor(subtract_img, cv2.COLOR_GRAY2BGR)
    show_image(subtract_img_BGR, "subtracted image", 3)
    show_histogram(subtract_img_hist, "subtracted image hist", 6, "m")

    plt.show()

#  Call the main function
if __name__ == '__main__':
    main()
2、 Gray histogram ——mask
mask : Extract the region of interest .
# 1  Import library
import cv2
import matplotlib.pyplot as plt
import numpy as np

# 2  Method : display picture
def show_image(image, title, pos):
    img_RGB = image[:, :, ::-1]  # BGR to RGB
    plt.title(title)
    plt.subplot(2, 2, pos)
    plt.imshow(img_RGB)

# 3  Method : Displays a grayscale histogram
def show_histogram(hist, title, pos, color):
    plt.subplot(2, 2, pos)
    plt.title(title)
    plt.xlim([0, 256])
    plt.plot(hist, color=color)

# 4  The main function
def main():
    # 5  Create a canvas
    plt.figure(figsize=(12, 7))
    plt.suptitle("Gray Image and Histogram with mask", fontsize=16, fontweight="bold")

    # 6  Read the picture and convert it into gray , Calculate the histogram , Show
    img_gray = cv2.imread("children.jpg", cv2.COLOR_BGR2GRAY) #  Read and perform grayscale conversion
    img_gray_hist = cv2.calcHist([img_gray], [0], None, [256], [0, 256]) #  Calculate the histogram
    show_image(img_gray, "image gray", 1)
    show_histogram(img_gray_hist, "image gray histogram", 2, "m")

    # 7  establish mask, Calculate bitmap , Histogram
    mask = np.zeros(img_gray.shape[:2], np.uint8)
    mask[130:500, 600:1400] = 255 #  obtain mask, And give color
    img_mask_hist = cv2.calcHist([img_gray], [0], mask, [256], [0, 256])  #  Calculation mask Histogram
    #  Return to a given shape and type 0 Filled array ;zeros(shape, dtype=float, order=‘C’)
    # shape:  shape   dtype:  data type , Optional parameters , Default numpy.float64  order:  Optional parameters ,c Representative and c Language is similar to , Line first ;F Delegate priority

    # 8  Bit operation ( And operation ) Calculation with mask Gray scale image of
    mask_img = cv2.bitwise_and(img_gray, img_gray, mask = mask)

    # 9  Display with mask Pictures and histograms of
    show_image(mask_img, "gray image with mask", 3)
    show_histogram(img_mask_hist, "histogram with masked gray image", 4, "m")

    plt.show()
if __name__ == '__main__':
    main()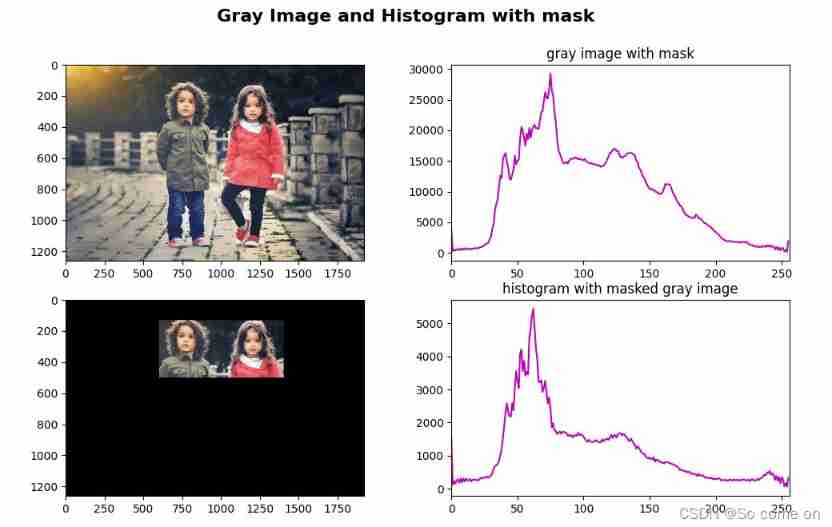
边栏推荐
- Give some suggestions to friends who are just getting started or preparing to change careers as network engineers
- 非分区表转换成分区表以及注意事项
- Random walk reasoning and learning in large-scale knowledge base
- Deeppath: a reinforcement learning method of knowledge graph reasoning
- [knowledge map] interpretable recommendation based on knowledge map through deep reinforcement learning
- Master go game through deep neural network and tree search
- Many friends don't know the underlying principle of ORM framework very well. No, glacier will take you 10 minutes to hand roll a minimalist ORM framework (collect it quickly)
- Completion report of communication software development and Application
- Unity 射线与碰撞范围检测【踩坑记录】
- Leetcode question brushing record | 27_ Removing Elements
猜你喜欢
Learn CV two loss function from scratch (1)
1385:团伙(group)

Key points of data link layer and network layer protocol

leetcode 873. Length of Longest Fibonacci Subsequence | 873. 最长的斐波那契子序列的长度
Common disk formats and the differences between them

"Hands on learning in depth" Chapter 2 - preparatory knowledge_ 2.2 data preprocessing_ Learning thinking and exercise answers
非分区表转换成分区表以及注意事项

The bank needs to build the middle office capability of the intelligent customer service module to drive the upgrade of the whole scene intelligent customer service

文盘Rust -- 给程序加个日志
Yolov5 Lite: ncnn+int8 deployment and quantification, raspberry pie can also be real-time
随机推荐
Learn CV two loss function from scratch (1)
企业培训解决方案——企业培训考试小程序
如何用Diffusion models做interpolation插值任务?——原理解析和代码实战
1331:【例1-2】后缀表达式的值
Installing and using mpi4py
Semantic segmentation | learning record (1) semantic segmentation Preface
idea窗口不折叠
Deeppath: a reinforcement learning method of knowledge graph reasoning
The generosity of a pot fish
Industrial Development and technological realization of vr/ar
数据链路层及网络层协议要点
Introduction to QT: video player
鱼和虾走的路
The bank needs to build the middle office capability of the intelligent customer service module to drive the upgrade of the whole scene intelligent customer service
leetcode 865. Smallest Subtree with all the Deepest Nodes | 865. The smallest subtree with all the deepest nodes (BFs of the tree, parent reverse index map)
Literature reading and writing
leetcode 866. Prime Palindrome | 866. prime palindromes
Force buckle 5_ 876. Intermediate node of linked list
Le chemin du poisson et des crevettes
Little knowledge about TXE and TC flag bits