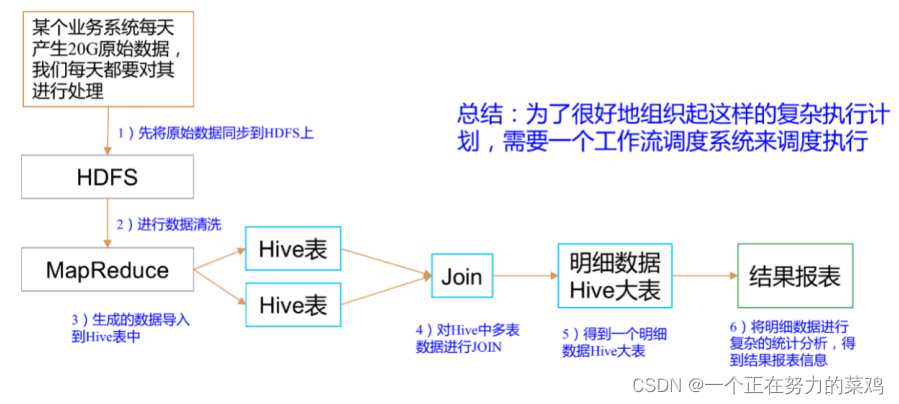
Kubernetes monitor
When your application is deployed to Kubenetes after , It's hard to see what's going on inside the container , Once the container dies , The data inside may never be recovered , You can't even view the log to locate the problem , Besides, there may be many instances of an application , A user's request does not specify which container is processed , This makes it possible to Kubernetes It is complicated to troubleshoot the application in . Beyond the application , because Kubernetes As infrastructure , In charge of the life and death of the whole cluster ,Kubernetes Any faults in the , It must affect the operation of application services , So monitor Kubernetes Health is also critical .
When your application is on cloud native , Then you have to pay attention to the running state of each server , Operational status of infrastructure and middleware ,Kubernetes The running state of each component and resource object in the , The running state of each application . Of course , This running state is a vague concept , It depends on our focus , What each monitored object wants to express " Running state " It's different . In order to monitor the objects we focus on , The object needs to make some cooperation , Provide appropriate expression information of operation state , For us to collect and analyze , This can be called observability .
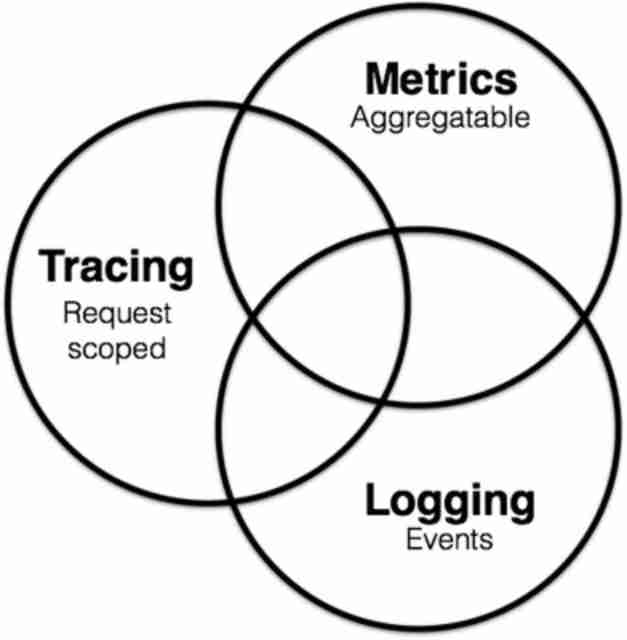
In cloud native , Observability is generally divided into three scopes :
You can Kubernetes Documentation on how to monitor 、 debugging , And learn how to handle logs :
https://v1-20.docs.kubernetes.io/docs/tasks/debug-application-cluster/
In this paper , The monitoring mentioned , Only include Metrics .
Metrics、Tracing、Logging Not completely independent , In the diagram above ,Metrics It may also include Logging and Tracing Information about .
Monitoring object
Monitoring data to be collected , From the monitored object , And in the Kubernetes In the cluster , We can divide the objects to be monitored into three parts :
- machine : All node machines in the cluster , The indicators are CPU Memory usage 、 Networks and hard drives IO Speed, etc ;
- Kubernetes Object state :Deployments, Pods, Daemonsets, Statefulset And other object status and some index information ;
- application :Pod Status or indicator of each container in the , And what the container itself may provide
/metricsEndpoint .
Prometheus
In the basic environment , A complete monitoring should include collecting data 、 Store the data 、 Analyze stored data 、 Display data 、 Alarm and other parts , Each part has relevant tools or technologies to solve the diverse needs and complexity of the cloud native environment .
Since we need to monitor , Then you need monitoring tools . The monitoring tool can obtain all important indicators and logs (Metrics You can also include some logs ), And store them in a secure 、 Centralized location , So that you can access them at any time to develop solutions to problems . Because in the primary cloud , Apply to Kubernetes Deployment in cluster , therefore , monitor Kubernetes It can give you an in-depth understanding of the health and performance indicators of the cluster 、 A top-level overview of the resource count and the internal situation of the cluster . When something goes wrong , Monitoring tools will remind you ( Alarm function ), So that you can quickly launch the fix .
Prometheus It's a CNCF project , You can monitor Kubernetes、 Nodes and Prometheus In itself , at present Kubernetes Official documents mainly recommend Prometheus In itself , It's for Kubernetes The container orchestration platform provides out of the box monitoring capabilities . So in this paper , The design of monitoring scheme is around Prometheus In the .
Here is Prometheus Some of the components of :
- Metric Collection: Prometheus Use the pull model to pass HTTP Retrieval metrics . stay Prometheus When indicators cannot be obtained , You can choose to use Pushgateway Push the indicator to Prometheus .
- Metric Endpoint: Want to use Prometheus The monitoring system should expose a certain / Measure endpoint metrics , Prometheus Use this endpoint to extract indicators at fixed intervals .
- PromQL: Prometheus Incidental PromQL, This is a very flexible query language , Can be used to query Prometheus Indicators in the dashboard . Besides ,Prometheus UI and Grafana Will use PromQL Query to visualize metrics .
- Prometheus Exporters: There are many libraries and servers that can help export existing metrics from third-party systems to Prometheus indicators . This is not for direct use Prometheus Indicators detect the condition of a given system .
- TSDB (time-series database): Prometheus Use TSDB Store all data efficiently . By default , All data is stored locally . However , To avoid a single point of failure ,prometheustsdb You can choose to integrate remote storage .
Prometheus stay Kubernetes The structure of the monitoring scheme in is as follows :
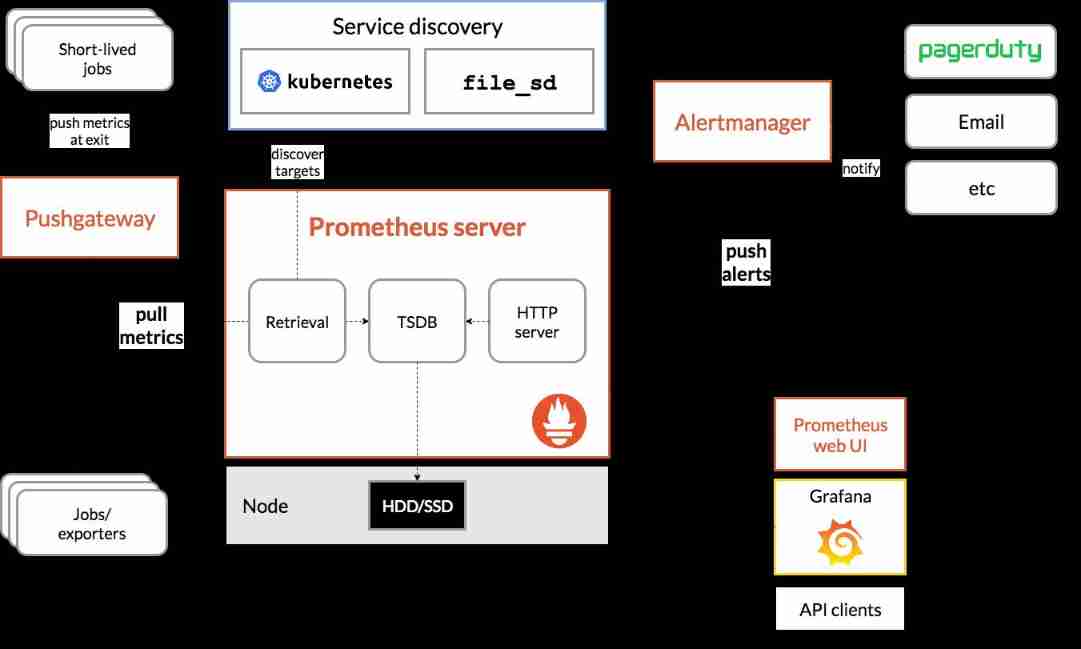
【 Picture source :https://devopscube.com/setup-prometheus-monitoring-on-kubernetes/】
indicators
There are many kinds of objects to monitor , We call an object of the same type an entity , The data generated by each entity runtime object has a variety of , In order to summarize and collect these data , Prometheus The various attribute values in the entity are divided into Counter ( Counter )、Gauge ( The dashboard )、Histogram( cumulative histogram )、Summary( Abstract ) Four types , Each attribute in the entity , It's called the indicator , for example The container has been used accumulatively CPU The amount , Use indicator name container_cpu_usage_seconds_total Record .
The general format of each indicator is :
Index name { Metadata = value } Index value
Every object generates data all the time , To distinguish which object the current indicator value belongs to , You can give the index in addition to the index value , Attach a lot of metadata information , The following example shows .
container_cpu_usage_seconds_total{
	beta_kubernetes_io_arch = "amd64",
	  beta_kubernetes_io_os = "linux",
	  container = "POD",
	  cpu = "total",
	  id = "...",
	  image = "k8s.gcr.io/pause:3.5",
	  instance = "slave1",
	  job = "kubernetes-cadvisor",
	  kubernetes_io_arch = "amd64",
	  kubernetes_io_hostname = "slave1",
	  kubernetes_io_os = "linux",
	  name = "k8s_POD_pvcpod_default_02ed547b-6279-4346-8918-551b87877e91_0",
	  namespace = "default",
	  pod = "pvcpod"
}
After the object generates text with a structure similar to this , Can expose metrics Endpoint , Give Way Prometheus Automatic acquisition , Or through Pushgateway Pushed to the Prometheus in .
Next , We will be in Kubernetes Build a complete Prometheus Monitoring system .
practice
Node monitoring
References to this chapter :https://devopscube.com/node-exporter-kubernetes/
node exporter Yes, it is Golang Compiling , Used in Linux On the system , Collect all hardware and operating system level indicators exposed by the kernel , Include CPU 、 Information 、 Network traffic 、 System load 、socket 、 Machine configuration, etc .
Readers can refer to the list of https://github.com/prometheus/node_exporter All indicators listed in the list that are on or off by default .
Since each node in the cluster needs to be monitored , Then it is necessary to ensure that each node runs this one node exporter example , And automatically schedule a node when the cluster adds a node node exporter Run into this node , So we need to use node exporter Your deployment requires DaemontSet Pattern .
View all nodes in the cluster :
[email protected]:~# kubectl get nodes
NAME     STATUS                     ROLES                  AGE     VERSION
master   Ready,SchedulingDisabled   control-plane,master   98d     v1.22.2
salve2   Ready                      <none>                 3h50m   v1.23.3
slave1   Ready                      <none>                 98d     v1.22.2
Bibin Wilson The boss has encapsulated it for Kubernetes Of node exporter Of YAML file , We can download it directly :
git clone https://github.com/bibinwilson/kubernetes-node-exporter
Open... In the warehouse daemonset.yaml file , Get a rough idea of the information .
stay YAML In file , You can see node exporter Will be deployed to the namespace monitoring Run in , It has two label:
   labels:
     app.kubernetes.io/component: exporter
     app.kubernetes.io/name: node-exporter
in order to node exporter Can be scheduled to master Run in node , We need to Pod Add tolerance attribute :
  template:
    metadata:
      labels:
        app.kubernetes.io/component: exporter
        app.kubernetes.io/name: node-exporter
    spec:
    #  Copy the following part to the corresponding location
      tolerations:
      - key: "node-role.kubernetes.io/master"
        operator: "Exists"
        effect: "NoSchedule"
      - key: "node.kubernetes.io/unschedulable"
        operator: "Exists"
        effect: "NoSchedule"
For deployment node exporter , Let's create a namespace first :
kubectl create namespace monitoring
Execute the command to deploy node exporter:
kubectl create -f daemonset.yaml
see node exporter example
[email protected]:~# kubectl get daemonset -n monitoring
NAME            DESIRED   CURRENT   READY   UP-TO-DATE   AVAILABLE   NODE SELECTOR   AGE
node-exporter   3         3         3       3            3           <none>          22h
because node exporter Pod Scattered in various nodes , For convenience Prometheus Collect these node exporter Of Pod IP, Need to create Endpoint Unified collection , Here, by creating Service Automatic generation Endpoint To achieve the goal .
Check the... Under the warehouse service.yaml file , Its definition is as follows :
kind: Service
apiVersion: v1
metadata:
  name: node-exporter
  namespace: monitoring
  annotations:
      prometheus.io/scrape: 'true'
      prometheus.io/port:   '9100'
spec:
  selector:
      app.kubernetes.io/component: exporter
      app.kubernetes.io/name: node-exporter
  ports:
  - name: node-exporter
    protocol: TCP
    port: 9100
    targetPort: 9100
this Service The selectors are as follows :
selector:
   app.kubernetes.io/component: exporter
   app.kubernetes.io/name: node-exporter
establish Service:
kubectl create -f service.yaml
see Endpoint Collected node exporter Of Pod IP:
[email protected]:~# kubectl get endpoints -n monitoring
NAME                    ENDPOINTS                                       AGE
node-exporter           10.32.0.27:9100,10.36.0.4:9100,10.44.0.3:9100   22h
node exporter In addition to collecting various indicator data , No more .
Deploy Prometheus
Reference in this section https://devopscube.com/setup-prometheus-monitoring-on-kubernetes/
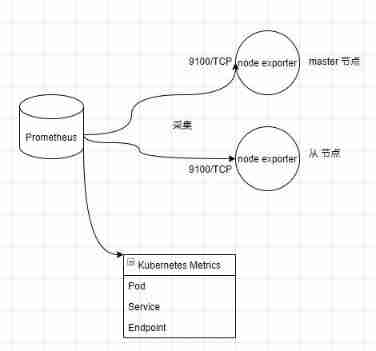
There is now a node exporter , It can collect various indicators of nodes , The next step is to Kubernetes Infrastructure metrics data collection .
Kubernetes They provide a lot of metrics data , There are three endpoints /metrics/cadvisor, /metrics/resource and /metrics/probes .
With /metrics/cadvisor For example ,cAdvisor Analyze the memory of all containers running on a given node 、CPU、 Indicators of file and network usage , You can refer to https://github.com/google/cadvisor/blob/master/docs/storage/prometheus.md understand cAdvisor All the indicators of .
Other information :
Source location :https://github.com/kubernetes/metrics/blob/master/pkg/apis/metrics/v1beta1/types.go
Kubernetes Monitoring architecture design :https://github.com/kubernetes/design-proposals-archive
In this section , The deployment of Prometheus Will be right kubenetes Do the following to collect metrics data :
- Kubernetes-apiservers: from API The server gets all the indicators ;
- Kubernetes node : It collects all kubernetes Node index ;
kubernetes-pods: pod Add... To the metadata prometheus.io/scrape and prometheus.io/port notes , be-all pod Indicators will be found ;kubernetes-cadvisor: Collect all cAdvisor indicators , Container related ;- Kubernetes-Service-endpoints: If the service metadata uses prometheus.io/scrape Annotation and prometheus.io/port notes , Then all service endpoints will be discarded ;
Bibin Wilson The boss has encapsulated the relevant deployment definition file , We can download it directly :
git clone https://github.com/bibinwilson/kubernetes-prometheus
Prometheus By using Kubernetes API Server , obtain Each node 、Pod、Deployment Wait for all available indicators . therefore , We need to create a that has the right API Only Read access rights Of RBAC Strategy , And bind the policy to the monitoring namespace , To limit Prometheus Pod Only right API Read it .
see clusterRole.yaml file , You can the list of resource objects to be monitored :
- apiGroups: [""]
  resources:
  - nodes
  - nodes/proxy
  - services
  - endpoints
  - pods
  verbs: ["get", "list", "watch"]
- apiGroups:
  - extensions
  resources:
  - ingresses
Create roles and role bindings in the cluster :
kubectl create -f clusterRole.yaml
Can pass Through command line flags and configuration files Yes Prometheus To configure . Although the command line flag is configured with immutable system parameters ( For example, storage location 、 The amount of data to be saved in disk and memory, etc ), But the configuration file defines everything related to the grab job and its instances , And which rule files to load , So deploy Permetheus File configuration is indispensable .
Permetheus Configuration file to YAML Format to write , Specific rules can be referred to :https://prometheus.io/docs/prometheus/latest/configuration/configuration/
To facilitate mapping configuration files to Permetheus Pod in , We need to put the configuration into configmap , Then mount to Pod, The configuration content can be viewed config-map.yaml .config-map.yaml Many rules for collecting data sources are defined in , For example collection Kubernetes Clusters and node exporter , Configuration reference :
    scrape_configs:
      - job_name: 'node-exporter'
        kubernetes_sd_configs:
          - role: endpoints
        relabel_configs:
        - source_labels: [__meta_kubernetes_endpoints_name]
          regex: 'node-exporter'
          action: keep
You can open it https://raw.githubusercontent.com/bibinwilson/kubernetes-prometheus/master/config-map.yaml Preview this file online .
establish configmap:
kubectl create -f config-map.yaml
This configuration is very important , It needs to be configured according to the actual situation , It is generally handled by the operation and maintenance department , No more discussion here .
Next, we will deploy Prometeus , Because... Is used in the sample file emtpy Volume storage Prometheus data , So once Pod Restart, etc. , Data will be lost , So this can be changed to hostpath volume .
open prometheus-deployment.yaml file :
take
emptyDir: {}
Change to
          hostPath:
            path: /data/prometheus
            type: Directory
It can be changed but not changed .
If you change it , Need to be scheduled for this Pod Create on the corresponding node
/data/prometheusCatalog .
Deploy Prometeus :
kubectl create -f prometheus-deployment.yaml
View deployment status :
[email protected]:~# kubectl get deployments --namespace=monitoring
NAME                    READY   UP-TO-DATE   AVAILABLE   AGE
prometheus-deployment   1/1     1            1           23h
In order to visit Prometeus , Need to create Service:
apiVersion: v1
kind: Service
metadata:
  name: prometheus-service
  namespace: monitoring
  annotations:
      prometheus.io/scrape: 'true'
      prometheus.io/port:   '9090'

spec:
  selector:
    app: prometheus-server
  type: NodePort
  ports:
    - port: 8080
      targetPort: 9090
      nodePort: 30000
kubectl create -f prometheus-service.yaml
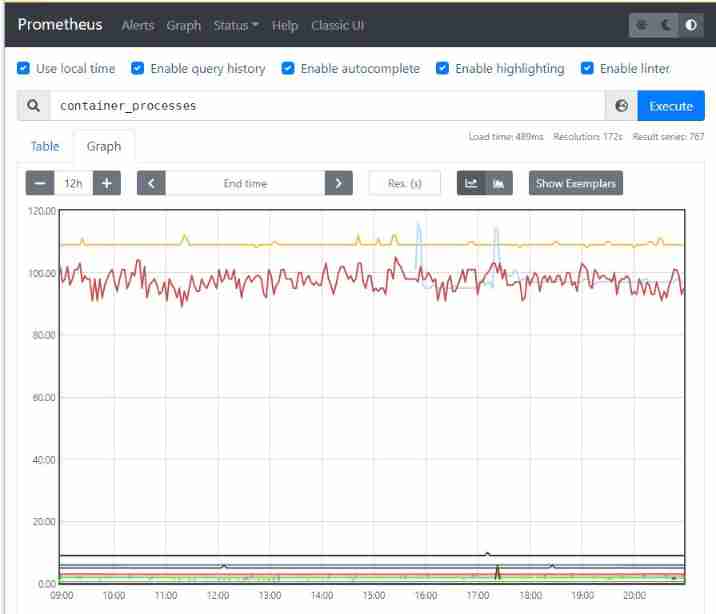
Next you can visit Prometeus UI panel .
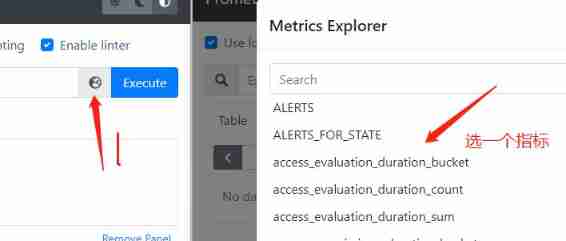
Click on Graph, Click on the icon , Select the indicator value to be displayed , Click again Execute Query display .
You can also Service Discobery in , see Prometheus Collected metrics data source .
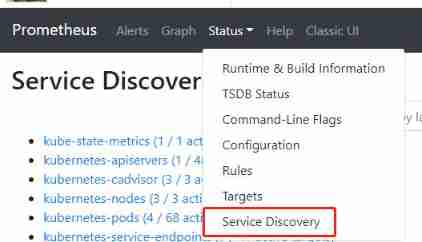
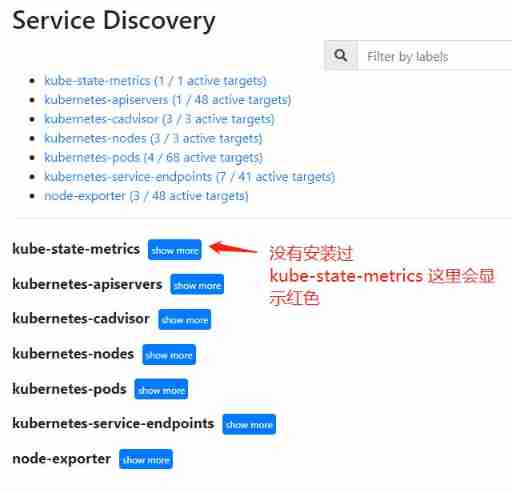
If your cluster has not been installed kube-state-metrics, Then the data source will display a red mark , In the next section , Let's continue to deploy this component .
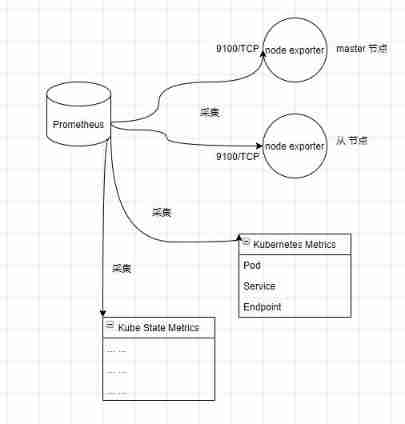
thus , Our monitoring structure is as follows :
Deploy Kube State Metrics
References in this section :https://devopscube.com/setup-kube-state-metrics/
Kube State metrics It's a service , It is associated with Kubernetes API Server signal communication , To get all API Object details , Such as Deployment、Pod etc. .
Kube State metrics Provides information that cannot be accessed directly from the local network Kubernetes Monitor the information obtained by the component Kubernetes Objects and resources Measure , because Kubenetes Metrics The indicators provided by itself are not very comprehensive , Therefore need Kube State Metrics In order to obtain and kubernetes All metrics related to the object .
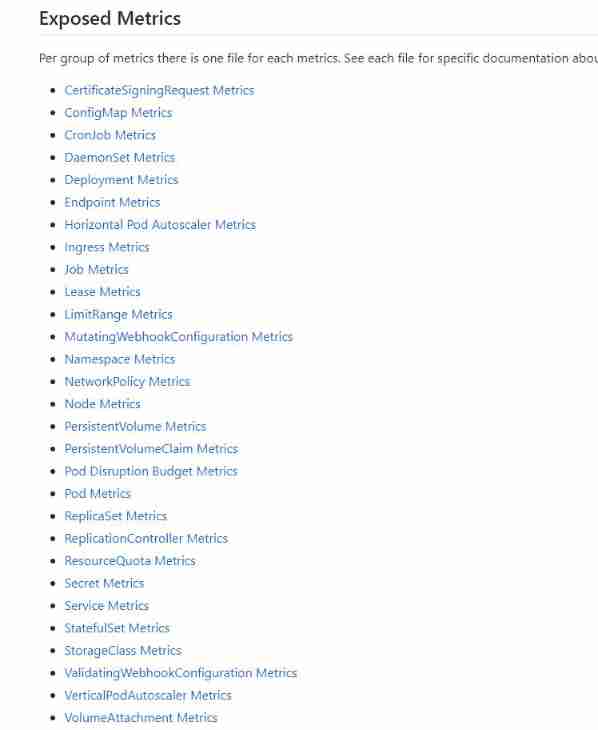
Here are some examples from Kube State metrics Some important metrics obtained in :
- Node status, node capacity (CPU and memory)
- Replica-set compliance (desired/available/unavailable/updated status of replicas per deployment)
- Pod status (waiting, running, ready, etc)
- Ingress metrics
- PV, PVC metrics
- Daemonset & Statefulset metrics.
- Resource requests and limits.
- Job & Cronjob metrics
You can view the supported detailed indicators in the document here :https://github.com/kubernetes/kube-state-metrics/tree/master/docs
Bibin Wilson The boss has encapsulated the relevant deployment definition file , We can download it directly :
git clone https://github.com/devopscube/kube-state-metrics-configs.git
Directly apply all YAML Create corresponding resources :
kubectl apply -f kube-state-metrics-configs/
├── cluster-role-binding.yaml
├── cluster-role.yaml
├── deployment.yaml
├── service-account.yaml
└── service.yaml
The resources created above , It includes the following parts , This section , Don't start the explanation .
- Service Account
- Cluster Role
- Cluster Role Binding
- Kube State Metrics Deployment
- Service
Use the following command to check the deployment status :
kubectl get deployments kube-state-metrics -n kube-system
And then , Refresh Prometheus Service Discobery , You can see that red turns blue , Click this data source , You can see the following information :
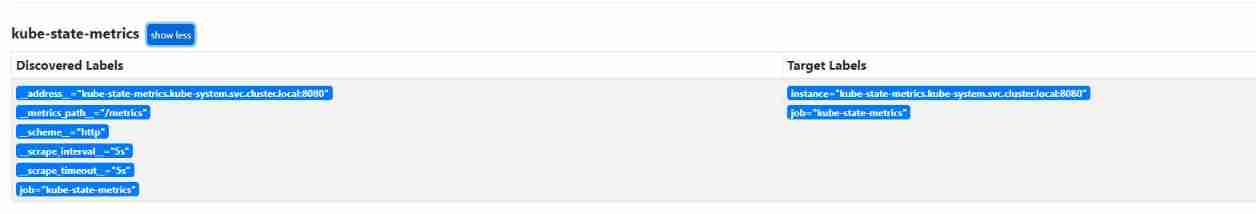
- job_name: 'kube-state-metrics'
  static_configs:
    - targets: ['kube-state-metrics.kube-system.svc.cluster.local:8080']
This configuration is kube-state-metrics Access address of .
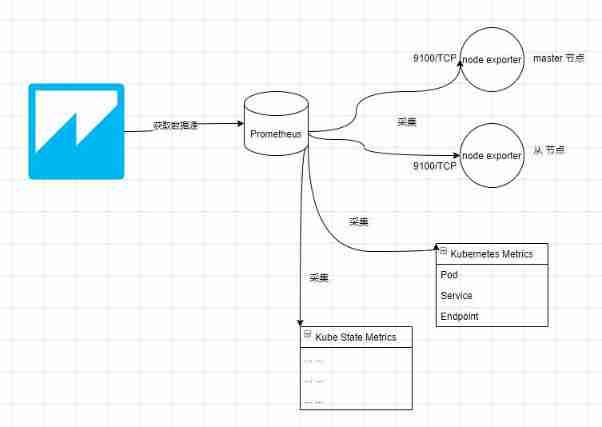
Here it is , We deployed Prometeus The structure is as follows :
Deploy Grafana
References in this section :https://devopscube.com/setup-grafana-kubernetes/
After the deployment of the previous sections , We have done a good job in data source collection and data storage , Next we will deploy Grafana, utilize Grafana Analyze and visualize the index data .
Bibin Wilson The boss has encapsulated the relevant deployment definition file , We can download it directly :
git clone https://github.com/bibinwilson/kubernetes-grafana.git
First of all to see grafana-datasource-config.yaml file , This configuration is for Grafana Automatically configure Prometheus data source .
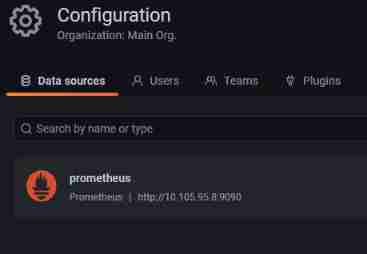
There is also a very important address :
"url": "http://prometheus-service.monitoring.svc:8080",
First you have to use the command test curl http://prometheus-service.monitoring.svc:8080, See if you can get the response data , If appear :
[email protected]:~/jk/kubernetes-prometheus# curl http://prometheus-deployment.monitoring.svc:8080
curl: (6) Could not resolve host: prometheus-deployment.monitoring.svc
[email protected]:~/jk/kubernetes-prometheus# curl http://prometheus-deployment.monitoring.svc.cluster.local:8080
curl: (6) Could not resolve host: prometheus-deployment.monitoring.svc.cluster.local
It could be you coredns Not installed or for other reasons , As a result, you cannot access... Through this address Prometheus , In order to avoid excessive operation , You can use IP, Not domain names .
see Prometheus Of Service IP:
[email protected]:~/jk/kubernetes-prometheus# kubectl get svc -n monitoring
NAME                    TYPE        CLUSTER-IP      EXTERNAL-IP   PORT(S)          AGE
prometheus-deployment   NodePort    10.105.95.8     <none>        9090:32330/TCP   23h
The test passed Service IP Whether the access is normal
[email protected]:~/jk/kubernetes-prometheus# curl 10.105.95.8:9090
<a href="/graph">Found</a>.
take grafana-datasource-config.yaml Medium prometheus-deployment.monitoring.svc.cluster.local:8080 Change to the corresponding Service IP, And the port is changed to 9090.
Create a configuration
kubectl create -f grafana-datasource-config.yaml
open deployment.yaml View definition , In the template grafana Data storage is also used empty volume , There is a risk of data loss , So you can use hospath Or other types of volume storage . Refer to the configuration of the author :
      volumes:
        - name: grafana-storage
          hostPath:
            path: /data/grafana
            type: Directory
Deploy Grafana:
kubectl create -f deployment.yaml
Then create Service:
kubectl create -f service.yaml
Then you can go through 32000 Port access Grafana.
The account and password are admin
thus , We deployed Prometheus The monitoring structure is as follows :
When I first went in, it was empty , We need to use chart template to make visual interface , To show beautiful data .
stay Grafana On the official website , There are many free templates made by the community https://grafana.com/grafana/dashboards/?search=kubernetes
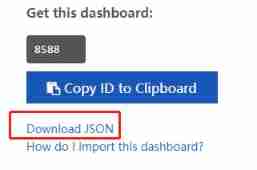
Start by opening https://grafana.com/grafana/dashboards/8588 Download this template , Then upload the template file , And bind the corresponding Prometheus data source .
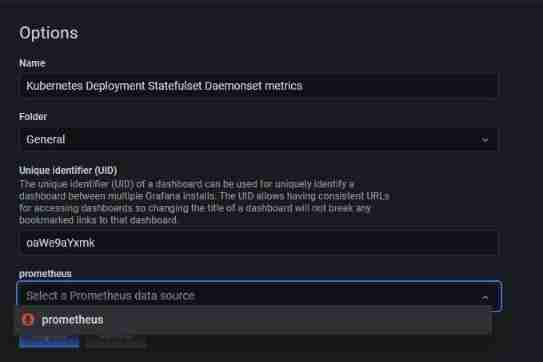
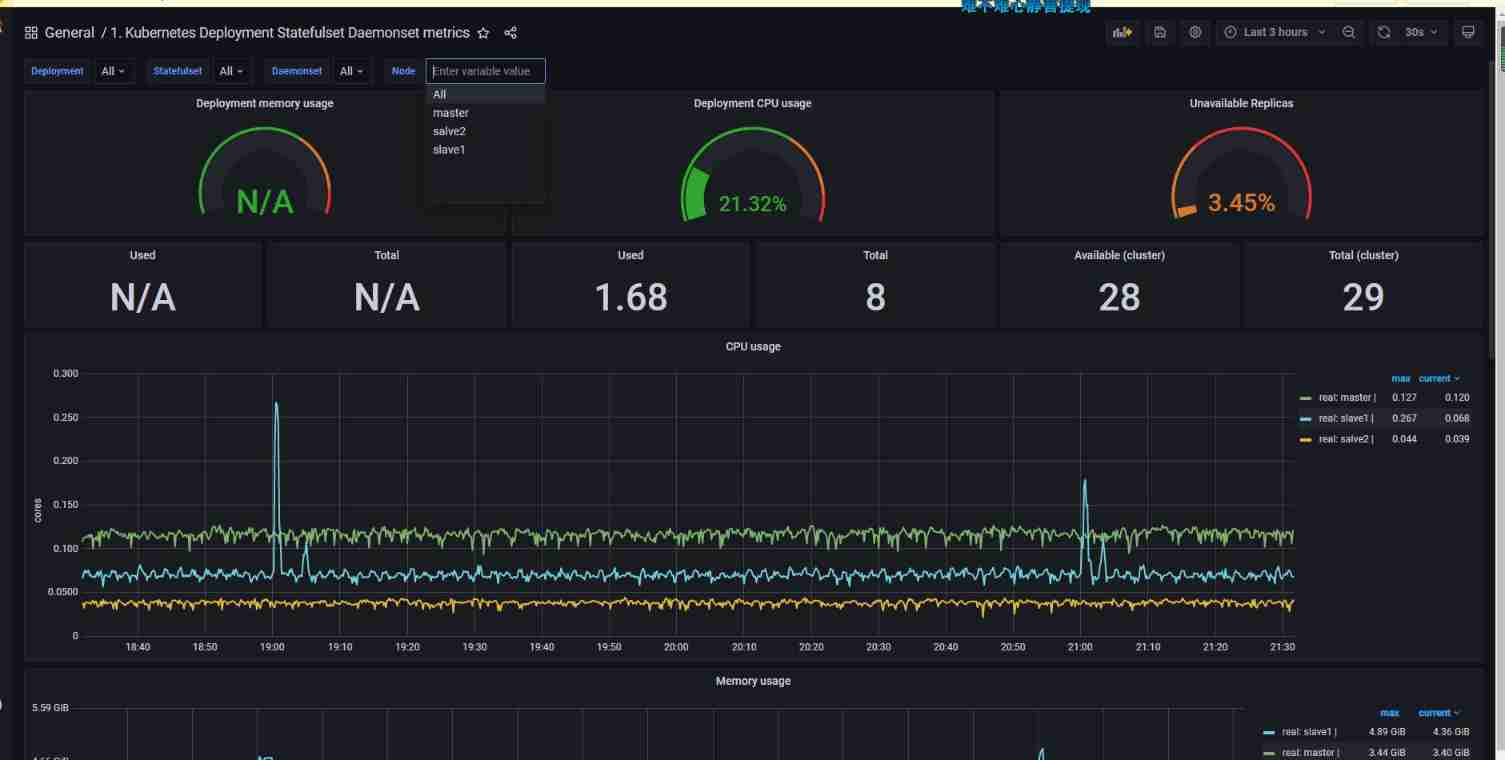
Next, you can see the corresponding monitoring interface .
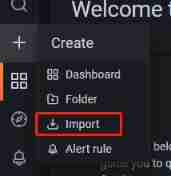
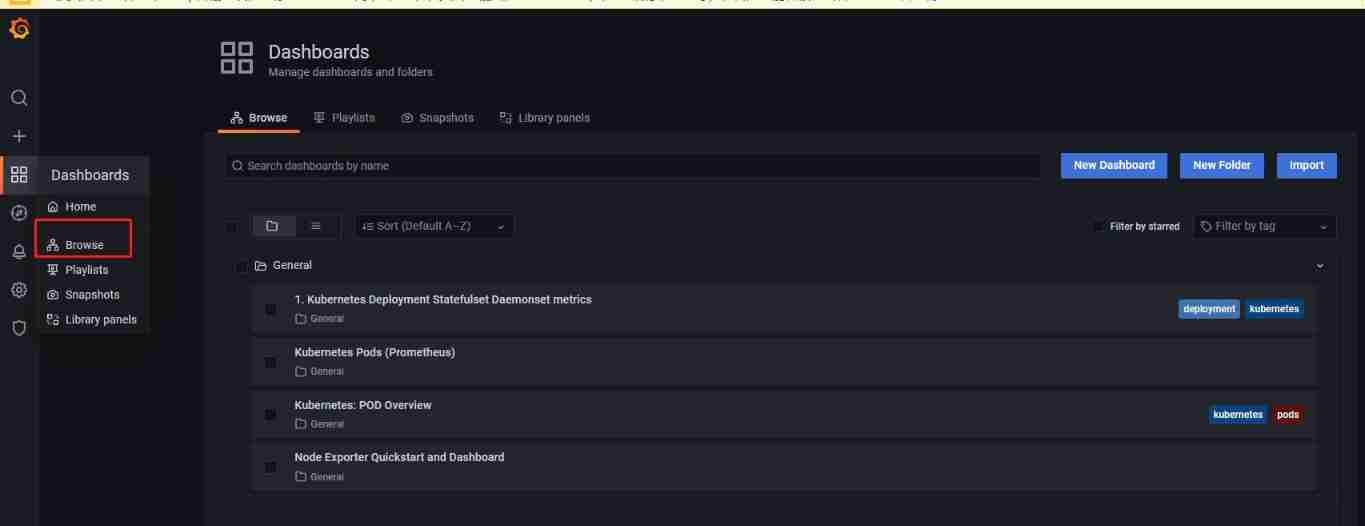
You can open it Browse , Continue importing more templates , Then view the template monitoring interface to be displayed .
How does the application access Prometheus and Grafana
The monitoring of infrastructure has been mentioned earlier , We can also use middleware such as TIDB、Mysql And so on 、 Collect indicator data , You can also customize the indicator data in the program , Then make it yourself Grafana Templates . If you are .NET Development , You can also refer to another article of the author to understand these processes step by step :https://www.cnblogs.com/whuanle/p/14969982.html
The alarm
In the monitoring system , Alarm is the top priority , Generally, it is necessary to develop alarm processing and push notification components according to the actual situation of the company .
We suggest you read be based on Rob Ewaschuk stay Google Of observation My alarm Philosophy https://docs.google.com/a/boxever.com/document/d/199PqyG3UsyXlwieHaqbGiWVa8eMWi8zzAn0YfcApr8Q/edit
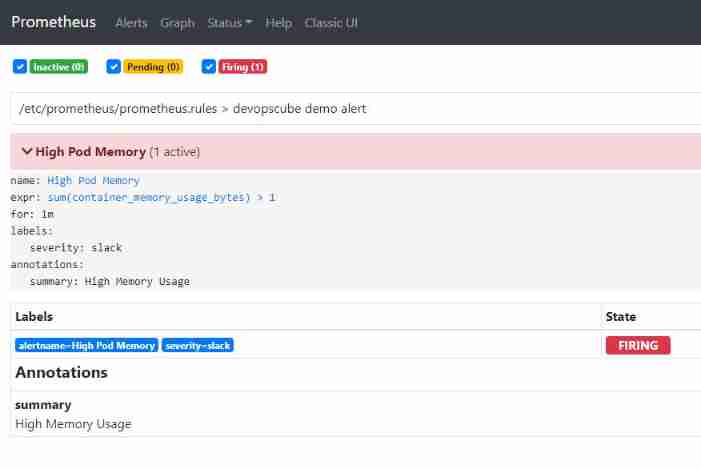
Deploy in the front Prometheus when ,config-map.yaml An alarm rule has been defined .
  prometheus.rules: |-
    groups:
    - name: devopscube demo alert
      rules:
      - alert: High Pod Memory
        expr: sum(container_memory_usage_bytes) > 1
        for: 1m
        labels:
          severity: slack
        annotations:
          summary: High Memory Usage
An alarm rule is mainly composed of the following parts :
- alert: Name of alarm rule .
- expr: be based on PromQL Expression alarm trigger condition , It is used to calculate whether a time series satisfies the condition .
- for: Evaluate the waiting time , Optional parameters . It is used to indicate that the alarm will be sent only after the trigger condition lasts for a period of time . The status of the newly generated alarm during the waiting period is pending.
- labels: Custom tag , Allows the user to specify a set of additional labels to be attached to the alarm .
- annotations: Used to specify a set of additional information , For example, the text used to describe the alarm details ,annotations When the alarm is generated, the contents of will be sent to as parameters Alertmanager.
May refer to :https://yunlzheng.gitbook.io/prometheus-book/parti-prometheus-ji-chu/alert/prometheus-alert-rule
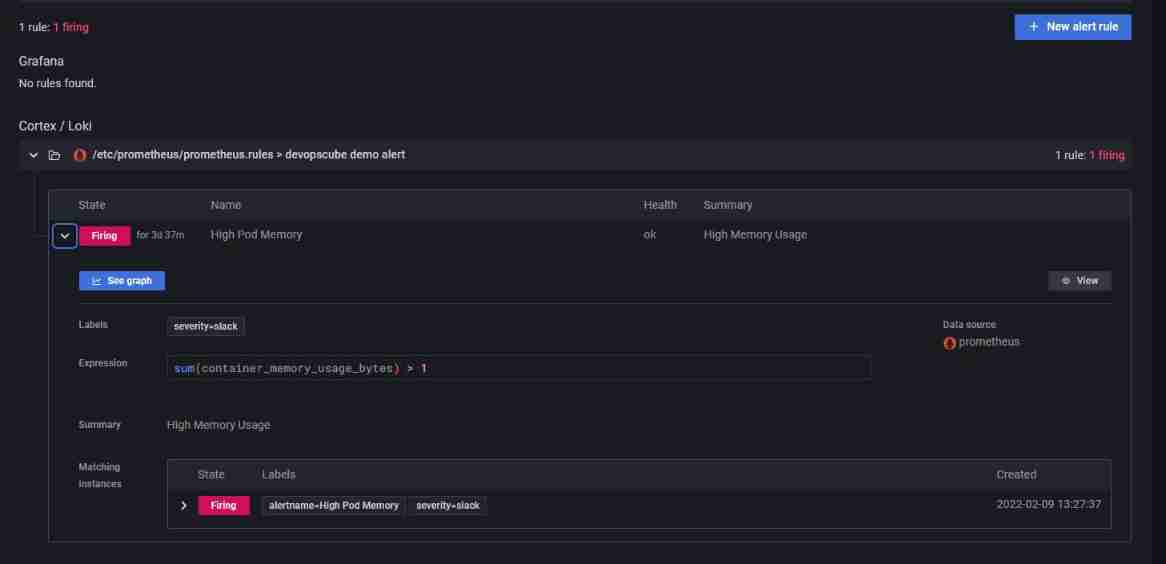
stay Grafana You can also see this rule in .
Let's configure alarm notification in the future .
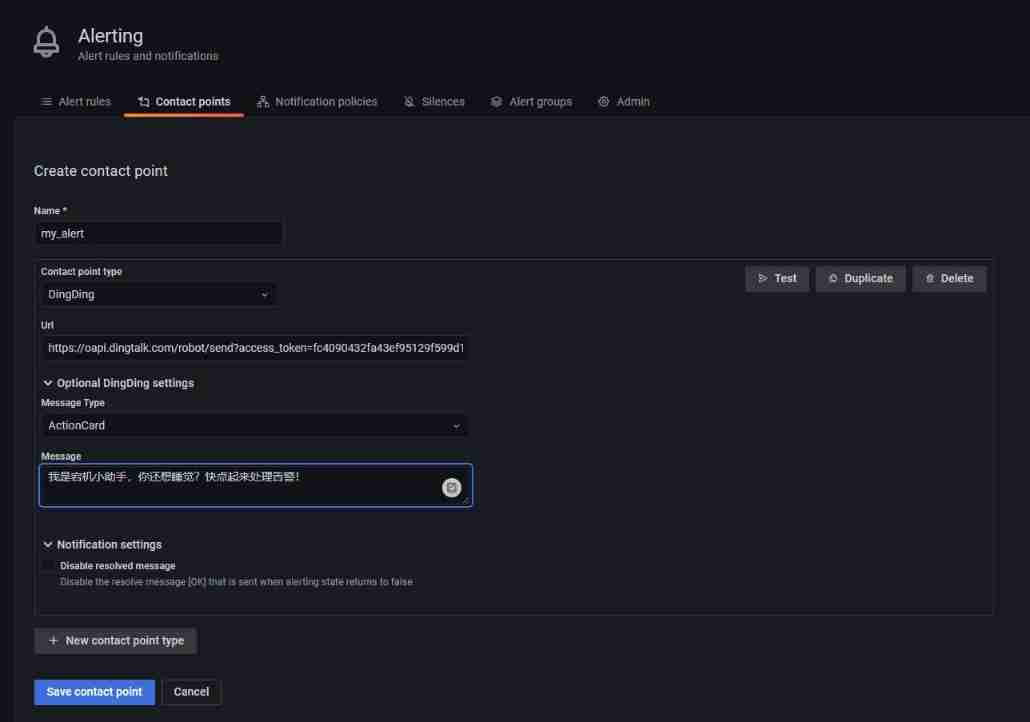
First, create an alarm contact , The author used nails Webhook.
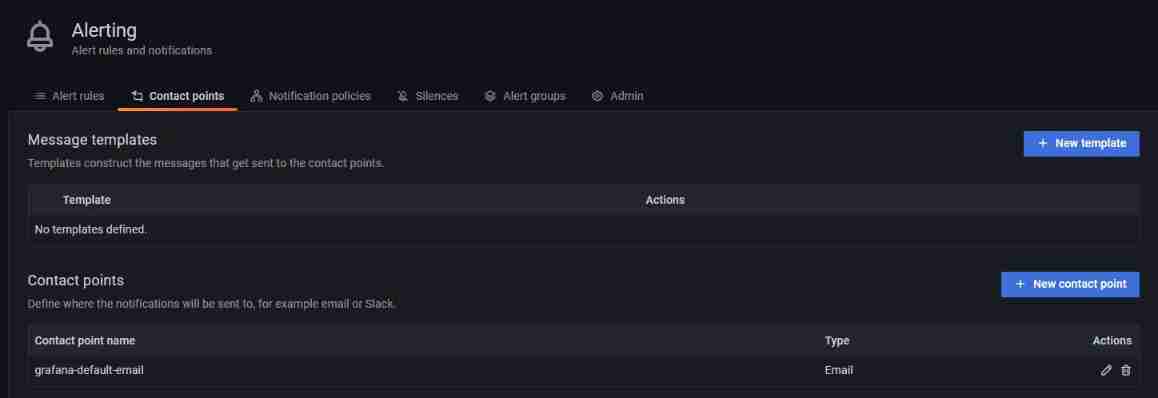
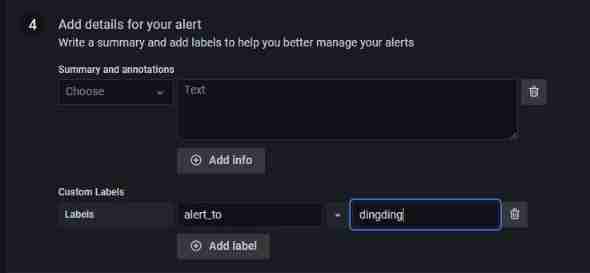
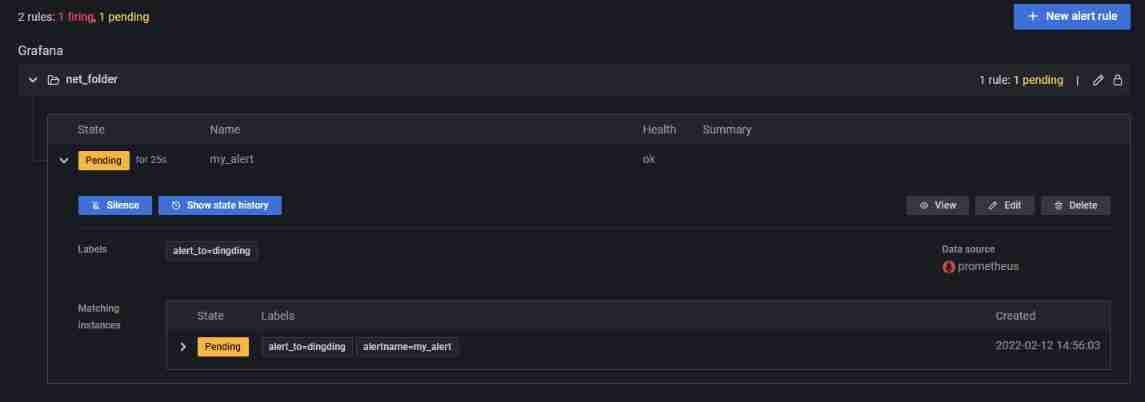
And find Alert Rules, Add a new alarm rule .
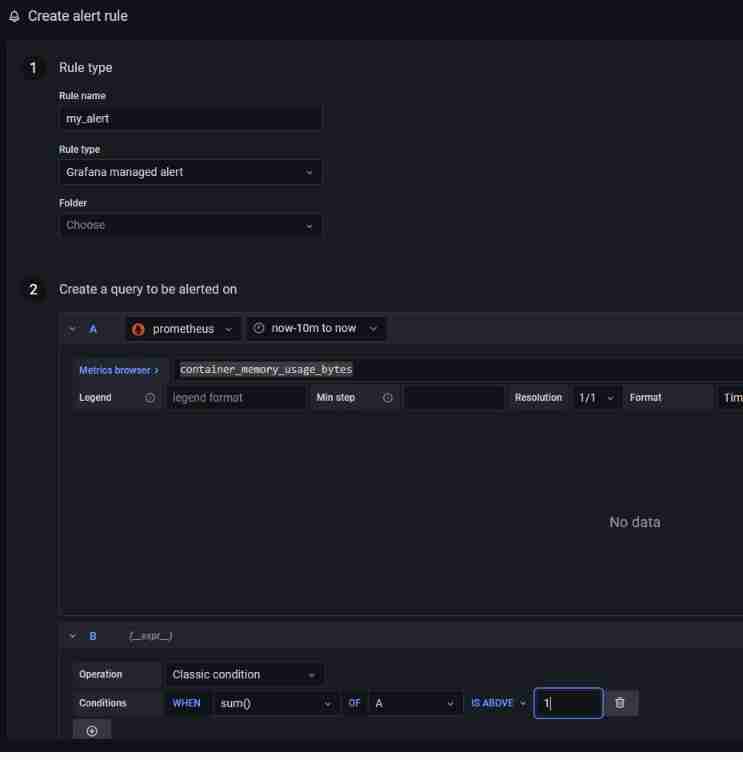
Please refer to... For alarm rules :https://grafana.com/docs/grafana/latest/alerting/unified-alerting/alerting-rules/create-grafana-managed-rule/
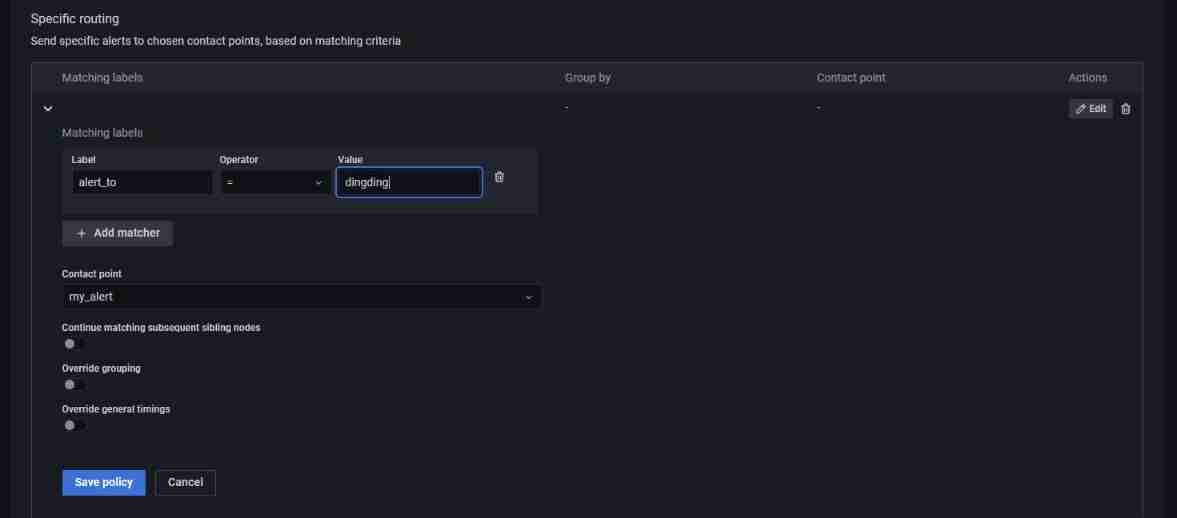
Then open Notification policies, Bind the alarm rules and contact information , The qualified alarm information will be pushed to the specified contact information .
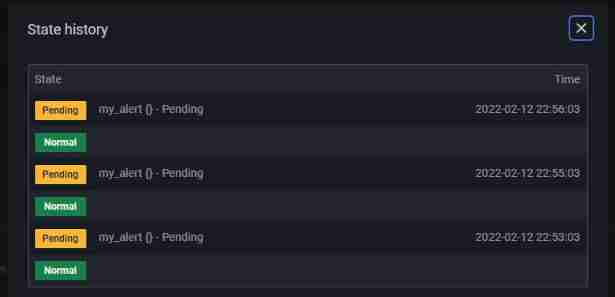
stay Alert Rules You can see the push record of alarm information in . Because the author's server is abroad , The nail of the server may not be used Webhook function , So here has been Pending, Therefore, the author will not try too much here , The reader can understand the general steps .

![Hmi-30- [motion mode] the module on the right side of the instrument starts to write](/img/6b/09bb8fd95b707a459534eaeb72eb59.jpg)

![[200 opencv routines] 99 Modified alpha mean filter](/img/df/1b7beb6746f416198fc405249852f8.jpg)