当前位置:网站首页>嵌入式C语言程序调试和宏使用的技巧
嵌入式C语言程序调试和宏使用的技巧
2022-07-07 16:19:00 【罗汉翔】


原文链接:嵌入式C语言程序调试和宏使用的技巧
1. 调试相关的宏
在Linux使用gcc编译程序的时候,对于调试的语句还具有一些特殊的语法。gcc编译的过程中,会生成一些宏,可以使用这些宏分别打印当前源文件的信息,主要内容是当前的文件、当前运行的函数和当前的程序行。
具体宏如下
__FILE__  当前程序源文件 (char*)
__FUNCTION__  当前运行的函数 (char*)
__LINE__  当前的函数行 (int)
:这些宏不是程序代码定义的,而是有编译器产生的。这些信息都是在编译器处理文件的时候动态产生的。
测试示例:
#include <stdio.h>

int main(void)
{
    printf("file: %s\n", __FILE__);
    printf("function: %s\n", __FUNCTION__);
    printf("line: %d\n", __LINE__);

    return 0;
}
2. # 字符串化操作符
在gcc的编译系统中,可以使用#将当前的内容转换成字符串。
程序示例:
#include <stdio.h>

#define DPRINT(expr) printf("<main>%s = %d\n", #expr, expr);

int main(void)
{
    int x = 3;
    int y = 5;

    DPRINT(x / y);
    DPRINT(x + y);
    DPRINT(x * y);

    return 0;
}
执行结果:
[email protected]:~/tmp$ gcc test.c
[email protected]:~/tmp$ ./a.out
<main>x / y = 0
<main>x + y = 8
<main>x * y = 15
#expr表示根据宏中的参数(即表达式的内容),生成一个字符串。该过程同样是有编译器产生的,编译器在编译源文件的时候,如果遇到了类似的宏,会自动根据程序中表达式的内容,生成一个字符串的宏。
这种方式的优点是可以用统一的方法打印表达式的内容,在程序的调试过程中可以方便直观的看到转换字符串之后的表达式。具体的表达式的内容是什么,有编译器自动写入程序中,这样使用相同的宏打印所有表达式的字符串。
//打印字符
#define debugc(expr) printf("<char> %s = %c\n", #expr, expr)
//打印浮点数
#define debugf(expr) printf("<float> %s = %f\n", #expr, expr)
//按照16进制打印整数
#define debugx(expr) printf("<int> %s = 0X%x\n", #expr, expr);
由于#expr本质上市一个表示字符串的宏,因此在程序中也可以不适用%s打印它的内容,而是可以将其直接与其它的字符串连接。因此,上述宏可以等价以下形式:
//打印字符
#define debugc(expr) printf("<char> #expr = %c\n", expr)
//打印浮点数
#define debugf(expr) printf("<float> #expr = %f\n", expr)
//按照16进制打印整数
#define debugx(expr) printf("<int> #expr = 0X%x\n", expr);
总结:
#是C语言预处理阶段的字符串化操作符,可将宏中的内容转换成字符串。
3. ## 连接操作符
在gcc的编译系统中,##是C语言中的连接操作符,可以在编译的预处理阶段实现字符串连接的操作。
程序示例:
#include <stdio.h>

#define test(x) test##x

void test1(int a)
{
    printf("test1 a = %d\n", a);
}

void test2(char *s)
{
    printf("test2 s = %s\n", s);
}

int main(void)
{
    test(1)(100);

    test(2)("hello world");

    return 0;
}
上述程序中,test(x)宏被定义为test##x, 他表示test字符串和x字符串的连接。
在程序的调试语句中,##常用的方式如下
#define DEBUG(fmt, args...) printf(fmt, ##args)替换的方式是将参数的两个部分以##连接。##表示连接变量代表前面的参数列表。使用这种形式可以将宏的参数传递给一个参数。args…是宏的参数,表示可变的参数列表,使用##args将其传给printf函数.
总结:
##是C语言预处理阶段的连接操作符,可实现宏参数的连接。
4. 调试宏第一种形式
一种定义的方式:
#define DEBUG(fmt, args...)             \
    {                                   \
    printf("file:%s function: %s line: %d ", __FILE__, __FUNCTION__, __LINE__);\
    printf(fmt, ##args);                \
    }
程序示例:
#include <stdio.h>

#define DEBUG(fmt, args...)             \
    {                                   \
    printf("file:%s function: %s line: %d ", __FILE__, __FUNCTION__, __LINE__);\
    printf(fmt, ##args);                \
    }


int main(void)
{
    int a = 100;
    int b = 200;

    char *s = "hello world";
    DEBUG("a = %d b = %d\n", a, b);
    DEBUG("a = %x b = %x\n", a, b);
    DEBUG("s = %s\n", s);

    return 0;
}
总结:
上面的DEBUG定义的方式是两条语句的组合,不可能在产生返回值,因此不能使用它的返回值。
5. 调试宏的第二种定义方式
调试宏的第二种定义方式
#define DEBUG(fmt, args...)             \
    printf("file:%s function: %s line: %d "fmt, \
    __FILE__, __FUNCTION__, __LINE__, ##args)
程序示例
#include <stdio.h>

#define DEBUG(fmt, args...)             \
    printf("file:%s function: %s line: %d "fmt, \
    __FILE__, __FUNCTION__, __LINE__, ##args)


int main(void)
{
    int a = 100;
    int b = 200;

    char *s = "hello world";
    DEBUG("a = %d b = %d\n", a, b);
    DEBUG("a = %x b = %x\n", a, b);
    DEBUG("s = %s\n", s);

    return 0;
}
总结:
fmt必须是一个字符串,不能使用指针,只有这样才可以实现字符串的功能。
6. 对调试语句进行分级审查
即使定义了调试的宏,在工程足够大的情况下,也会导致在打开宏开关的时候在终端出现大量的信息。而无法区分哪些是有用的。这个时候就要加入分级检查机制,可以定义不同的调试级别,这样就可以对不同重要程序和不同的模块进行区分,需要调试哪一个模块就可以打开那一个模块的调试级别。
一般可以利用配置文件的方式显示,其实Linux内核也是这么做的,它把调试的等级分成了7个不同重要程度的级别,只有设定某个级别可以显示,对应的调试信息才会打印到终端上。
可以写出一下配置文件
[debug]
debug_level=XXX_MODULE
解析配置文件使用标准的字符串操作库函数就可以获取XXX_MODULE这个数值。
int show_debug(int level)
{
    if (level == XXX_MODULE)
    {
        #define DEBUG(fmt, args...)             \
        printf("file:%s function: %s line: %d "fmt, \
        __FILE__, __FUNCTION__, __LINE__, ##args)
    }
    else if (...)
    {
        ....
    }
}
7. 条件编译调试语句
在实际的开发中,一般会维护两种源程序,一种是带有调试语句的调试版本程序,另外一种是不带有调试语句的发布版本程序。然后根据不同的条件编译选项,编译出不同的调试版本和发布版本的程序。
在实现过程中,可以使用一个调试宏来控制调试语句的开关。
#ifdef USE_DEBUG
        #define DEBUG(fmt, args...)             \
        printf("file:%s function: %s line: %d "fmt, \
        __FILE__, __FUNCTION__, __LINE__, ##args)
#else
  #define DEBUG(fmt, args...)

#endif
如果USE_DEBUG被定义,那么有调试信息,否则DEBUG就为空。
如果需要调试信息,就只需要在程序中更改一行就可以了。
#define USE_DEBUG
#undef USE_DEBUG
定义条件编译的方式使用一个带有值的宏
#if USE_DEBUG
        #define DEBUG(fmt, args...)             \
        printf("file:%s function: %s line: %d "fmt, \
        __FILE__, __FUNCTION__, __LINE__, ##args)
#else
  #define DEBUG(fmt, args...)

#endif
可以使用如下方式进行条件编译
#ifndef USE_DEBUG
#define USE_DEBUG 0
#endif
8. 使用do…while的宏定义
使用宏定义可以将一些较为短小的功能封装,方便使用。宏的形式和函数类似,但是可以节省函数跳转的开销。如何将一个语句封装成一个宏,在程序中常常使用do…while(0)的形式。
#define HELLO(str) do { \
printf("hello: %s\n", str); \
}while(0)
程序示例:
int cond = 1;
if (cond)
    HELLO("true");
else
    HELLO("false");
9. 代码剖析
对于比较大的程序,可以借助一些工具来首先把需要优化的点清理出来。接下来我们来看看在程序执行过程中获取数据并进行分析的工具:代码剖析程序。
测试程序:
#include <stdio.h>


#define T 100000

void call_one()
{
    int count = T * 1000;
    while(count--);
}

void call_two()
{
    int count = T * 50;
    while(count--);
}

void call_three()
{
    int count = T * 20;
    while(count--);
}


int main(void)
{
    int time = 10;

    while(time--)
    {
        call_one();
        call_two();
        call_three();
    }

    return 0;
}
编译的时候加入-pg选项:
[email protected]:~/tmp$ gcc -pg test.c -o test
执行完成后,在当前文件中生成了一个gmon.out文件。
[email protected]cast:~/tmp$ ./test
[email protected]:~/tmp$ ls
gmon.out  test  test.c
[email protected]:~/tmp$
使用gprof剖析主程序:
[email protected]:~/tmp$ gprof test
Flat profile:

Each sample counts as 0.01 seconds.
  %   cumulative   self              self     total
 time   seconds   seconds    calls  ms/call  ms/call  name
 95.64      1.61     1.61       10   160.68   160.68  call_one
  3.63      1.67     0.06       10     6.10     6.10  call_two
  2.42      1.71     0.04       10     4.07     4.07  call_three
其中主要的信息有两个,一个是每个函数执行的时间占程序总时间的百分比,另外一个就是函数被调用的次数。通过这些信息,可以优化核心程序的实现方式来提高效率。
当然这个剖析程序由于它自身特性有一些限制,比较适用于运行时间比较长的程序,因为统计的时间是基于间隔计数这种机制,所以还需要考虑函数执行的相对时间,如果程序执行时间过短,那得到的信息是没有任何参考意义的。
将上诉程序时间缩短:
#include <stdio.h>


#define T 100

void call_one()
{
    int count = T * 1000;
    while(count--);
}

void call_two()
{
    int count = T * 50;
    while(count--);
}

void call_three()
{
    int count = T * 20;
    while(count--);
}


int main(void)
{
    int time = 10;

    while(time--)
    {
        call_one();
        call_two();
        call_three();
    }

    return 0;
}
剖析结果如下:
[email protected]:~/tmp$ gcc -pg test.c -o test
[email protected]:~/tmp$ ./test
[email protected]:~/tmp$ gprof test
Flat profile:

Each sample counts as 0.01 seconds.
 no time accumulated

  %   cumulative   self              self     total
 time   seconds   seconds    calls  Ts/call  Ts/call  name
  0.00      0.00     0.00       10     0.00     0.00  call_one
  0.00      0.00     0.00       10     0.00     0.00  call_three
  0.00      0.00     0.00       10     0.00     0.00  call_two
因此该剖析程序对于越复杂、执行时间越长的函数也适用。
那么是不是每个函数执行的绝对时间越长,剖析显示的时间就真的越长呢?可以再看如下的例子
#include <stdio.h>


#define T 100

void call_one()
{
    int count = T * 1000;
    while(count--);
}

void call_two()
{
    int count = T * 100000;
    while(count--);
}

void call_three()
{
    int count = T * 20;
    while(count--);
}


int main(void)
{
    int time = 10;

    while(time--)
    {
        call_one();
        call_two();
        call_three();
    }

    return 0;
}
剖析结果如下:
[email protected]:~/tmp$ gcc -pg test.c -o test
[email protected]:~/tmp$ ./test
[email protected]:~/tmp$ gprof test
Flat profile:

Each sample counts as 0.01 seconds.
  %   cumulative   self              self     total
 time   seconds   seconds    calls  ms/call  ms/call  name
101.69      0.15     0.15       10    15.25    15.25  call_two
  0.00      0.15     0.00       10     0.00     0.00  call_one
  0.00      0.15     0.00       10     0.00     0.00  call_three
总结:
在使用gprof工具的时候,对于一个函数进行gprof方式的剖析,实质上的时间是指除去库函数调用和系统调用之外,纯碎应用部分开发的实际代码运行的时间。
也就是说,time一项描述的时间值不包括库函数printf、系统调用system等运行的时间。这些实用库函数的程序虽然运行的时候,将比最初的程序实用更多的时间,但是对于剖析函数来说并没有影响。
边栏推荐
- Chapter 3 business function development (user login)
- Tips for this week 134: make_ Unique and private constructors
- debian10编译安装mysql
- golang 客户端服务端登录
- 现在网上期货开户安全吗?国内有多少家正规的期货公司?
- Hash, bitmap and bloom filter for mass data De duplication
- zdog. JS rocket turn animation JS special effects
- mui侧边导航锚点定位js特效
- 通过 Play Integrity API 的 nonce 字段提高应用安全性
- Self made dataset in pytoch for dataset rewriting
猜你喜欢

三仙归洞js小游戏源码

Performance test process and plan
自动化测试:Robot FrameWork框架大家都想知道的实用技巧

Mobile app takeout ordering personal center page

做软件测试 掌握哪些技术才能算作 “ 测试高手 ”?
Mui side navigation anchor positioning JS special effect
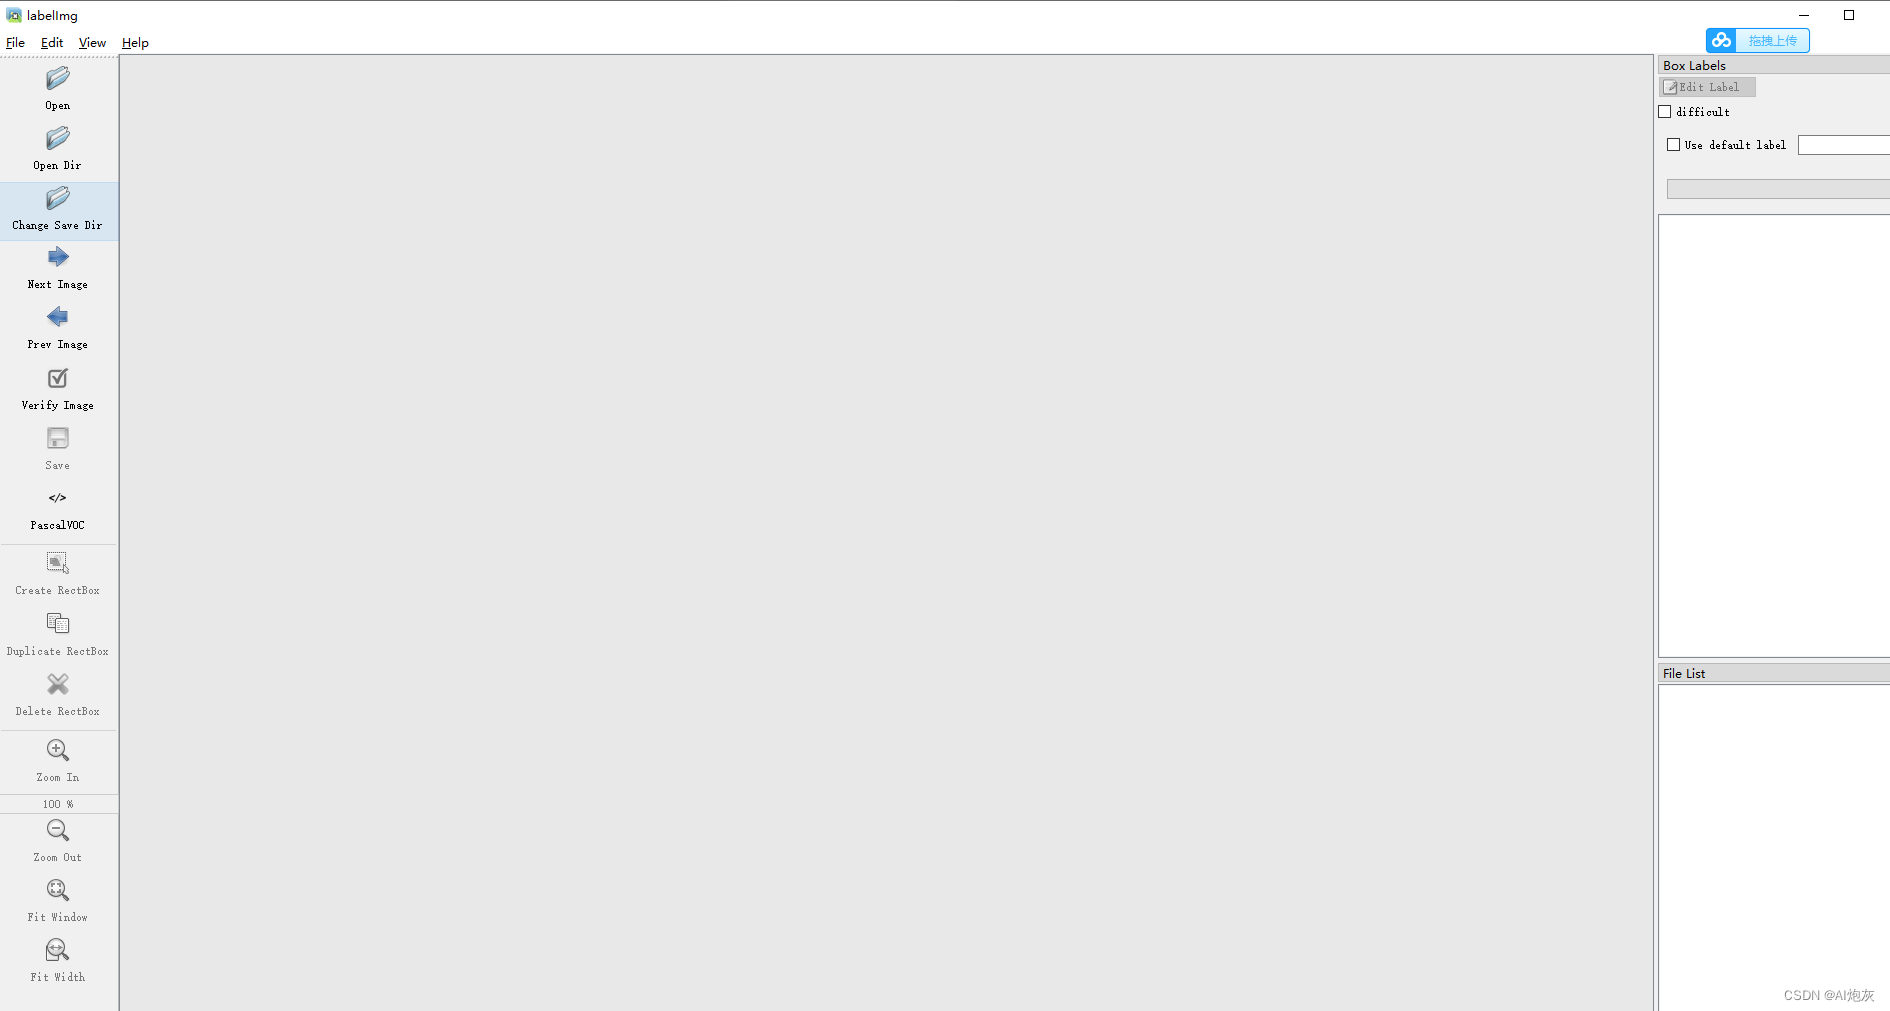
Target detection 1 -- actual operation of Yolo data annotation and script for converting XML to TXT file
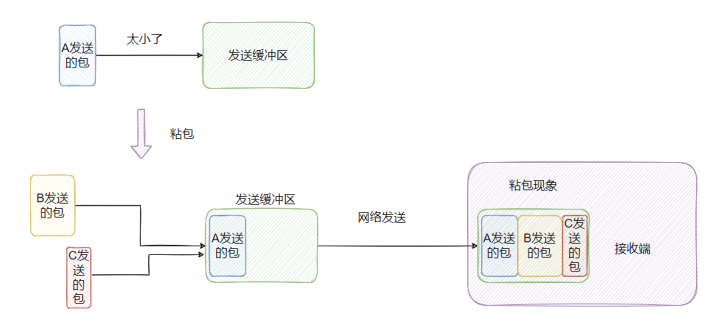
你真的理解粘包与半包吗?3分钟搞懂它
【4500字归纳总结】一名软件测试工程师需要掌握的技能大全
Debian10 compile and install MySQL
随机推荐
[OKR target management] value analysis
The report of the state of world food security and nutrition was released: the number of hungry people in the world increased to 828million in 2021
Cartoon | who is the first ide in the universe?
保证接口数据安全的10种方案
< code random recording two brushes> linked list
Yearning-SQL审核平台
[deep learning] 3 minutes introduction
JS pull down the curtain JS special effect display layer
4种常见的缓存模式,你都知道吗?
swiper左右切换滑块插件
SD_DATA_RECEIVE_SHIFT_REGISTER
2022年理财产品的一般收益率是多少?
Chapter 3 business function development (user access project)
[OKR target management] case analysis
Five simple ways to troubleshoot with Stace
How to clean when win11 C disk is full? Win11 method of cleaning C disk
Classification of regression tests
Understanding of 12 methods of enterprise management
PIP related commands
Personal best practice demo sharing of enum + validation