当前位置:网站首页>Lecture 3 Gradient Tutorial Gradient Descent and Stochastic Gradient Descent
Lecture 3 Gradient Tutorial Gradient Descent and Stochastic Gradient Descent
2022-08-05 05:24:00 【A long way to go】
Gradient Tutorial
The main difference between the gradient descent algorithm and the stochastic gradient descent algorithm is that:
- The loss function of the gradient descent algorithm is cost函数 ,cost是计算所有训练数据的损失
- The loss function of the stochastic gradient descent algorithm is loss函数,loss是计算一个训练函数的损失
- 由于随机梯度下降no need for reconciliation,Therefore, the loss function and gradient update can be reducedfor循环部分
梯度下降
Gradient descent loss function formula: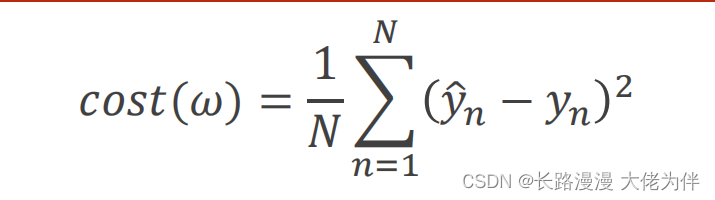
梯度公式: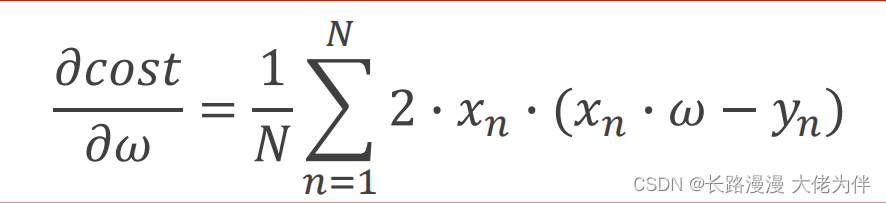
梯度下降算法(cost函数)
算法代码:
import matplotlib.pyplot as plt

# 准备x,y的数据
x_data = [1.0, 2.0, 3.0]
y_data = [2.0, 4.0, 6.0]

# 猜测初始权重
w = 1.0

#定义学习率,This is a hyperparameter,Manual definition is required
learning_rate=0.05

# 前馈计算
def forward(x):
    return x * w


# 计算平均损失函数
# Because of the need for reconciliation,所以需要将x,yTake in the entire dataset
def cost(xs, ys):
    cost = 0
    #使用zipfunctions are extracted separatelyx,y
    for x, y in zip(xs, ys):
        y_pred = forward(x)
        cost += (y_pred - y) ** 2
    return cost / len(xs)


# 计算梯度,Also sum and average
def gradient(xs, ys):
    grad = 0
    for x, y in zip(xs, ys):
        grad += 2 * x * (x * w - y)
    return grad / len(xs)


epoch_list = []
cost_list = []
print('predict (before training)', 4, forward(4))

#更新梯度
for epoch in range(80):
    cost_val = cost(x_data, y_data)
    grad_val = gradient(x_data, y_data)
    w -= learning_rate * grad_val  # 0.01 learning rate
    print('epoch:', epoch, 'w=', w, 'loss=', cost_val)

    #Load the count and average loss into a list,for later drawing use
    epoch_list.append(epoch)
    cost_list.append(cost_val)

print('predict (after training)', 4, forward(4))

#画出cost与epoch的平面图
plt.plot(epoch_list, cost_list)
plt.ylabel('cost')
plt.xlabel('epoch')
plt.show()
结果如下:
predict (before training) 4 4.0
epoch: 0 w= 1.4666666666666668 loss= 4.666666666666667
epoch: 1 w= 1.7155555555555557 loss= 1.3274074074074067
epoch: 2 w= 1.8482962962962963 loss= 0.3775736625514398
epoch: 3 w= 1.9190913580246913 loss= 0.10739873068129853
epoch: 4 w= 1.9568487242798354 loss= 0.030548972282680543
epoch: 5 w= 1.976985986282579 loss= 0.008689485449295776
...................
epoch: 55 w= 1.9999999999999996 loss= 3.681350891031389e-30
epoch: 56 w= 1.9999999999999998 loss= 1.3805065841367707e-30
epoch: 57 w= 2.0 loss= 3.4512664603419266e-31
epoch: 58 w= 2.0 loss= 0.0
epoch: 59 w= 2.0 loss= 0.0
...................
epoch: 77 w= 2.0 loss= 0.0
epoch: 78 w= 2.0 loss= 0.0
epoch: 79 w= 2.0 loss= 0.0
predict (after training) 4 8.0
cost与epoch关系如图: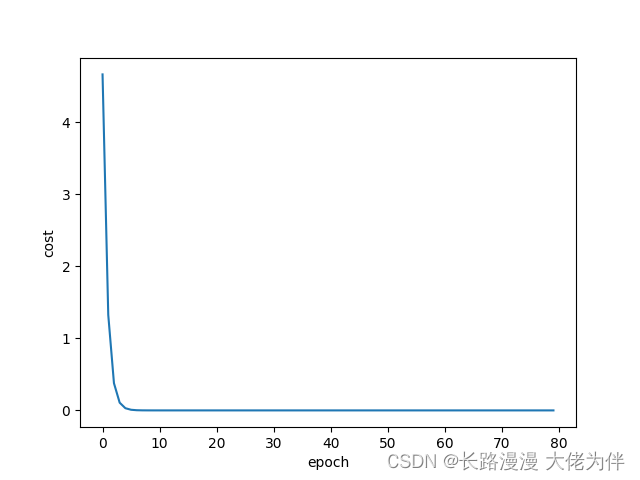
随机梯度下降
损失函数公式: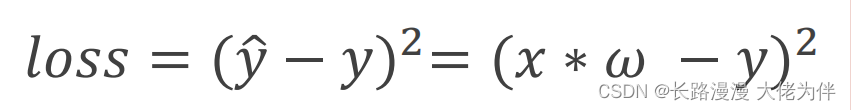
梯度公式: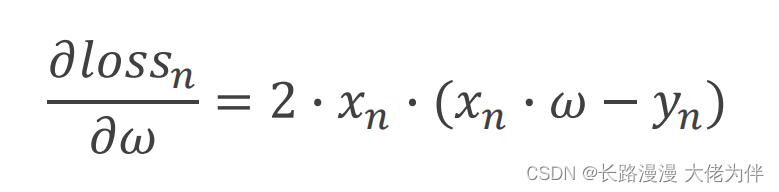
运行代码:
import matplotlib.pyplot as plt

# 准备x,y的数据
x_data = [1.0, 2.0, 3.0]
y_data = [2.0, 4.0, 6.0]

# 猜测初始权重
w = 1.0

#定义学习率,This is a hyperparameter,Manual definition is required
learning_rate=0.03

# 前馈计算
def forward(x):
    return x * w


# 计算损失函数
def loss(x, y):
    y_pred = forward(x)
    return (y_pred - y)**2


# 计算梯度,Also sum and average
def gradient(x, y):
    return 2*x*(x*w - y)


epoch_list = []
loss_list  = []
print('predict (before training)', 4, forward(4))

#更新梯度
for epoch in range(100):
    for x,y in zip(x_data, y_data):
        grad = gradient(x,y)
        w = w - learning_rate*grad    # update weight by every grad of sample of training set
        print("\tgrad:", x, y,grad)
        l = loss(x,y)
    print('epoch:', epoch, 'w=', w, 'loss=', l)

    #Load the count and average loss into a list,for later drawing use
    epoch_list.append(epoch)
    loss_list .append(l)

print('predict (after training)', 4, forward(4))

#画出cost与epoch的平面图
plt.plot(epoch_list, loss_list )
plt.ylabel('cost')
plt.xlabel('epoch')
plt.show()
predict (before training) 4 4.0
	grad: 1.0 2.0 -2.0
	grad: 2.0 4.0 -7.52
	grad: 3.0 6.0 -12.859199999999998
epoch: 0 w= 1.671376 loss= 0.9719436003840011
	grad: 1.0 2.0 -0.657248
	grad: 2.0 4.0 -2.4712524800000004
	grad: 3.0 6.0 -4.2258417408
epoch: 1 w= 1.8920062666239998 loss= 0.10496381803637934
	grad: 1.0 2.0 -0.2159874667520003
	grad: 2.0 4.0 -0.8121128749875215
	grad: 3.0 6.0 -1.3887130162286585
epoch: 2 w= 1.9645106673630452 loss= 0.011335434579147843
	grad: 1.0 2.0 -0.0709786652739095
	grad: 2.0 4.0 -0.26687978142989977
	grad: 3.0 6.0 -0.4563644262451305
epoch: 3 w= 1.9883373535515134 loss= 0.0012241558996415386
	grad: 1.0 2.0 -0.02332529289697316
	grad: 2.0 4.0 -0.08770310129261993
	grad: 3.0 6.0 -0.14997230321038302
...............
epoch: 31 w= 1.9999999999999996 loss= 3.1554436208840472e-30
	grad: 1.0 2.0 -8.881784197001252e-16
	grad: 2.0 4.0 -3.552713678800501e-15
	grad: 3.0 6.0 -1.0658141036401503e-14
epoch: 32 w= 1.9999999999999998 loss= 7.888609052210118e-31
	grad: 1.0 2.0 -4.440892098500626e-16
	grad: 2.0 4.0 -1.7763568394002505e-15
	grad: 3.0 6.0 -5.329070518200751e-15
epoch: 33 w= 2.0 loss= 0.0
	grad: 1.0 2.0 0.0
	grad: 2.0 4.0 0.0
	grad: 3.0 6.0 0.0
epoch: 34 w= 2.0 loss= 0.0
	grad: 1.0 2.0 0.0
	grad: 2.0 4.0 0.0
	grad: 3.0 6.0 0.0
epoch: 35 w= 2.0 loss= 0.0
	grad: 1.0 2.0 0.0
	grad: 2.0 4.0 0.0
	grad: 3.0 6.0 0.0
...............
epoch: 97 w= 2.0 loss= 0.0
	grad: 1.0 2.0 0.0
	grad: 2.0 4.0 0.0
	grad: 3.0 6.0 0.0
epoch: 98 w= 2.0 loss= 0.0
	grad: 1.0 2.0 0.0
	grad: 2.0 4.0 0.0
	grad: 3.0 6.0 0.0
epoch: 99 w= 2.0 loss= 0.0
predict (after training) 4 8.0
平面图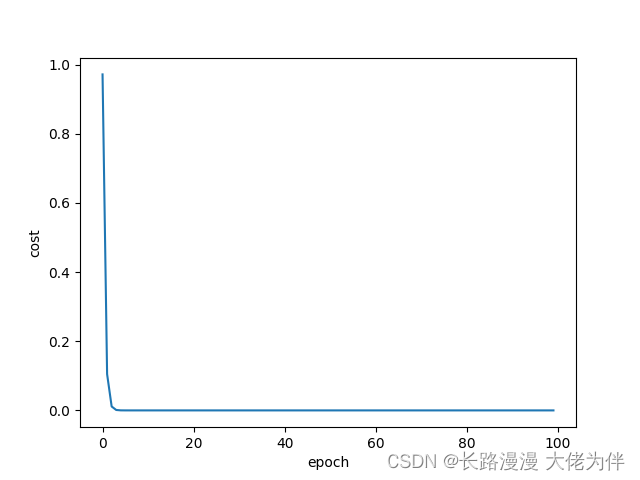
边栏推荐
- 学习总结day5
- JSX基础
- Algorithms - ones and zeros (Kotlin)
- 浅谈Servlet生命周期
- 有用番茄来监督自己的同道中人吗?加一下我的自习室,一起加油
- The difference between span tag and p
- Convert the paper official seal in the form of a photo into an electronic official seal (no need to download ps)
- 2022牛客多校第四场C.Easy Counting Problem(EGF+NTT)
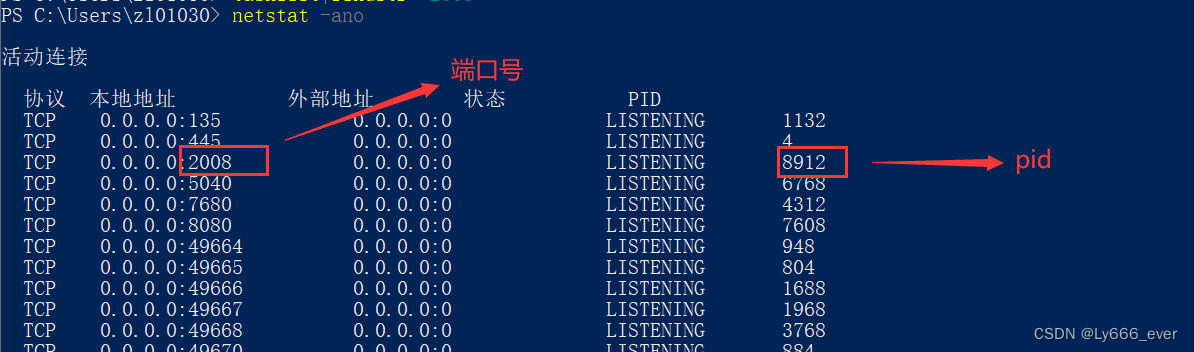
- 解决端口占用问题
- Mysql5.7 二进制 部署
猜你喜欢
![coppercam primer [6]](/img/d3/a7d44aa19acfb18c5a8cacdc8176e9.png)


随机推荐
ES6 Set、WeakSet
【读书】长期更新
【过一下15】学习 lstm的一周
range函数作用
Dashboard Display | DataEase Look at China: Data Presents China's Capital Market
uva1325
[Study Notes Dish Dog Learning C] Classic Written Exam Questions of Dynamic Memory Management
The underlying mechanism of the class
Do you use tomatoes to supervise your peers?Add my study room, come on together
学习总结week2_1
In Opencv, imag=cv2.cvtColor(imag,cv2.COLOR_BGR2GRAY) error: error:!_src.empty() in function 'cv::cvtColor'
Matplotlib(一)—— 基础
第四讲 back propagation 反向传播
Returned object not currently part of this pool
Reverse theory knowledge 4
第二讲 Linear Model 线性模型
Transformation 和 Action 常用算子
开发一套高容错分布式系统
Lecture 2 Linear Model Linear Model
Algorithms - ones and zeros (Kotlin)