当前位置:网站首页>Confusion matrix
Confusion matrix
2022-07-05 08:59:00 【Wanderer001】
Reference resources Confusion matrix (Confusion Matrix) - cloud + Community - Tencent cloud
brief introduction
The confusion matrix is ROC The basis of curve drawing , At the same time, it is also the most basic method to measure the accuracy of classification model , Most intuitive , The simplest way to calculate .
Explain the version in one sentence :
The confusion matrix is the error classification of the statistical classification model , The number of observations classified into pairs , Then show the results in a table . This table is the confusion matrix .
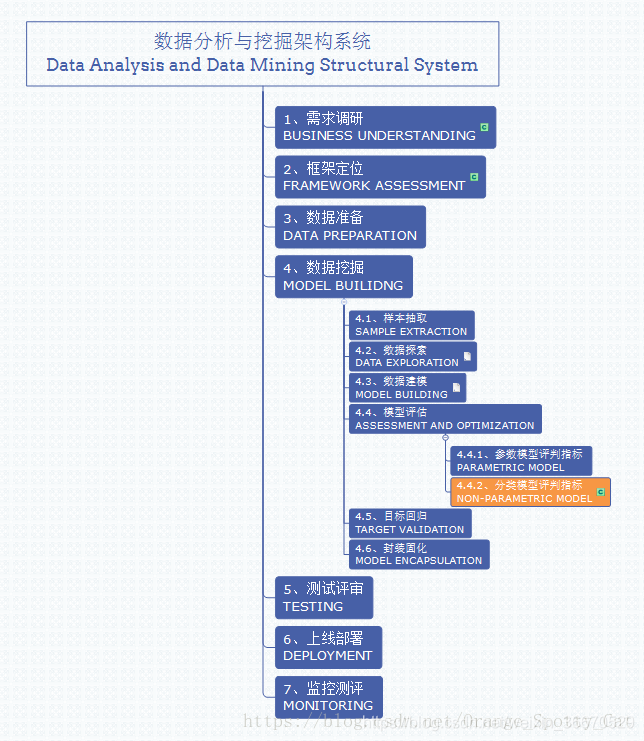
Data analysis and mining system location
Confusion matrix is the index to judge the results of the model , Part of the model evaluation . Besides , Confusion matrix is often used to judge classifiers (Classifier) The advantages and disadvantages of , It is applicable to the data model of different types , Such as classification tree (Classification Tree)、 Logical regression (Logistic Regression)、 Linear discriminant analysis (Linear Discriminant Analysis) Other methods .
In the evaluation index of classification model , There are three common methods :
- Confusion matrix ( Also known as error matrix ,Confusion Matrix)
- ROC curve
- AUC area
This article mainly introduces the first method , Confusion matrix , Also known as error matrix .
The position of this method in the whole data analysis and mining system is shown in the figure below .
Definition of confusion matrix
Definition of confusion matrix
Confusion matrix (Confusion Matrix), Its essence is far less popular than its name sounds . matrix , It can be understood as a table , The confusion matrix is actually just a table .
Take the simplest binary classification in the classification model as an example , For this kind of problem , Our model ultimately needs to judge that the result of the sample is 0 still 1, Or rather, positive still negative.
We collect samples , Can directly know the real situation , What data results are positive, What are the results negative. meanwhile , We use the sample data to run out the results of the classification model , You can also know what the model thinks these data are positive, Which are negative.
therefore , We can get these four basic indicators , I call them primary indicators ( At the bottom of the ):
The real value is positive, The model considers that positive The number of (True Positive=TP)
The real value is positive, The model considers that negative The number of (False Negative=FN): This is the first type of statistical error (Type I Error)
The real value is negative, The model considers that positive The number of (False Positive=FP): This is the second type of statistical error (Type II Error)
The real value is negative, The model considers that negative The number of (True Negative=TN)
Present these four indicators together in the table , We can get such a matrix , We call it the confusion matrix (Confusion Matrix):
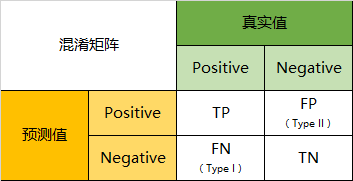
Index of confusion matrix
Predictive classification model , I must hope that the more accurate the better . that , Corresponding to the confusion matrix , That must be hope TP And TN A large number of , and FP And FN The number is small . So when we get the confusion matrix of the model , You need to see how many observations are in the second 、 The position corresponding to the four quadrants , The more values here, the better ; conversely , In the first place 、 The less the observed values in the corresponding positions of the three and four quadrants, the better .
Two level index
however , The confusion matrix counts numbers , Sometimes faced with a lot of data , Just count the numbers , It's hard to measure the quality of the model . Therefore, the confusion matrix extends the basic statistical results as follows 4 Indicators , I call them secondary indicators ( Obtained by adding, subtracting, multiplying and dividing the lowest index ):
Accuracy rate (Accuracy)—— For the whole model
Accuracy (Precision)
sensitivity (Sensitivity): It's the recall rate (Recall)
Specificity (Specificity)
I use tables to define these four indicators 、 Calculation 、 The understanding is summarized :
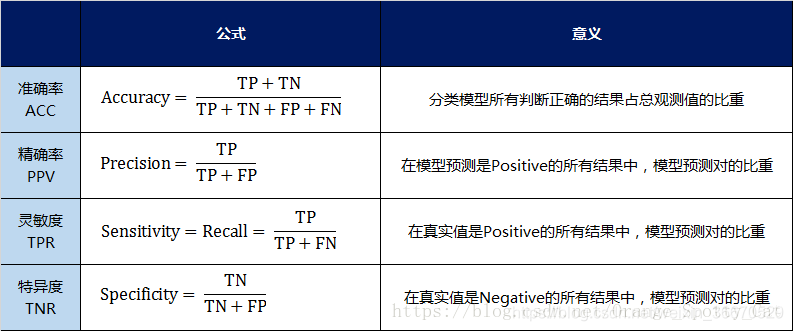
Through the above four secondary indicators , The result of the number in the confusion matrix can be transformed into 0-1 The ratio between . It's easy to make standardized measurements .
Expand on the basis of these four indicators , Another three-level indicator of the production order
Third level index
This indicator is called F1 Score. His formula is :
among ,P representative Precision,R representative Recall.
F1-Score The indicators synthesize Precision And Recall The result of the output .F1-Score The value range of is from 0 To 1 Of ,1 The output representing the model is the best ,0 The output of representative model is the worst .
Examples of confusion matrices
When the classification problem is dichotomous, the problem is , The confusion matrix can be calculated by the above method . When the results of classification are more than two , The confusion matrix also applies .
Take the following confusion matrix as an example , The purpose of our model is to predict what animals the sample is , This is our result :
Through the confusion matrix , We can draw the following conclusion :
Accuracy
In total 66 Of the animals , We're right in all 10 + 15 + 20=45 Samples , So the accuracy (Accuracy)=45/66 = 68.2%.
Take the cat for example , We can combine the above diagram into a bipartite problem :
Precision
therefore , Take the cat for example , The results of the model tell us ,66 There are... In the animals 13 It's just cats , But actually it's 13 The cat has only 10 Only the prediction is right . The model thinks it's a cat's 13 In an animal , Yes 1 A dog , Two pigs . therefore ,Precision( cat )= 10/13 = 76.9%
Recall
Take the cat for example , In total 18 A real cat , Our model thinks that there are only 10 It's just cats , The rest 3 Just a dog ,5 All pigs . this 5 Eighty percent of them are orange cats , Can understand . therefore ,Recall( cat )= 10/18 = 55.6%
Specificity
Take the cat for example , In total 48 Among animals that are not cats , According to the model, there are 45 It's not a cat . therefore ,Specificity( cat )= 45/48 = 93.8%.
Although in 45 In an animal , The model still thinks it's wrong 6 A dog and 4 Cats , But from a cat's point of view , There is nothing wrong with the judgment of the model .
( Here is the reference Wikipedia,Confusion Matrix The explanation of ,https://en.wikipedia.org/wiki/Confusion_matrix)
F1-Score
Through the formula , You can calculate that , For cats ,F1-Score=(2 * 0.769 * 0.556)/( 0.769 + 0.556) = 64.54%
Again , We can also calculate the secondary and tertiary index values of pigs and dogs respectively .
边栏推荐
- RT thread kernel quick start, kernel implementation and application development learning with notes
- One dimensional vector transpose point multiplication np dot
- Multiple linear regression (sklearn method)
- [daily training -- Tencent selected 50] 557 Reverse word III in string
- [beauty of algebra] singular value decomposition (SVD) and its application to linear least squares solution ax=b
- kubeadm系列-00-overview
- Dynamic dimensions required for input: input, but no shapes were provided. Automatically overriding
- [牛客网刷题 Day4] JZ35 复杂链表的复制
- asp. Net (c)
- Adaboost使用
猜你喜欢

IT冷知识(更新ing~)
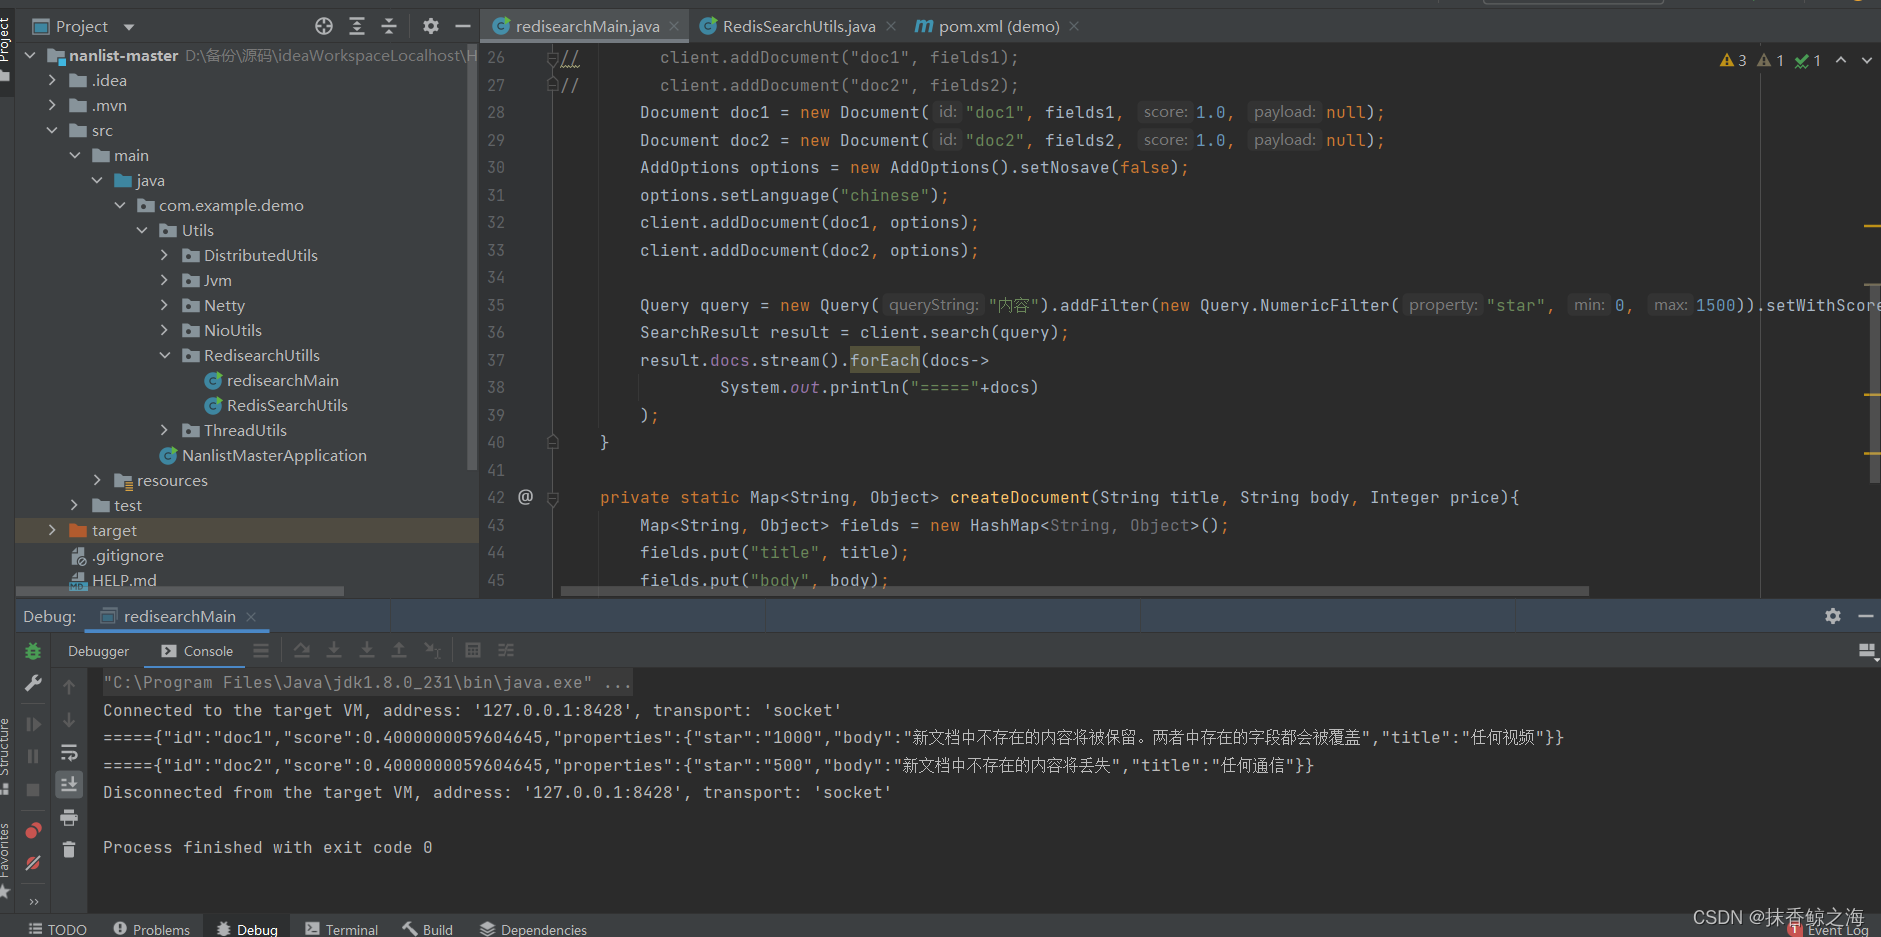
Redis实现高性能的全文搜索引擎---RediSearch
![Introduction Guide to stereo vision (5): dual camera calibration [no more collection, I charge ~]](/img/68/6bfa390b0bedcdbc4afba2f9bd9c0f.jpg)
Introduction Guide to stereo vision (5): dual camera calibration [no more collection, I charge ~]

Understanding rotation matrix R from the perspective of base transformation
Huber Loss
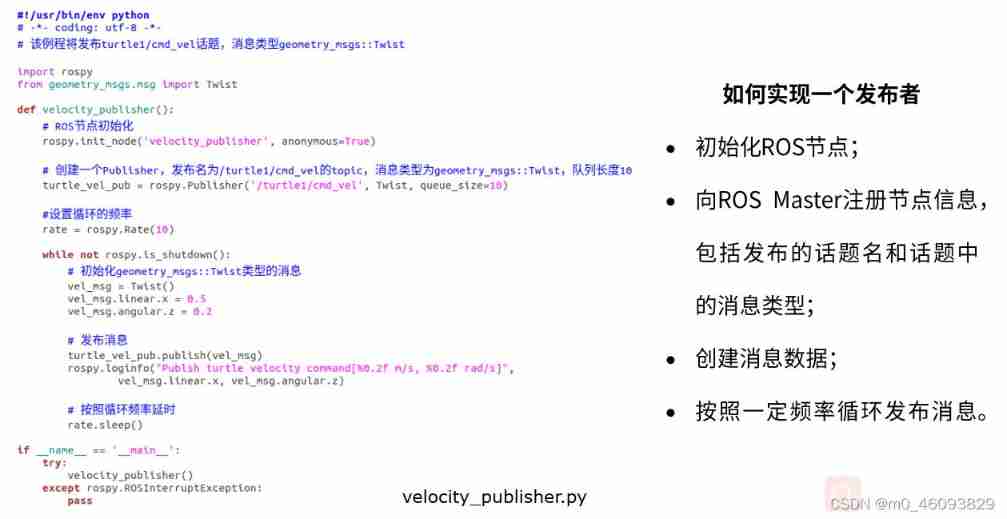
Programming implementation of ROS learning 2 publisher node

Halcon affine transformations to regions
![[牛客网刷题 Day4] JZ55 二叉树的深度](/img/f7/ca8ad43b8d9bf13df949b2f00f6d6c.png)
[牛客网刷题 Day4] JZ55 二叉树的深度
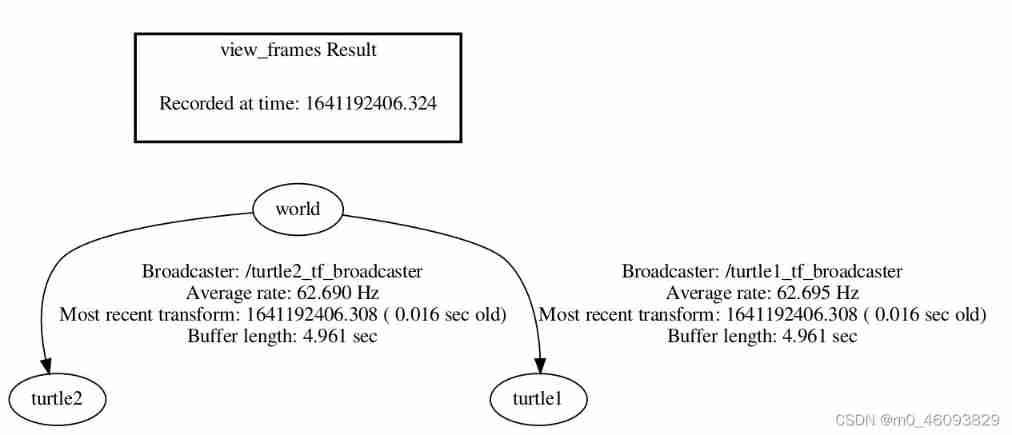
TF coordinate transformation of common components of ros-9 ROS

RT thread kernel quick start, kernel implementation and application development learning with notes
随机推荐
2011-11-21 training record personal training (III)
Jenkins Pipeline 方法(函数)定义及调用
Golang foundation - the time data inserted by golang into MySQL is inconsistent with the local time
多元线性回归(梯度下降法)
[code practice] [stereo matching series] Classic ad census: (5) scan line optimization
520 diamond Championship 7-4 7-7 solution
Codeforces Round #648 (Div. 2) E.Maximum Subsequence Value
kubeadm系列-02-kubelet的配置和启动
Codeworks round 681 (Div. 2) supplement
[code practice] [stereo matching series] Classic ad census: (4) cross domain cost aggregation
Add discount recharge and discount shadow ticket plug-ins to the resource realization applet
Attention is all you need
The combination of deep learning model and wet experiment is expected to be used for metabolic flux analysis
Halcon shape_ trans
c#比较两张图像的差异
Beautiful soup parsing and extracting data
Configuration and startup of kubedm series-02-kubelet
2311. 小于等于 K 的最长二进制子序列
Kubedm series-00-overview
Causes and appropriate analysis of possible errors in seq2seq code of "hands on learning in depth"