当前位置:网站首页>Kibana installation and configuration
Kibana installation and configuration
2022-07-05 01:22:00 【Fisher3652】
Catalog
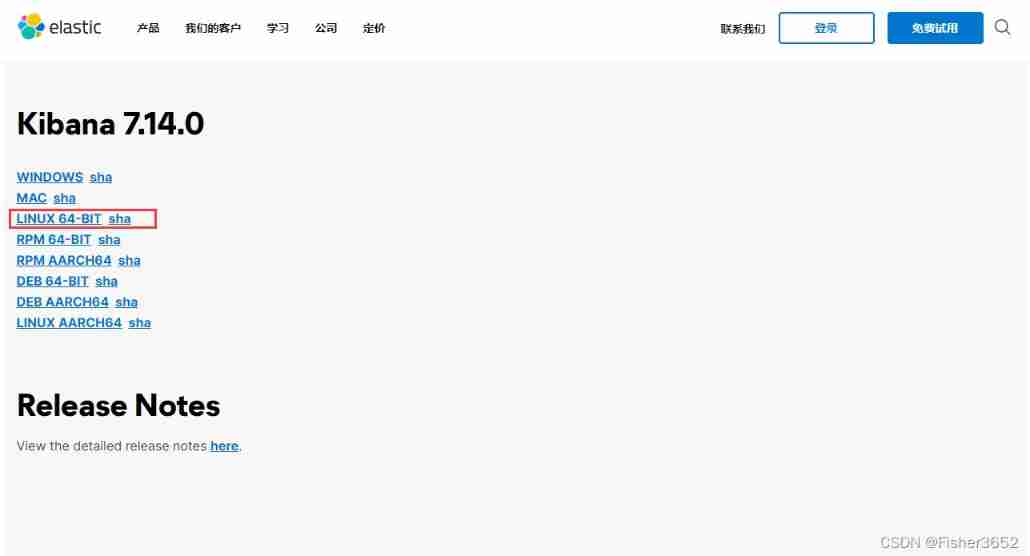
1. Download installation package
- Download address https://www.elastic.co/cn/downloads/past-releases#kibana
- Choose here 7.14.0,linux86 Bit version
2. Upload to server
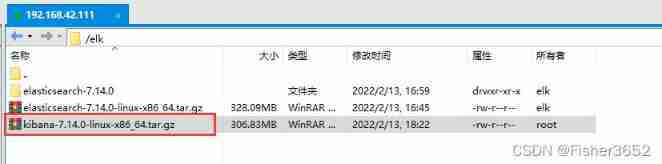
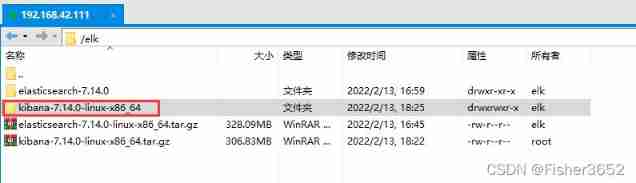
- decompression
tar -zxvf kibana-7.14.0-linux-x86_64.tar.gz
3. Create user
- Because I was installing elasticsearch when , User has been created elk, No more creation here , You can refer to Elasticsearch Installation and configuration , Also cannot be used root User start kibana
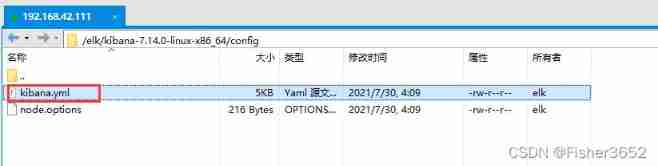
4. To configure
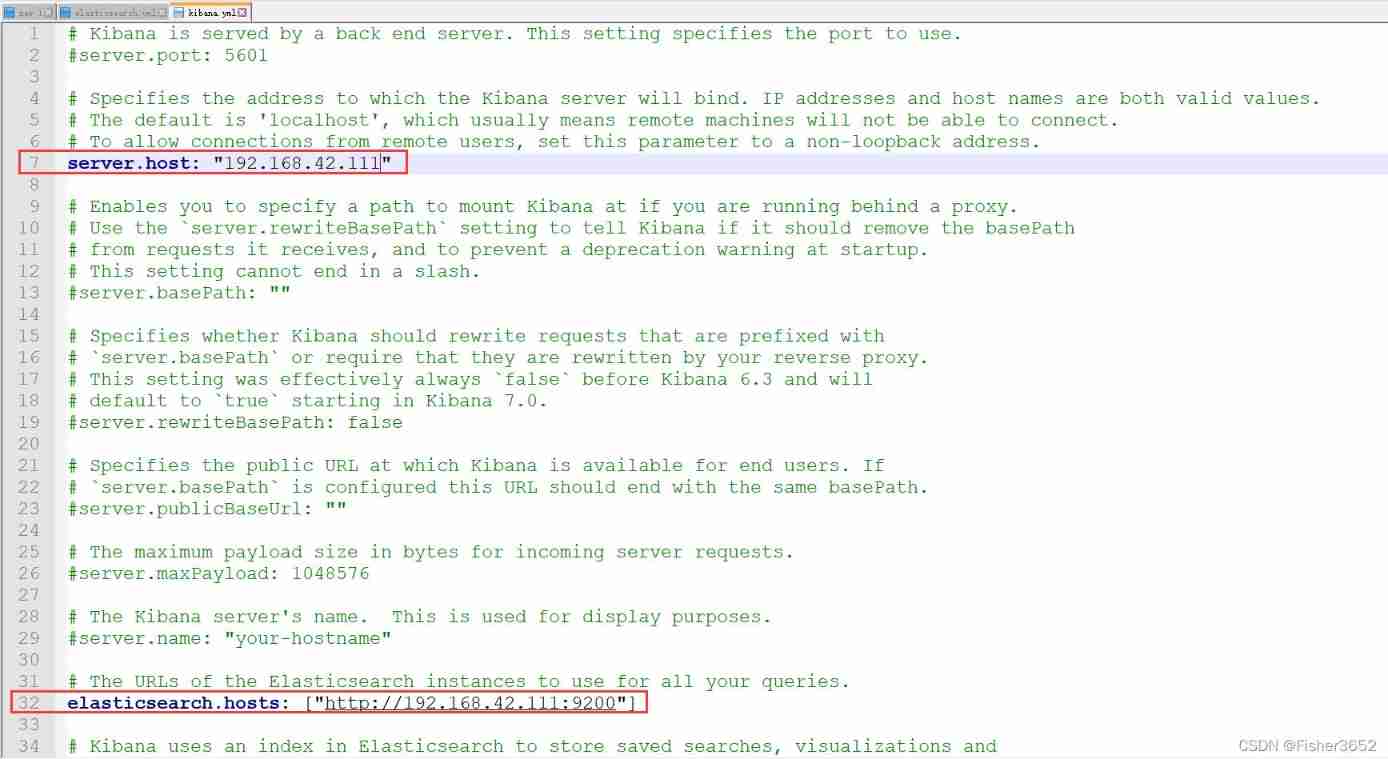
- Modify the configuration file
/kibana-7.14.0-linux-x86_64/config/kibana.yml
- Mainly modify the local address and es Address
server.host: "192.168.42.111"
elasticsearch.hosts: ["http://192.168.42.111:9200"]
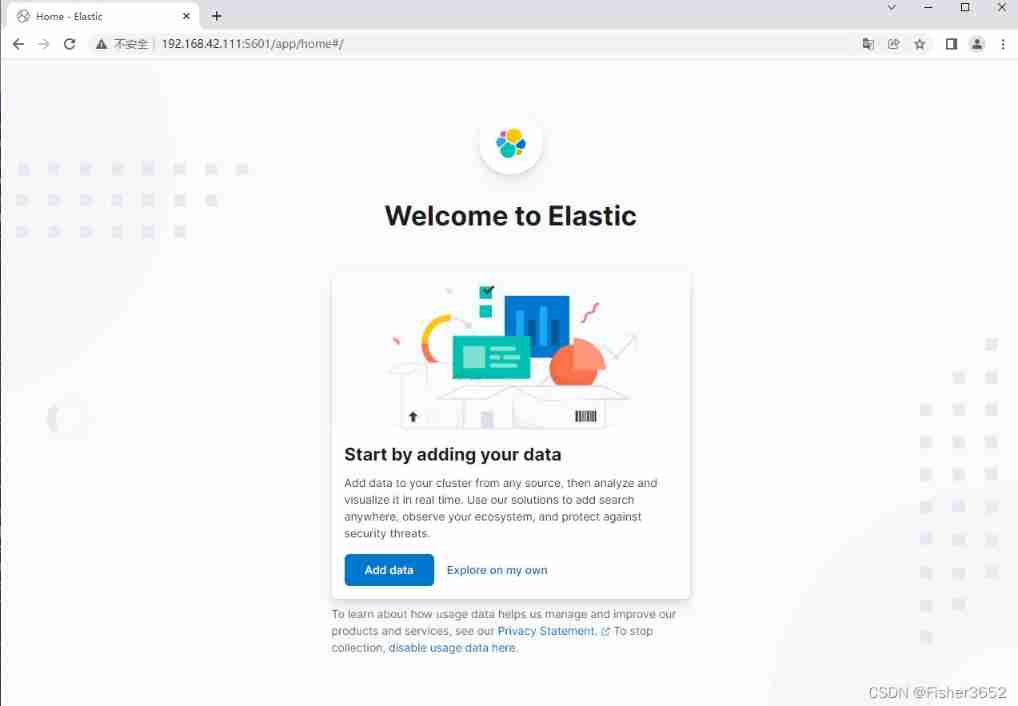
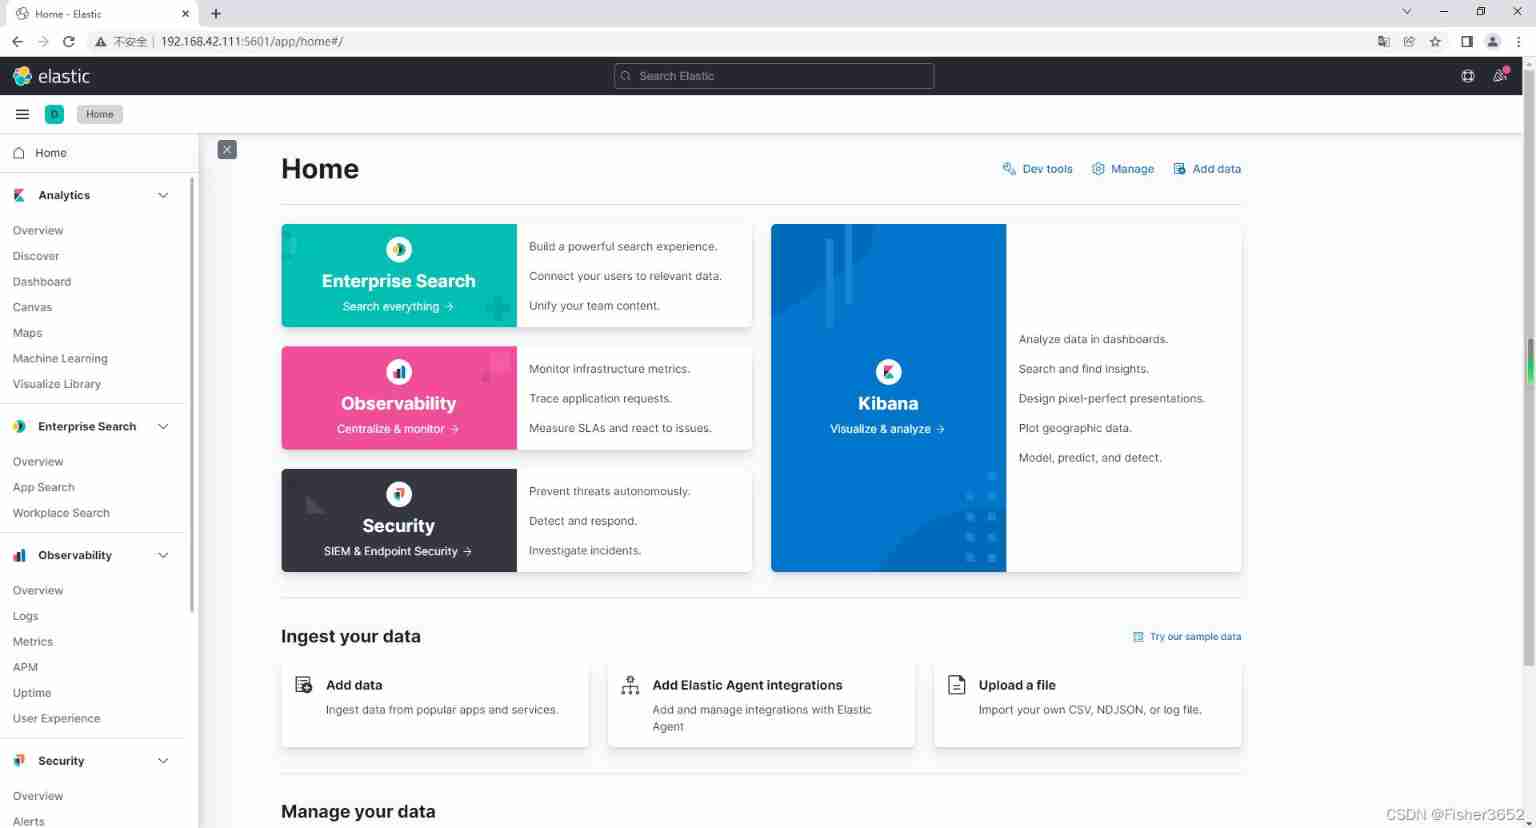
5. Start the service
- function /kibana-7.14.0-linux-x86_64/bin Under the kibana
./bin/kibana
- http://192.168.42.111:5601/app/kibana
- Check the port
#-t (tcp) Show only  tcp  Related options
#-u (udp) Show only  udp  Related options
#-n  Reject alias , Can display all the numbers into numbers .
#-l  List only what is in  Listen ( monitor )  Service status of
#-p  Show the name of the program that established the relevant link
netstat -tunlp|grep 5601
- because kibana It's using node.js Written , So we need to grep node
ps -ef|grep node

边栏推荐
- node工程中package.json文件作用是什么?里面的^尖括号和~波浪号是什么意思?
- 微信小程序:微群人脉微信小程序源码下载全新社群系统优化版支持代理会员系统功能超高收益
- Actual combat simulation │ JWT login authentication
- 【海浪建模1】海浪建模的理论分析和matlab仿真
- Global and Chinese market of portable CNC cutting machines 2022-2028: Research Report on technology, participants, trends, market size and share
- Discrete mathematics: reasoning rules
- 每日刷题记录 (十三)
- C basic knowledge review (Part 3 of 4)
- Database postragesql lock management
- Wechat applet; Gibberish generator
猜你喜欢
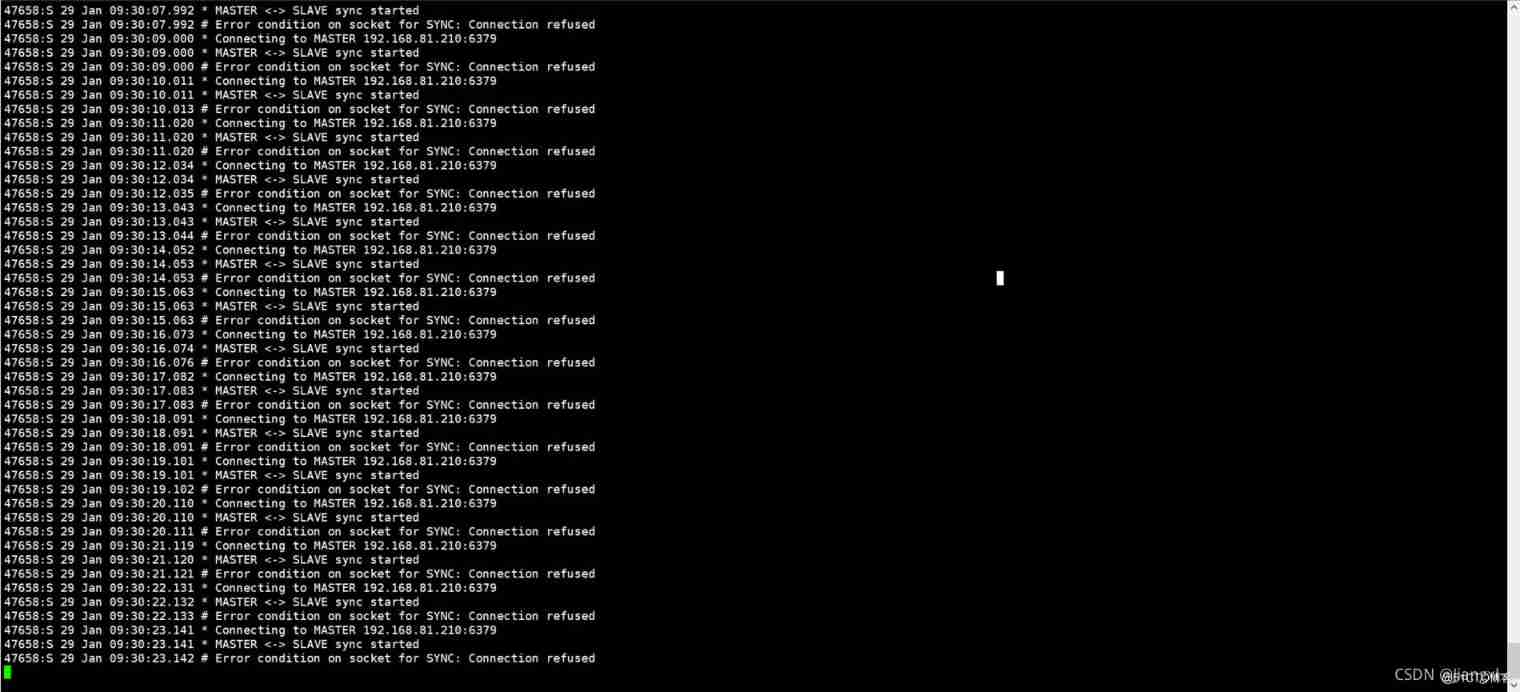
Redis master-slave replication cluster and recovery ideas for abnormal data loss # yyds dry goods inventory #
ROS command line tool

Poap: the adoption entrance of NFT?
![[wave modeling 2] three dimensional wave modeling and wave generator modeling matlab simulation](/img/50/b6cecc95e46fe1e445eb00ca415669.png)
[wave modeling 2] three dimensional wave modeling and wave generator modeling matlab simulation

Expose testing outsourcing companies. You may have heard such a voice about outsourcing
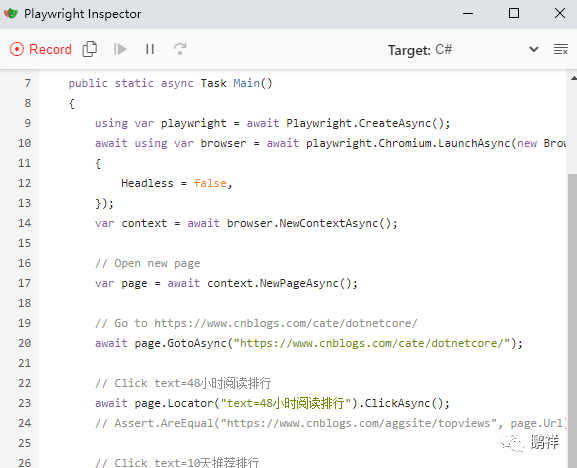
Playwright之录制
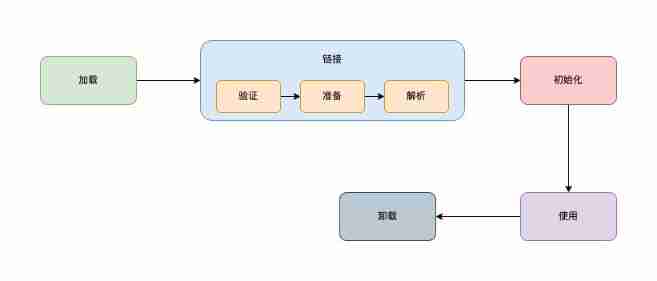
Talking about JVM 4: class loading mechanism

Chia Tai International Futures: what is the master account and how to open it?

Wechat applet; Gibberish generator
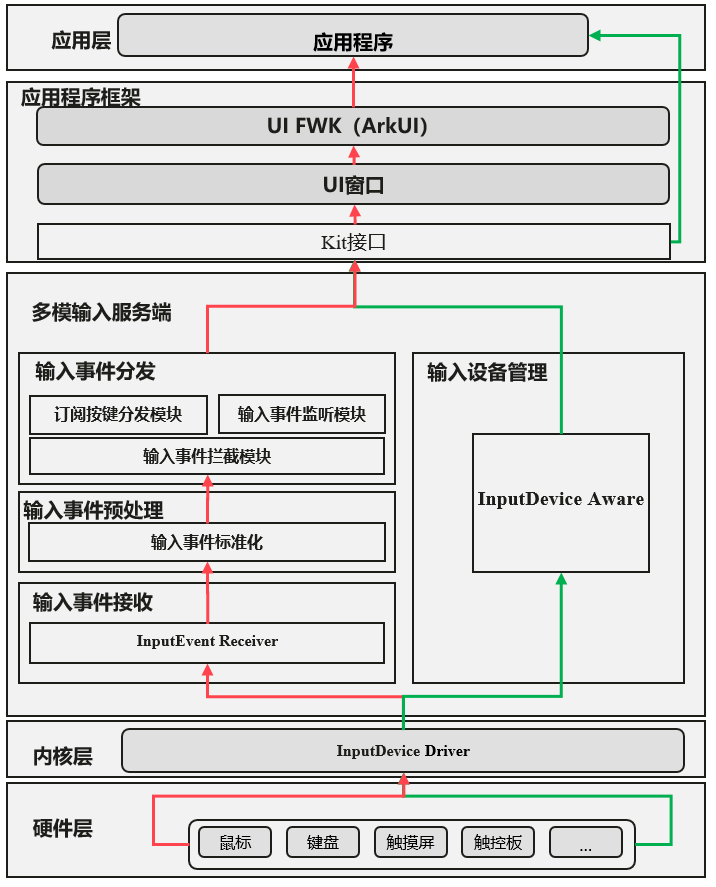
多模输入事件分发机制详解
随机推荐
dotnet-exec 0.6.0 released
小程序直播 + 电商,想做新零售电商就用它吧!
【纯音听力测试】基于MATLAB的纯音听力测试系统
Nebula Importer 数据导入实践
揭露测试外包公司,关于外包,你或许听到过这样的声音
Global and Chinese markets of radiation linear accelerators 2022-2028: Research Report on technology, participants, trends, market size and share
微信小程序:微群人脉微信小程序源码下载全新社群系统优化版支持代理会员系统功能超高收益
Expose testing outsourcing companies. You may have heard such a voice about outsourcing
Are you still writing the TS type code
The performance of major mainstream programming languages is PK, and the results are unexpected
BGP comprehensive experiment
Daily question brushing record (13)
Discrete mathematics: propositional symbolization of predicate logic
Global and Chinese market of nutrient analyzer 2022-2028: Research Report on technology, participants, trends, market size and share
Research Report on the overall scale, major producers, major regions, products and application segmentation of agricultural automatic steering system in the global market in 2022
SAP UI5 应用开发教程之一百零六 - 如何提高 SAP UI5 应用路由 url 的可读性试读版
Wechat applet: Xingxiu UI v1.5 WordPress system information resources blog download applet wechat QQ dual end source code support WordPress secondary classification loading animation optimization
Armv8-a programming guide MMU (3)
A simple SSO unified login design
Single step debugging of master data reading of SAP commerce cloud products