当前位置:网站首页>Concept and basic knowledge of network layering
Concept and basic knowledge of network layering
2022-07-06 17:32:00 【Tang Monk riding white horse】
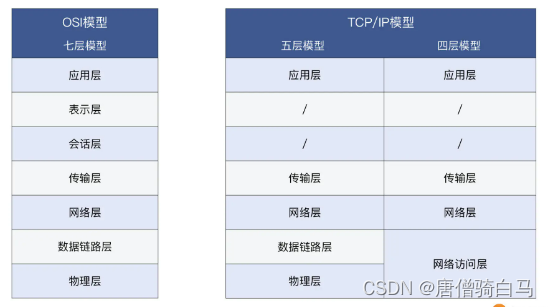
1、OSI The seven-tier model , and TCP/IP Four floors / Five layer model
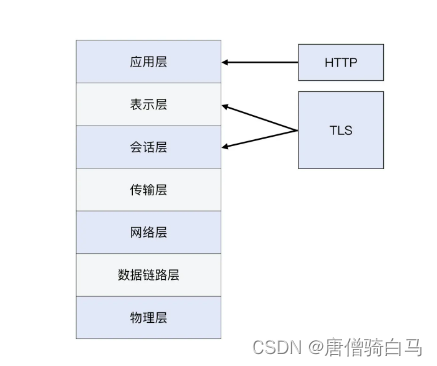
2、TSL layer
3、 What is? TCP flow
At the specific network message level , One TCP flow , The corresponding is a five tuple : Transport protocol type 、 Source IP、 Source port 、 Purpose IP、 Destination port . such as , Today you visited the geek time website , So this time TCP Stream may be such a five tuple :
(TCP, your_ip, your_port, geekbang_ip, 443)
One IP message , It contains all five elements , therefore Wireshark When parsing the packet capture file , Naturally, we can know what each message belongs to through five tuples TCP It's gone . That's why we can Wireshark in , use Follow TCP Stream Methods , Find the message TCP flow .
4、 message 、 frame 、 grouping 、 paragraph 、 Data packets
message (packet), It is a relatively broad and general term , Basically, every layer can be used . such as , At application level , You can say “HTTP message ”; In the transport layer , You can say “TCP message ”; alike , At the network level , Of course it is “IP message ” 了 . in fact , So is the network layer “ message ” The most used scene . Packets are similar , It can be used in many scenarios .
frame (frame) It is the concept of two layers, that is, the data link layer , Represents the layer-2 message , It contains frame headers 、 load 、 Frame tail . Be careful , Frames have tails , And others like IP、TCP、HTTP Messages of the same level , There is no tail . We can't say “TCP frame ” perhaps “IP frame ”, Although the other party may understand what you mean , But we all want to be professional , It's not . Here's a little bit of knowledge :HTTP/2 Multiplexing is realized , There is also the concept of frame , But that frame , Follow the frame on the second layer of the network , Except for the same name , There is no other connection .
The group is IP Layer message , In a narrow sense packet.
Paragraph specific TCP segment, That is to say TCP message . since segment yes “ part ” It means , So this one “ whole ” And what is it ? It is the message delivered to the transport layer at the application layer (message). When message When delivered to the transport layer , If this message The original size of , Transport layer data unit limit exceeded ( For example, beyond TCP Of MSS), It will be divided into several segment. This process is segmentation (segmentation), It's also TCP A very important responsibility of the layer .
Data packets ,Datagram The Chinese name is “ The datagram ”, But it's not “ Data packets ”. It sounds like , But the meaning is not exactly the same . As I said before ,“ Data packets ” Is a common word , So use “UDP Data packets ” Refer to “UDP The datagram ” No problem . But, in turn, , Not UDP Protocol packets , such as TCP paragraph , You can't call “TCP The datagram ” 了 , because TCP No Datagram.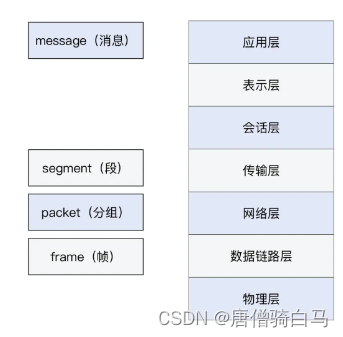
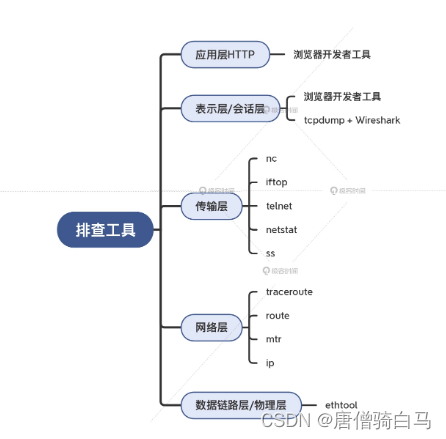
5、 Corresponding troubleshooting tools at the network layer
5.1、 application layer
- Chrome+F12——>network
- Application page ——> find Storage ——>Cookie
5.2、 Session layer and presentation layer
- The first one is , Or do a preliminary check based on the browser , Mainly around the certificate itself
- The second kind , About TLS handshake 、 key exchange 、 Check the ciphertext transmission and other aspects , Still need to use tcpdump and Wireshark To do it
5.3、 Transport layer
Path accessibility test
$ telnet www.baidu.com 443
Trying 180.101.49.12...
Connected to www.a.shifen.com.
Escape character is '^]'.
nc
$ nc -w 2 -zv www.baidu.com 443
Connection to www.baidu.com 443 port [tcp/https] succeeded!
netstat Check the current connection status
$ netstat -ant
Active Internet connections (servers and established)
Proto Recv-Q Send-Q Local Address           Foreign Address         State
tcp        0      0 127.0.0.53:53           0.0.0.0:*               LISTEN
tcp        0      0 0.0.0.0:22              0.0.0.0:*               LISTEN
tcp        0      0 0.0.0.0:80              0.0.0.0:*               LISTEN
tcp        0    280 10.0.2.15:22            10.0.2.2:56669          ESTABLISHED
tcp6       0      0 :::22                   :::*                    LISTEN
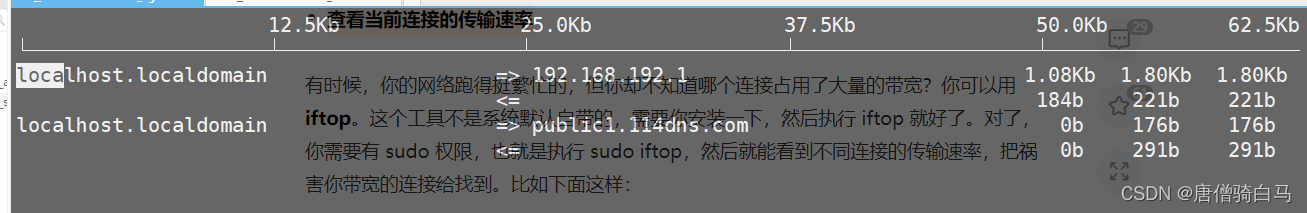
Check the transmission rate of the current connection
[[email protected] ~]# iftop
interface: ens33
IP address is: 192.168.192.110
MAC address is: 00:0c:29:9d:13:5f
Check the statistics of packet loss and disorder ,netstat -s command
[[email protected] ~]# netstat -s
Ip:
    1081829 total packets received
    0 forwarded
    0 incoming packets discarded
    1081814 incoming packets delivered
    765524 requests sent out
    16 outgoing packets dropped
Icmp:
    70 ICMP messages received
    0 input ICMP message failed.
    ICMP input histogram:
        destination unreachable: 44
        echo requests: 26
    84 ICMP messages sent
    0 ICMP messages failed
View the dynamic change value
[[email protected] ~]# watch -d netstat -s
ss -s Order to see the overall situation
[email protected] ~]# ss -s
Total: 179 (kernel 760)
TCP:   14 (estab 3, closed 2, orphaned 0, synrecv 0, timewait 2/0), ports 0

Transport Total     IP        IPv6
*	  760       -         -
RAW	  0         0         0
UDP	  0         0         0
TCP	  12        6         6
INET	  12        6         6
FRAG	  0         0         0
5.4、 The network layer
Check the network path status
[[email protected] ~]# traceroute www.baidu.com
traceroute to www.baidu.com (14.215.177.39), 30 hops max, 60 byte packets
 1  gateway (192.168.192.2)  0.420 ms  0.201 ms  1.479 ms
 2  * * *
 3  * * *
 4  * * *
add -I Parameters (I representative ICMP), You can run to the end normally :
$ traceroute  www.baidu.com -I
traceroute to www.a.shifen.com (180.101.49.12), 64 hops max
  1   10.0.2.2  0.099ms  2.363ms  0.078ms
  2   192.168.1.1  3.320ms  1.220ms  1.204ms
  3   100.65.0.1  8.737ms  4.872ms  6.403ms
  4   61.152.54.125  5.035ms  3.397ms  4.288ms
  5   *  61.152.25.110  4.176ms  *
  6   202.97.101.30  7.447ms  6.399ms  5.936ms
  7   58.213.95.110  10.488ms  *  9.014ms
  8   *  58.213.95.134  11.064ms  *
  9   58.213.96.74  10.997ms  10.042ms  10.592ms
 10   *  *  *
 11   *  *  *
 12   *  *  *
 13   180.101.49.12  11.269ms  9.518ms  8.779ms
The principle behind it , Namely traceroute The default is to use UDP As a detection protocol , But many network devices are not right UDP Respond . So we changed it to ICMP After protocol detection , The network device will respond . Actually ,Windows Upper tracert, The default is to use ICMP, This is the same as Linux Just the opposite .
use mtr, To obtain more comprehensive and dynamic link state information
$ mtr www.baidu.com -r -c 10
Start: 2022-01-07T04:05:02+0000
HOST: victorebpf                  Loss%   Snt   Last   Avg  Best  Wrst StDev
  1.|-- _gateway                   0.0%    10    0.3   0.4   0.2   1.2   0.3
  2.|-- 192.168.1.1                0.0%    10    1.6   1.8   1.4   3.2   0.5
  3.|-- 100.65.0.1                 0.0%    10    3.8   7.0   3.8  10.3   2.0
  4.|-- 61.152.54.125              0.0%    10    4.0   4.3   3.6   5.1   0.5
  5.|-- 61.152.25.110             30.0%    10    5.0   6.8   4.4  18.9   5.4
  6.|-- 202.97.101.30             20.0%    10    7.8   6.6   5.4   7.8   0.8
  7.|-- 58.213.95.110             80.0%    10   10.0   9.8   9.6  10.0   0.3
  8.|-- ???                       100.0    10    0.0   0.0   0.0   0.0   0.0
  9.|-- 58.213.96.74               0.0%    10   10.5  12.7   9.9  24.7   4.9
 10.|-- ???                       100.0    10    0.0   0.0   0.0   0.0   0.0
 11.|-- ???                       100.0    10    0.0   0.0   0.0   0.0   0.0
 12.|-- ???                       100.0    10    0.0   0.0   0.0   0.0   0.0
 13.|-- 180.101.49.12              0.0%    10    9.4   9.1   8.3   9.7   0.5
route View routes
# route -n
Kernel IP routing table
Destination     Gateway         Genmask         Flags Metric Ref    Use Iface
0.0.0.0         10.0.2.2        0.0.0.0         UG    100    0        0 enp0s3
10.0.2.0        0.0.0.0         255.255.255.0   U     0      0        0 enp0s3
10.0.2.2        0.0.0.0         255.255.255.255 UH    100    0        0 enp0s3
172.17.0.0      0.0.0.0         255.255.0.0     U     0      0        0 docker0
netstat, In fact, it can also help us check the route , Just add -r Parameters :
[[email protected] ~]# netstat -r
Kernel IP routing table
Destination     Gateway         Genmask         Flags   MSS Window  irtt Iface
default         gateway         0.0.0.0         UG        0 0          0 ens33
172.17.0.0      0.0.0.0         255.255.0.0     U         0 0          0 docker0
192.168.192.0   0.0.0.0         255.255.255.0   U         0 0          0 ens33
ip route You can also view the routing information
[[email protected] ~]# ip route
default via 192.168.192.2 dev ens33 proto static metric 100
172.17.0.0/16 dev docker0 proto kernel scope link src 172.17.0.1 linkdown
192.168.192.0/24 dev ens33 proto kernel scope link src 192.168.192.110 metric 100
5.5、 Data link layer and physical layer
This layer is far away from the application layer , Generally speaking, a full-time network team is in charge . If there is a problem on this floor , It will be directly reflected in the performance of the network layer , such as IP There will be packet loss and delay , Then a transport layer exception will be thrown ( Such as packet loss 、 Disorder 、 The retransmission etc. ). therefore , A stable data link layer and even physical layer , It is the cornerstone of network reliability .
Use ethtool Check out the information
# ethtool -S enp0s3
NIC statistics:
     rx_packets: 45897
     tx_packets: 9457
     rx_bytes: 59125524
     tx_bytes: 834625
     rx_broadcast: 0
     tx_broadcast: 17
     rx_multicast: 0
     tx_multicast: 59
     rx_errors: 0
     tx_errors: 0
     tx_dropped: 0
边栏推荐
- 02个人研发的产品及推广-短信平台
- MySQL报错解决
- JVM之垃圾回收器下篇
- Idea breakpoint debugging skills, multiple dynamic diagram package teaching package meeting.
- February database ranking: how long can Oracle remain the first?
- Interpretation of Flink source code (II): Interpretation of jobgraph source code
- Development and practice of lightweight planning service tools
- mysql的合计/统计函数
- 02 personal developed products and promotion - SMS platform
- JVM之垃圾回收器上篇
猜你喜欢
1. JVM入门介绍
03个人研发的产品及推广-计划服务配置器V3.0
C# WinForm中DataGridView单元格显示图片
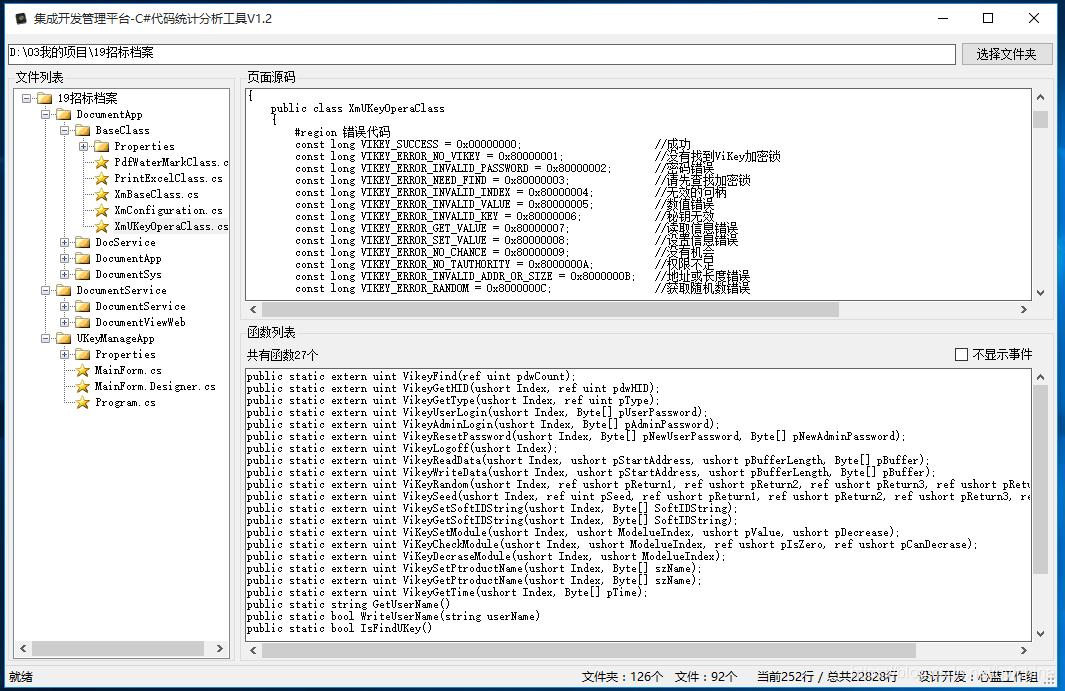
06 products and promotion developed by individuals - code statistical tools
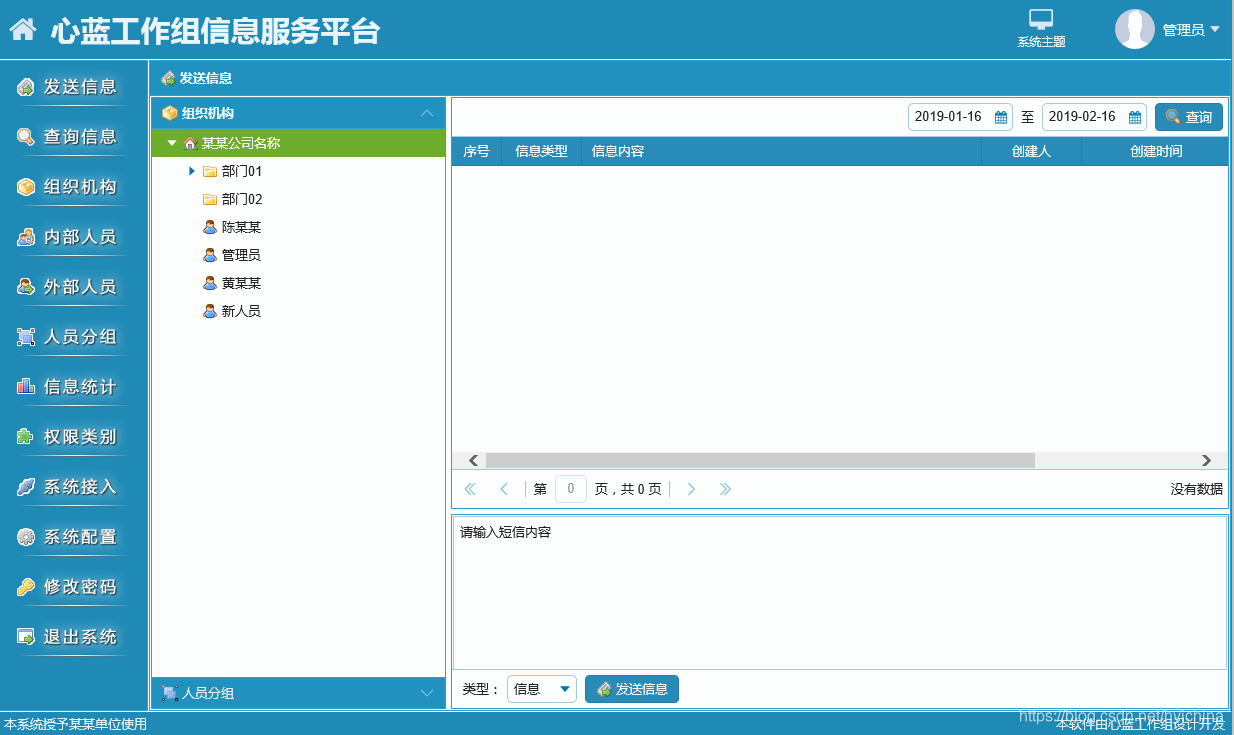
02 personal developed products and promotion - SMS platform

Some feelings of brushing leetcode 300+ questions
华为认证云计算HICA
手把手带你做强化学习实验--敲级详细
Application service configurator (regular, database backup, file backup, remote backup)
全网最全tcpdump和Wireshark抓包实践
随机推荐
吴军三部曲见识(四) 大家智慧
Redis quick start
JVM运行时数据区之程序计数器
Flink analysis (II): analysis of backpressure mechanism
DataGridView scroll bar positioning in C WinForm
[ciscn 2021 South China]rsa writeup
07 personal R & D products and promotion - human resources information management system
轻量级计划服务工具研发与实践
Development and practice of lightweight planning service tools
JVM 垃圾回收器之Garbage First
当前系统缺少NTFS格式转换器(convert.exe)
Brush questions during summer vacation, ouch ouch
Interpretation of Flink source code (III): Interpretation of executiongraph source code
About selenium starting Chrome browser flash back
06 products and promotion developed by individuals - code statistical tools
Wu Jun's trilogy insight (V) refusing fake workers
04 products and promotion developed by individuals - data push tool
2021-03-22 "display login screen during recovery" can't be canceled. The appearance of lock screen interface leads to the solution that the remotely connected virtual machine can't work normally
[reverse] repair IAT and close ASLR after shelling
C#WinForm中的dataGridView滚动条定位