当前位置:网站首页>boot - prometheus-push gateway 使用
boot - prometheus-push gateway 使用
2022-07-06 17:22:00 【iiaythi】
boot - prometheus-push gateway 使用
场景
一般的,如果使用prometheus 集成 boot 应用 ,就需要 在 prometheus 中配置 一个任务,如果应用 很多,这样不太方便,就可以使用 prometheus push gateway
数据流向:
- prometheus push gateway 定时任务从 boot 应用 中收集数据
- prometheus 向 push gateway 中定时拉取数据
- grafana 做数据展示
docker 创建 prometheus push gateway
docker-compose.yml 配置文件
version: '3.7'

networks:
    monitor:
        driver: bridge

services:
    prometheus:
        image: prom/prometheus
        container_name: prometheus
        hostname: prometheus
        restart: always
        user: root
        volumes:
            - ./prometheus/conf:/etc/prometheus
            - ./prometheus/data:/prometheus
            - /etc/localtime:/etc/localtime:ro
            - /etc/timezone:/etc/timezone:ro
        ports:
            - "9090:9090"
        networks:
            - monitor
        command:
            - '--config.file=/etc/prometheus/prometheus.yml'
            - '--storage.tsdb.path=/prometheus'
    pushgateway:
        image: prom/pushgateway
        restart: always
        ports:
            - 9091:9091
        volumes:
            - ./pushgateway/data:/pushgateway
            - /etc/localtime:/etc/localtime:ro
            - /etc/timezone:/etc/timezone:ro
        networks:
            - monitor

    alertmanager:
        image: prom/alertmanager
        container_name: alertmanager
        hostname: alertmanager
        user: root
        restart: always
        volumes:
            - ./alertmanager/conf:/etc/alertmanager
            - /etc/localtime:/etc/localtime:ro
            - /etc/timezone:/etc/timezone:ro
        ports:
            - "9094:9093"
        networks:
            - monitor

    grafana:
        image: grafana/grafana
        container_name: grafana
        hostname: grafana
        user: root
        restart: always
        ports:
            - "3000:3000"
        volumes:
            - ./grafana/data:/var/lib/grafana
            - /etc/localtime:/etc/localtime:ro
            - /etc/timezone:/etc/timezone:ro
        networks:
            - monitor

    node-exporter:
        image: quay.io/prometheus/node-exporter
        container_name: node-exporter
        hostname: node-exporter
        restart: always
        user: root
        ports:
            - "9100:9100"
        networks:
            - monitor
        volumes:
            - /etc/localtime:/etc/localtime:ro
            - /etc/timezone:/etc/timezone:ro
配置 prometheus
prometheus.yaml
$ cat prometheus/conf/prometheus.yml
# my global config
global:
  scrape_interval:     15s # Set the scrape interval to every 15 seconds. Default is every 1 minute.
  evaluation_interval: 15s # Evaluate rules every 15 seconds. The default is every 1 minute.
  # scrape_timeout is set to the global default (10s).

  # Attach these labels to any time series or alerts when communicating with
  # external systems (federation, remote storage, Alertmanager).
  external_labels:
      monitor: 'codelab-monitor'

# Load rules once and periodically evaluate them according to the global 'evaluation_interval'.
rule_files:
  # - "first.rules"
  # - "second.rules"

# A scrape configuration containing exactly one endpoint to scrape:
# Here it's Prometheus itself.
scrape_configs:
  # The job name is added as a label `job=<job_name>` to any timeseries scraped from this config.
  - job_name: 'prometheus' # prometheus 地址

    # metrics_path defaults to '/metrics'
    # scheme defaults to 'http'.

    static_configs:
      - targets: ['192.xxx.xx.10:9090']
  - job_name: 'pushgateway'   # push-gateway 地址
    scrape_interval: 15s
    static_configs:
      - targets: ['192.xx.xx.10:9091']
boot 集成 prometheus gateway
引入依赖
<dependencies>
    <dependency>
        <groupId>org.springframework.boot</groupId>
        <artifactId>spring-boot-starter-web</artifactId>
    </dependency>
    <dependency>
        <groupId>org.springframework.boot</groupId>
        <artifactId>spring-boot-starter-actuator</artifactId>
    </dependency>

    <dependency>
        <groupId>org.springframework.boot</groupId>
        <artifactId>spring-boot-devtools</artifactId>
        <scope>runtime</scope>
        <optional>true</optional>
    </dependency>
    <dependency>
        <groupId>io.micrometer</groupId>
        <artifactId>micrometer-registry-prometheus</artifactId>
        <scope>runtime</scope>
    </dependency>
    <!-- https://mvnrepository.com/artifact/io.prometheus/simpleclient_pushgateway -->
    // push gateway 客户端
    <dependency>
        <groupId>io.prometheus</groupId>
        <artifactId>simpleclient_pushgateway</artifactId>
    </dependency>
    <dependency>
        <groupId>org.projectlombok</groupId>
        <artifactId>lombok</artifactId>
        <optional>true</optional>
    </dependency>
    <dependency>
        <groupId>org.springframework.boot</groupId>
        <artifactId>spring-boot-starter-test</artifactId>
        <scope>test</scope>
    </dependency>
application.properties 配置
spring.application.name=boot-prometheus-gw
management.metrics.tags.application=${spring.application.name}
# 暴露promethues 端点
management.endpoints.web.exposure.include=*
management.endpoint.shutdown.enabled=true

management.endpoint.metrics.enabled=true
management.endpoint.prometheus.enabled=true
management.metrics.export.prometheus.enabled=true
## 指定 prometheus gateway 地址
management.metrics.export.prometheus.pushgateway.base-url=192.1xx.x.10:9091
management.metrics.export.prometheus.pushgateway.push-rate=15s
## 上报服务名称
management.metrics.export.prometheus.pushgateway.job=${spring.application.name}
management.metrics.export.prometheus.pushgateway.enabled=true

server.port=9998
数据统计
@RestController
public class HelloController {


    @Autowired
    private MeterRegistry meterRegistry;

    public HelloController(MeterRegistry meterRegistry) {

        this.meterRegistry = meterRegistry;
    }

    @GetMapping("/get")
    public String get() throws InterruptedException {

        Counter counter = Counter.builder("hello-counter").register(meterRegistry);
        counter.increment();
        TimeUnit.SECONDS.sleep(1);
        return "Hello, counter = " + counter.count();
    }
}
访问 prometheus push gateway: http://localhost:9091
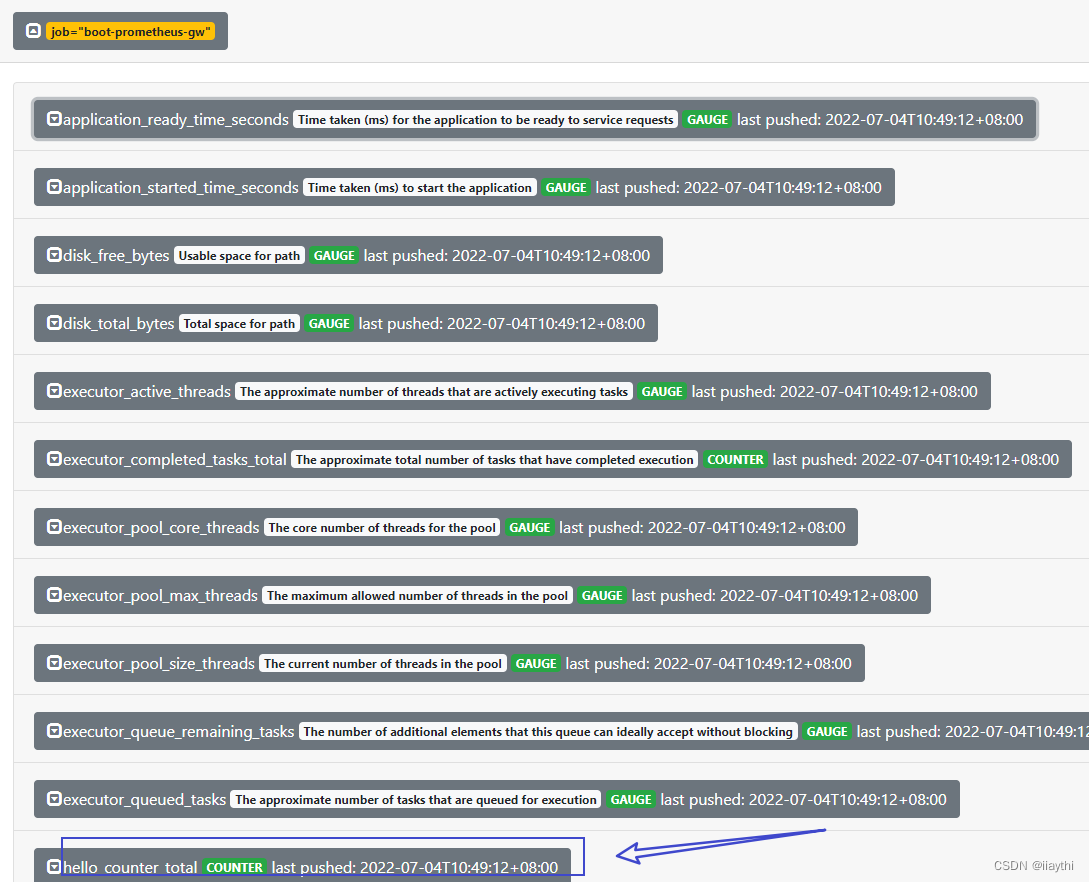
再看 grafana
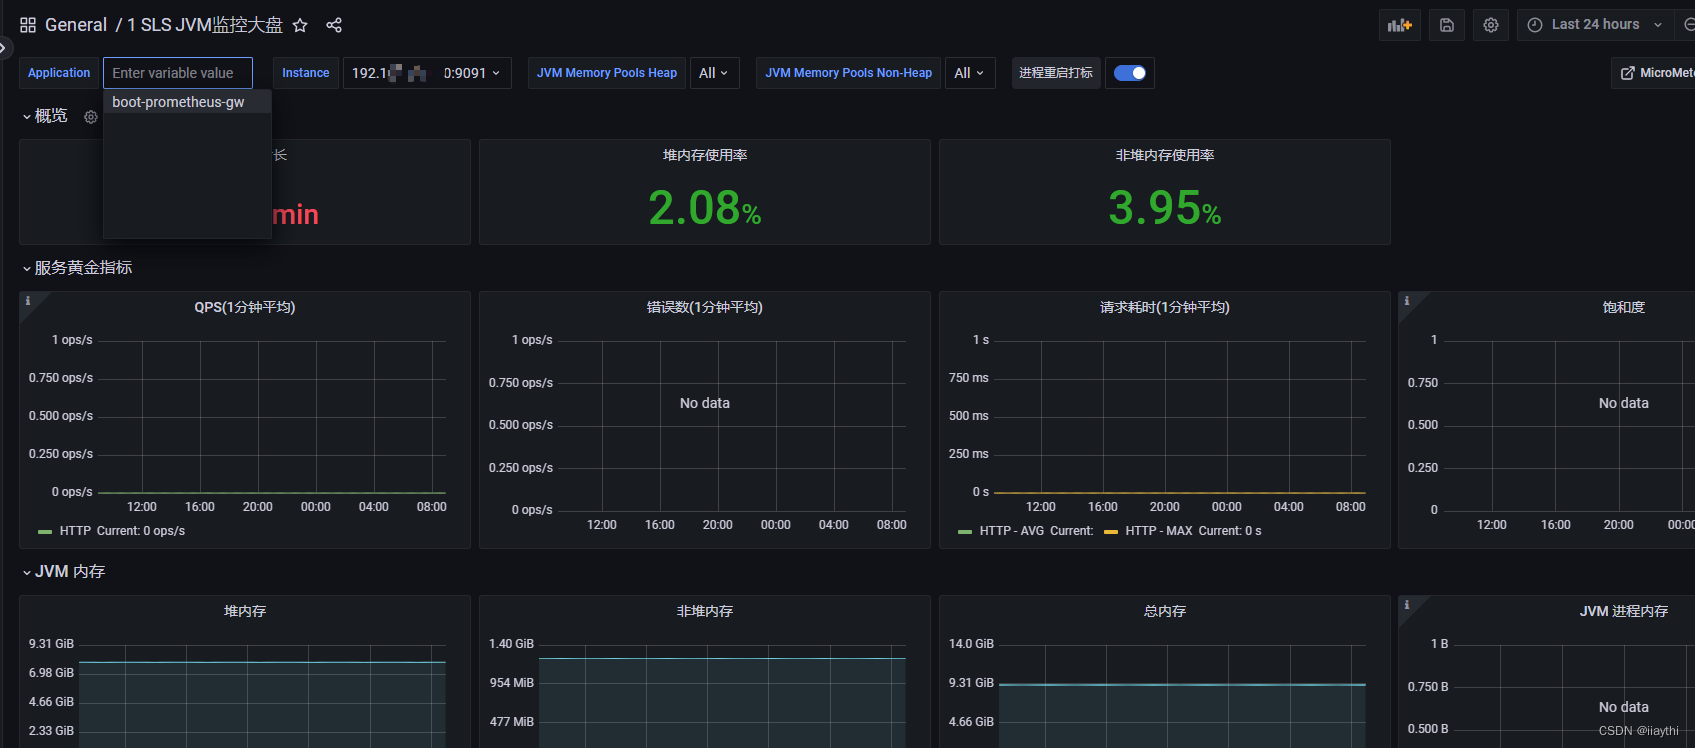
good luck!
边栏推荐
- Trace tool for MySQL further implementation plan
- Configuring OSPF basic functions for Huawei devices
- 一行代码实现地址信息解析
- Zabbix 5.0:通过LLD方式自动化监控阿里云RDS
- [Niuke classic question 01] bit operation
- Openjudge noi 1.7 08: character substitution
- ESP Arduino (IV) PWM waveform control output
- OSPF configuration command of Huawei equipment
- pyflink的安装和测试
- ZABBIX 5.0: automatically monitor Alibaba cloud RDS through LLD
猜你喜欢
![[user defined type] structure, union, enumeration](/img/a5/d6bcfb128ff6c64f9d18ac4c209210.jpg)
[user defined type] structure, union, enumeration
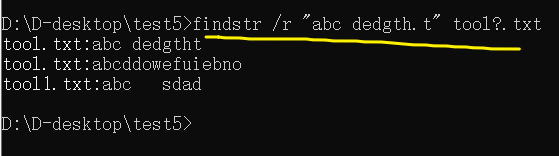
【批處理DOS-CMD命令-匯總和小結】-字符串搜索、查找、篩選命令(find、findstr),Find和findstr的區別和辨析
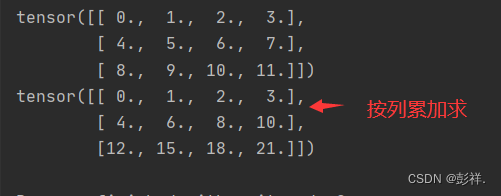
深度学习之线性代数
第七篇,STM32串口通信编程
Part 7: STM32 serial communication programming
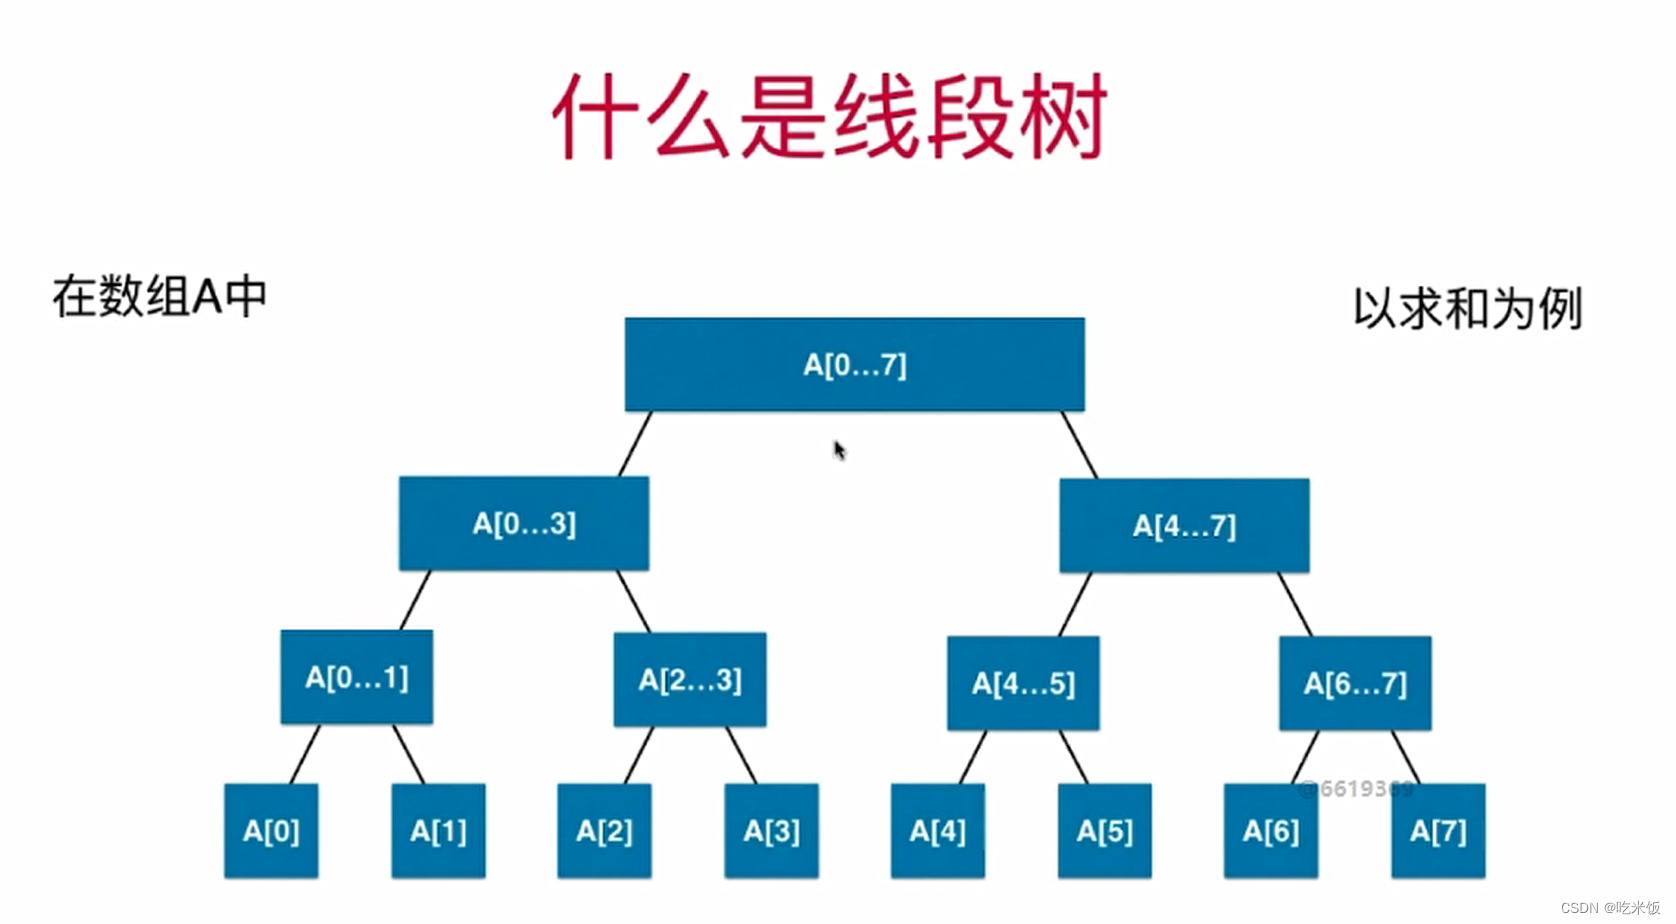
线段树(SegmentTree)
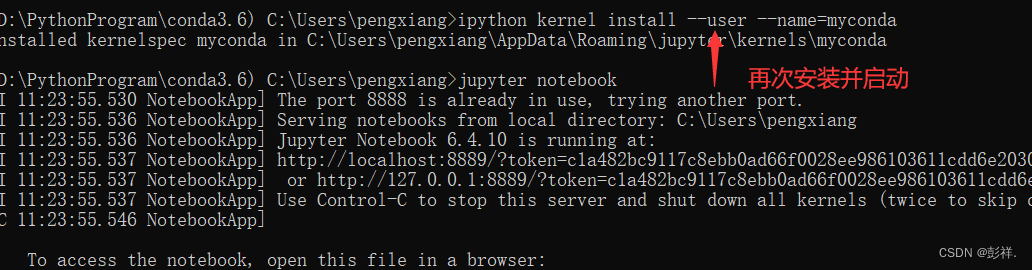
深度学习之环境配置 jupyter notebook
![[batch dos-cmd command - summary and summary] - jump, cycle, condition commands (goto, errorlevel, if, for [read, segment, extract string]), CMD command error summary, CMD error](/img/a5/41d4cbc070d421093323dc189a05cf.png)
[batch dos-cmd command - summary and summary] - jump, cycle, condition commands (goto, errorlevel, if, for [read, segment, extract string]), CMD command error summary, CMD error
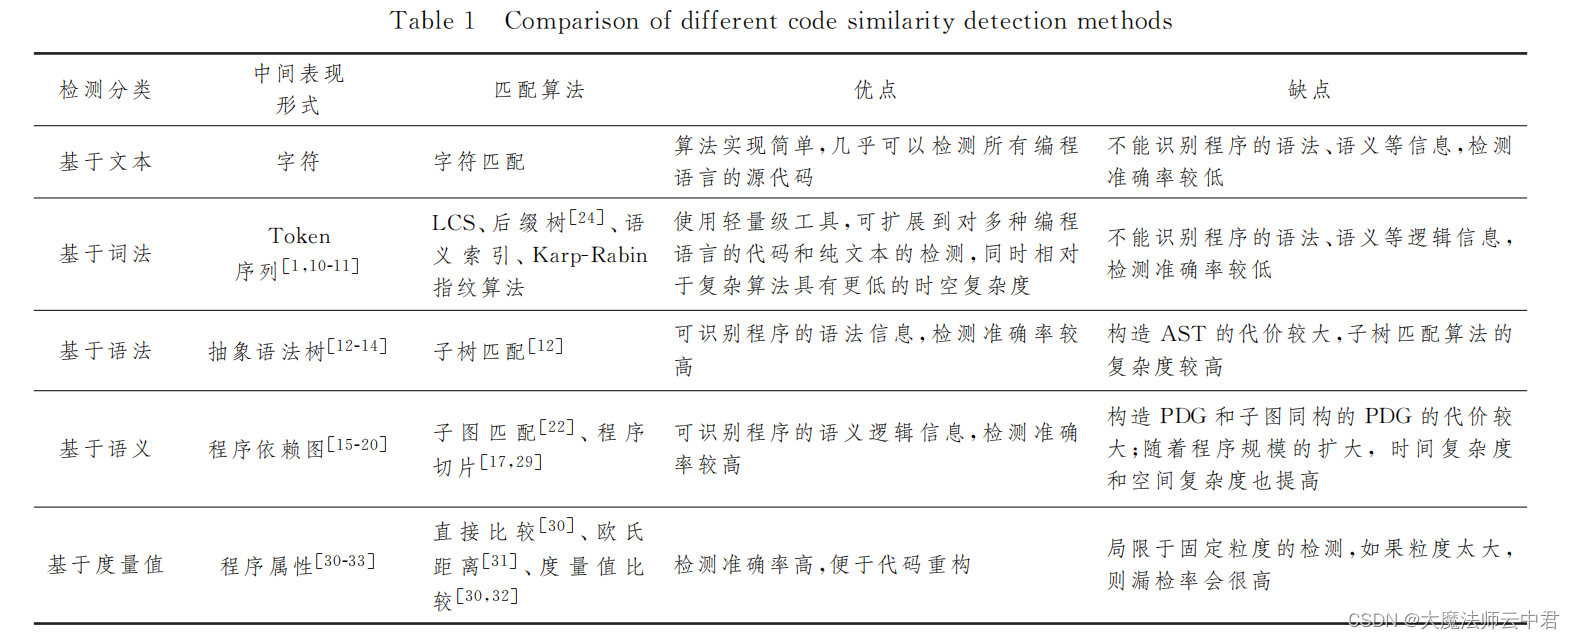
Five different code similarity detection and the development trend of code similarity detection
![[牛客] [NOIP2015]跳石头](/img/9f/b48f3c504e511e79935a481b15045e.png)
[牛客] [NOIP2015]跳石头
随机推荐
第四篇,STM32中断控制编程
Telerik UI 2022 R2 SP1 Retail-Not Crack
Part 7: STM32 serial communication programming
Windows installation mysql8 (5 minutes)
[C language] dynamic address book
[software reverse automation] complete collection of reverse tools
Lombok makes ⽤ @data and @builder's pit at the same time. Are you hit?
Attention slam: a visual monocular slam that learns from human attention
Openjudge noi 1.7 10: simple password
Distributed cache
ESP Arduino (IV) PWM waveform control output
windows安装mysql8(5分钟)
Dell Notebook Periodic Flash Screen Fault
In rails, when the resource creation operation fails and render: new is called, why must the URL be changed to the index URL of the resource?
Attention SLAM:一种从人类注意中学习的视觉单目SLAM
在jupyter中实现实时协同是一种什么体验
再聊聊我常用的15个数据源网站
from . cv2 import * ImportError: libGL. so. 1: cannot open shared object file: No such file or direc
详解OpenCV的矩阵规范化函数normalize()【范围化矩阵的范数或值范围(归一化处理)】,并附NORM_MINMAX情况下的示例代码
建立自己的网站(17)