当前位置:网站首页>ELFK部署
ELFK部署
2022-07-05 02:25:00 【查无此人0330】
目录
Elasticsearch 部署(在Node1、Node2节点上操作)
ELFK= ES + logstash+filebeat+kibana
| 服务器类型 | 系统和IP地址 | 需要安装的组件 | 硬件方面 |
|---|---|---|---|
| node1节点 | 192.168.52.110 | JDK、elasticsearch-6.7.2 | 2核4G |
| node2节点 | 192.168.52.120 | JDK、elasticsearch-6.7.2 | 2核4G |
| apache节点 | 192.168.52.130 | JDK、apache、logstash-6.7.2、kabana-6.7.2、filebeat-6.7.2 | 2核4G |
环境准备
所有节点
systemctl stop firewalld.service
systemctl disable firewalld.service
setenforce 0
Elasticsearch 部署(在Node1、Node2节点上操作)
安装elasticsearch—rpm包
#上传elasticsearch-6.7.2.rpm到/opt目录下
cd /opt
rpm -ivh elasticsearch-6.7.2.rpm
修改elasticsearch主配置文件
cp /etc/elasticsearch/elasticsearch.yml /etc/elasticsearch/elasticsearch.yml.bak
vim /etc/elasticsearch/elasticsearch.yml
--17--取消注释,指定集群名字
cluster.name: my-elk-cluster
--23--取消注释,指定节点名字:Node1节点为node1,Node2节点为node2
node.name: node1
node.master: true		#是否master节点,false为否
node.data: true			#是否数据节点,false为否
--35--取消注释,指定数据存放路径
path.data: /var/lib/elasticsearch
--39--取消注释,指定日志存放路径
path.logs: /var/log/elasticsearch
--45--取消注释,避免es使用swap交换分区
bootstrap.memory_lock: true
--57--取消注释,设置监听地址,0.0.0.0代表所有地址
network.host: 0.0.0.0
--51--取消注释,ES 服务的默认监听端口为9200
http.port: 9200					#指定es集群提供外部访问的接口
transport.tcp.port: 9300		#指定es集群内部通信接口
--71--取消注释,集群发现通过单播实现,指定要发现的节点
discovery.zen.ping.unicast.hosts: ["192.168.80.10:9300", "192.168.2.11:9300"]

grep -v "^#" /etc/elasticsearch/elasticsearch.yml
es 性能调优参数
优化最大内存大小和最大文件描述符的数量
vim /etc/security/limits.conf
......

*  soft    nofile          65536
*  hard    nofile          131072
*  soft    memlock         unlimited
*  hard    memlock         unlimited
systemctl daemon-reexec

vim /etc/sysctl.conf
#一个进程可以拥有的最大内存映射区域数,参考数据(分配 2g/262144,4g/4194304,8g/8388608)
vm.max_map_count=262144

sysctl -p
sysctl -a | grep vm.max_map_count
启动elasticsearch是否成功开启
systemctl start elasticsearch.service
systemctl enable elasticsearch.service
netstat -antp | grep 9200
查看节点信息
浏览器访问 http://192.168.52.110:9200 、 http://192.168.52.120:9200 查看节点 Node1、Node2 的信息。
浏览器访问 http://192.168.239.10:9200/_cluster/state?prettyhttp://192.168.52.110:9200http://192.168.239.10:9200/_cluster/state?pretty 检查群集状态信息。
Logstash 部署(在 Apache 节点上操作)
安装Apahce服务(httpd)
yum -y install httpd
systemctl start httpd
安装Java环境
yum -y install java
java -version
安装logstash
#上传软件包 logstash-6.7.2.rpm 到/opt目录下
cd /opt
rpm -ivh logstash-6.7.2.rpm
systemctl start logstash.service
systemctl enable logstash.service

ln -s /usr/share/logstash/bin/logstash /usr/local/bin/
安装 Kiabana
#上传软件包 kibana-6.7.2-x86_64.rpm 到/opt目录
cd /opt
rpm -ivh kibana-6.7.2-x86_64.rpm
设置 Kibana 的主配置文件
vim /etc/kibana/kibana.yml
--2--取消注释,Kiabana 服务的默认监听端口为5601
server.port: 5601
--7--取消注释,设置 Kiabana 的监听地址,0.0.0.0代表所有地址
server.host: "0.0.0.0"
--28--取消注释,配置es服务器的ip,如果是集群则配置该集群中master节点的ip
elasticsearch.url:  ["http://192.168.52.110:9200","http://192.168.52.120:9200"]
--37--取消注释,设置在 elasticsearch 中添加.kibana索引
kibana.index: ".kibana"
--96--取消注释,配置kibana的日志文件路径(需手动创建),不然默认是messages里记录日志
logging.dest: /var/log/kibana.log
创建日志文件,启动 Kibana 服务
touch /var/log/kibana.log
chown kibana:kibana /var/log/kibana.log
systemctl start kibana.service
systemctl enable kibana.service
netstat -natp | grep 5601
创建索引
将 Apache 服务器的日志(访问的、错误的)添加到 Elasticsearch 并通过 Kibana 显示
vim /etc/logstash/conf.d/apache_log.conf

input {
    file{
        path => "/etc/httpd/logs/access_log"  #指定真确目录位置
        type => "access"
        start_position => "beginning"
    }
    file{
        path => "/etc/httpd/logs/error_log"   #指定错误日志目录
        type => "error"
        start_position => "beginning"
    }
}
output {
    if [type] == "access" {
        elasticsearch {
            hosts => ["192.168.52.110:9200","192.168.52.120:9200"]
            index => "apache_access-%{+YYYY.MM.dd}"
        }
    }
        if [type] == "error" {
        elasticsearch {
            hosts => ["192.168.52.110:9200","192.168.52.120:9200"]
            index => "apache_error-%{+YYYY.MM.dd}"
        }
    }
}
cd /etc/logstash/conf.d/
logstash -f apache_log.conf
此时浏览器访问http://192.168.52.130添加访问日志
浏览器访问 http://192.168.52.110:5601/登录 Kibana创建索引
Filebeat+ELK 部署
在 apache 节点上操作
安装 Filebeat
#上传软件包 filebeat-6.7.2-linux-x86_64.tar.gz 到/opt目录
tar zxvf filebeat-6.7.2-linux-x86_64.tar.gz
mv filebeat-6.7.2-linux-x86_64/ /usr/local/filebeat
设置 filebeat 的主配置文件
vim filebeat.yml

filebeat.prospectors:

- type: log         #指定 log 类型,从日志文件中读取消息
  enabled: true
  paths:
    - /var/log/messages       #指定监控的日志文件
    - /var/log/*.log
      tags: ["sys"]		#设置索引标签
      fields:           #可以使用 fields 配置选项设置一些参数字段添加到 output 中
        service_name: filebeat
        log_type: syslog
        from: 192.168.52.130

--------------Elasticsearch output-------------------
(全部注释掉)

----------------Logstash output---------------------
output.logstash:
  hosts: ["192.168.52.130:5044"]      #指定 logstash 的 IP 和端口

#启动 filebeat
nohup ./filebeat -e -c filebeat.yml > filebeat.out &
#-e:输出到标准输出,禁用syslog/文件输出
#-c:指定配置文件
#nohup:在系统后台不挂断地运行命令,退出终端不会影响程序的运行
在 Logstash 组件所在节点上新建一个 Logstash 配置文件
cd /etc/logstash/conf.d

vim filebeat.conf
input {
    beats {
        port => "5044"
    }
}
output {
    elasticsearch {
        hosts => ["192.168.52.110:9200","192.168.52.120:9200"]
        index => "%{[fields][service_name]}-%{+YYYY.MM.dd}"
    }
    stdout {
        codec => rubydebug
    }
}
#启动 logstash
logstash -f filebeat.conf
浏览器访问 http://192.168.52.130:5601 登录 Kibana,单击“Create Index Pattern”按钮添加索引“filebeat-*”,单击 “create” 按钮创建,单击 “Discover” 按钮可查看图表信息及日志信息。
此时再去添加索
Filter 插件
而对于 Logstash 的 Filter,这个才是 Logstash 最强大的地方。Filter 插件也非常多,我们常用到的 grok、date、mutate、mutiline 四个插件。
对于 filter 的各个插件执行流程,可以看下面这张图:

Filter常用插件的作用
grok :对若干个大文本字段进行再分割成一些小字段
date:对数据中的时间格式进行统一和格式化
mutate:对一些无用的字段进行剔除,或添加字段
mutiline :对多行数据进行统一编排,多行拆分
grok 插件
匹配格式:(?<字段名>正则表达式)
这里就要用到 logstash 的 filter 中的 grok 插件。filebeat 发送给 logstash 的日志内容会放到message 字段里面,logstash 匹配这个 message 字段就可以了。配置项如下所示:
示例1
(?<remote_addr>%{IPV6}|%{IPV4} )(?<other_info>.+)
#对数据进行分割ip字段名为remote_addr, 其他字段名为other_info
示例2
(?<remote_addr>%{IPV6}|%{IPV4} )[\s\-]+\[(?<log_time>.+)\](?<other_info>.+)
#添加匹配时间字段
示例3
#分割多个字段
(?<remote_addr>%{IPV6}|%{IPV4})[\s\-]+\[(?<log_time>.+)\]\s+\"(?<http_method>\S+)\s+(?<url-path>.+)\"\s+(?<rev_code>\d+)(?<other_info>.+)
将此正则写入配置文件对数据进行过滤
cd /etc/logstash/conf.d/
cp filebeat.conf filter.conf
vim filter.conf

input {
    beats {
        port => "5044"
    }
}
filter {
  grok {
     match =>["message","(?<remote_addr>%{IPV6}|%{IPV4} )[\s\-]+\[(?<log_time>.+)\]\s+\"(?<http_method>\S+)\s+(?<url-path>.+)\"\s+(?<rev_code>\d+)(?<other_info>.+)"]
  }
}
output {
    elasticsearch {
        hosts => ["192.168.52.110:9200","192.168.52.120:9200"]
        index => "{[filter][service_name]}-%{+YYYY.MM.dd}"
    }
    stdout {
        codec => rubydebug
    }
}
 logstash -f filter.conf#启动
此时在进入kibana查看并添加索引
添加索引
查看添加字段
边栏推荐
- JVM's responsibility - load and run bytecode
- Some query constructors in laravel (2)
- The phenomenology of crypto world: Pioneer entropy
- spoon插入更新oracle数据库,插了一部分提示报错Assertion botch: negative time
- 问题解决:AttributeError: ‘NoneType‘ object has no attribute ‘append‘
- 使用druid連接MySQL數據庫報類型錯誤
- Write a thread pool by hand, and take you to learn the implementation principle of ThreadPoolExecutor thread pool
- 【LeetCode】111. Minimum depth of binary tree (2 brushes of wrong questions)
- 如何做一个炫酷的墨水屏电子钟?
- [Yu Yue education] National Open University spring 2019 0505-22t basic nursing reference questions
猜你喜欢
Bumblebee: build, deliver, and run ebpf programs smoothly like silk
![[technology development-26]: data security of new information and communication networks](/img/13/10c8bd340017c6516edef41cd3bf6f.png)
[technology development-26]: data security of new information and communication networks

Three properties that a good homomorphic encryption should satisfy
![Hmi-32- [motion mode] add light panel and basic information column](/img/9c/0b25c0a41758652848aed2a269880f.jpg)
Hmi-32- [motion mode] add light panel and basic information column
![[Digital IC hand tearing code] Verilog edge detection circuit (rising edge, falling edge, double edge) | topic | principle | design | simulation](/img/9e/4c8557bb4b75b1e74598dedb24af86.jpg)
[Digital IC hand tearing code] Verilog edge detection circuit (rising edge, falling edge, double edge) | topic | principle | design | simulation
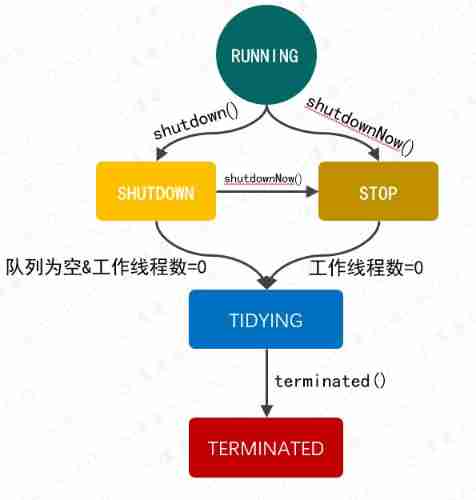
Write a thread pool by hand, and take you to learn the implementation principle of ThreadPoolExecutor thread pool
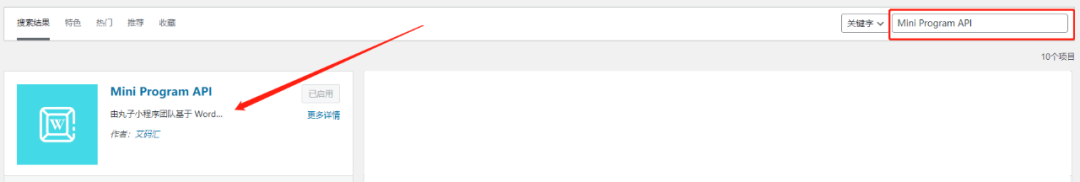
丸子百度小程序详细配置教程,审核通过。
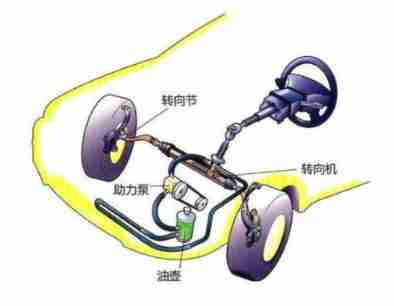
The steering wheel can be turned for one and a half turns. Is there any difference between it and two turns
Day_ 17 IO stream file class
Open source SPL optimized report application coping endlessly
随机推荐
openresty ngx_lua变量操作
The perfect car for successful people: BMW X7! Superior performance, excellent comfort and safety
JVM's responsibility - load and run bytecode
Yolov5 model training and detection
【附源码】基于知识图谱的智能推荐系统-Sylvie小兔
Limited query of common SQL operations
Cut! 39 year old Ali P9, saved 150million
Codeforces Global Round 19 ABC
Use the difference between "Chmod a + X" and "Chmod 755" [closed] - difference between using "Chmod a + X" and "Chmod 755" [closed]
力扣剑指offer——二叉树篇
Practical case of SQL optimization: speed up your database
Write a thread pool by hand, and take you to learn the implementation principle of ThreadPoolExecutor thread pool
Naacl 2021 | contrastive learning sweeping text clustering task
The perfect car for successful people: BMW X7! Superior performance, excellent comfort and safety
Grub 2.12 will be released this year to continue to improve boot security
Why do you understand a16z? Those who prefer Web3.0 Privacy Infrastructure: nym
Tla+ through examples (XI) -- propositional logic and examples
Luo Gu Pardon prisoners of war
Asynchronous and promise
[机缘参悟-38]:鬼谷子-第五飞箝篇 - 警示之一:有一种杀称为“捧杀”