当前位置:网站首页>Monitoring and management of JVM
Monitoring and management of JVM
2022-07-03 02:21:00 【Can't write code full】
Table of Contents
In common online problems , Most of us have the following problems :
Memory leak
A process suddenly cpu soaring
thread deadlock
Slow response ... And so on .
If we encounter the above problems , There are a variety of local tools to support viewing offline , But it's online , There are not so many local debugging tools to support , How can we locate problems based on monitoring tools ?
We usually locate based on data collection , And data collection is inseparable from the processing of monitoring tools , such as : Run log 、 Exception stack 、GC journal 、 Thread snapshot 、 Heap snapshot, etc . Frequent use of appropriate analysis and monitoring tools can speed up our analysis of data 、 Locate the speed of problem solving . Below we will introduce in detail .
One 、jvm Common monitoring tools & Instructions
1、 jps:jvm Process status tool
jps [options] [hostid] Copy code
If you don't specify hostid It defaults to the current host or server .
Command line parameter options are described as follows :
-q Do not output class name 、Jar Name and pass in main Method parameters - l Output main Class or Jar The full name of -m Output incoming main Method parameters - v Output incoming JVM Copy the parameters of the code
2、jstat: jvm Statistical information monitoring tools
jstat It is a command line tool used to see various running state information of virtual machine . It can show class loading in local or remote virtual machine processes 、 Memory 、 garbage collection 、jit Compile and other operation data , It's online positioning jvm Preferred tool for performance .
Command format :
jstat [ generalOption | outputOptions vmid [interval[s|ms] [count]] ] generalOption - Single common command line options , Such as -help, -options, or -version. outputOptions - One or more output options , By a single statOption Options make up , You can talk to -t, -h, and -J And so on . Copy code
Parameter options :
| Option | Displays | Ex |
|---|---|---|
| class | Used to view the statistics of class loading | jstat -class pid: According to load class The number of , And the space occupied . |
| compiler | see HotSpot The statistics of compiler compilation in | jstat -compiler pid: Show VM Information such as the number of real-time compilations . |
| gc | see JVM Statistics of garbage collection in the middle pile | jstat -gc pid: Can be displayed gc Information about , see gc The number of times , And time . The last five of them , Namely young gc The number of times ,young gc Time for ,full gc The number of times ,full gc Time for ,gc The total time of . |
| gccapacity | Check out the new generation 、 Storage capacity of old generation and permanent generation | jstat -gccapacity: Can be displayed ,VM Three generations in memory (young,old,perm) Object usage and occupancy size |
| gccause | Check the statistics of garbage collection ( This and -gcutil Options as ), If there is garbage collection , It also shows why garbage collection was last and is currently taking place . | jstat -gccause: Show gc reason |
| gcnew | Check out the new generation of garbage collection | jstat -gcnew pid:new Object information |
| gcnewcapacity | Used to view the storage capacity of the new generation | jstat -gcnewcapacity pid:new Object information and its usage |
| gcold | It is used to check the generation of the old generation and the generation of the permanent generation GC The situation of | jstat -gcold pid:old Object information |
| gcoldcapacity | Used to check the capacity of the old generation | jstat -gcoldcapacity pid:old Object information and its usage |
| gcpermcapacity | Used to view the capacity of persistent generation | jstat -gcpermcapacity pid: perm Object information and its usage |
| gcutil | Check out the new generation 、 Garbage collection of the old generation and the old generation | jstat -util pid: Statistics gc Information Statistics |
| printcompilation | HotSpot Statistics of compilation methods | jstat -printcompilation pid: At present VM Execution information |
for example :
see gc Situation implementation :jstat-gcutil 27777
3、jinfo: java Configuration information
Command format :
jinfo[option] pid Copy code
such as : Get some of the jvm Operation and startup information .
4、jmap: java Memory mapping tool
jmap The command is used for production heap rollover snapshot . Print out something java process ( Use pid) In memory , all ‘ object ’ The situation of ( Such as : Produce those objects , And quantity ).
Command format :
jmap [ option ] pid jmap [ option ] executable core jmap [ option ] [[email protected]]remote-hostname-or-IP Copy code
Parameter options :
-dump:[live,]format=b,file=<filename> Use hprof Binary form , Output jvm Of heap Content to file =. live The suboptions are optional , If you specify live Options , Then only output live objects to the file . -finalizerinfo Print the information of the object waiting to be recycled . -heap Print heap Summary information for ,GC The algorithm used ,heap Configuration and wise heap Usage situation . -histo[:live] Print each class Number of instances , Memory footprint , Class full name information . VM The inner class name of is prefixed with ”*”. If live Sub parameter plus , Count only the number of live objects . -permstat Print classload and jvm heap Long term information . Include each classloader Name , vivacity , Address , Father classloader And loaded class Number . in addition , Inside String The amount of memory used and the amount of memory used will also be printed out . -F Force . stay pid No corresponding time to use -dump perhaps -histo Parameters . In this mode ,live Invalid child argument . -h | -help Print auxiliary information -J Pass parameters to jmap Starting up jvm. Copy code
5、jhat:jvm Heap snapshot analysis tool
jhat Command and jamp Use it with , Used for analysis map Production heap fast storage snapshot .jhat Built in a micro http/Html The server , You can find that view in the browser . But try not to , Since there are dumpt file , It can be pulled down from the production environment , And then through the analysis of local visual chemical tools , This reduces the pressure on the online server , There is enough detail to analyze ( such as MAT/jprofile/visualVm) etc. .
6、jstack:java Stack trace tool
jstack Used to generate java A snapshot of the thread at the current moment in the virtual machine . The thread snapshot is current java A collection of method stacks that each thread in the virtual machine is executing , The primary purpose of generating a thread snapshot is to locate the cause of the long pause in the thread , Such as interthread deadlocks 、 Dead cycle 、 Long waits caused by requests for external resources, etc .
Command format :
jstack [ option ] pid jstack [ option ] executable core jstack [ option ] [[email protected]]remote-hostname-or-IP Copy code
Parameters :
-F When ’jstack [-l] pid’ There is no corresponding time to force the stack information to be printed -l A long list of . Print additional information about the lock , For example, belong to java.util.concurrent Of ownable synchronizers list . -m Print java and native c/c++ All stack information for the framework . -h | -help Print help pid The configuration information needs to be printed java process id, It can be used jps Inquire about . Copy code
Subsequent searches cost the most cpu The example will use .
Two 、 Visualization tools
Yes jvm Common visualization tools for monitoring , except jdk Provided by itself Jconsole and visualVm outside , And third party offers jprofilter,perfino,Yourkit,Perf4j,JProbe,MAT etc. . These tools have greatly enriched our positioning and optimization jvm The way .
The use of these tools , There are many tutorials available online , There's no more to it . about VisualVm Come on , Recommended for comparison , It's not only right jvm Less invasive than , still jdk The team developed , I believe that in the future, the functions will be more abundant and perfect .jprofilter For third party monitoring tools , The functions and visualization provided are the most perfect , At present most ide All support their plug-ins , For debugging and performance tuning before going online, you can use .
And for online dump Of heap Information , It should be pulled as far as possible to the offline for visual chemical analysis , This analysis is more detailed . If for some urgent problems , It has to be monitored online , May adopt VisualVm The remote function of , This requires the use of tool.jar Under the MAT function .
3、 ... and 、 application
1、cpu soaring
Sometimes on the line at some point , There may be a moment when the app suddenly cpu Soaring problems . We should be familiar with some instructions , Quickly check the corresponding code .
1. Find the most cost CPU The process of
Instructions :top Copy code
2. Finding the most expensive part of the process cpu The thread of
Instructions :top -Hp pid Copy code
3. Convert base
printf “%x\n” 15332 // transformation 16 Base number ( Converted to 0x3be4) Copy code
4. Filter the specified thread , Print stack information
 Instructions :
jstack pid |grep 'threadPid'  -C5 --color

jstack 13525 |grep '0x3be4'  -C5 --color  //   Print process stack   And through threads id, Filter to get thread stack information . Copy code
As you can see, it's an escalation procedure , Take up too much cpu 了 ( The above example is just an example , It costs cpu Not high )
2、 thread deadlock
Sometimes there is thread deadlock in deployment scenarios , But not often . At this time, we use jstack Take a look at . For example, we now have a thread deadlock program , Cause some operations waiting in .
1. lookup java process id
Instructions :top perhaps jps Copy code
2. see java Thread snapshot information of the process
Instructions :jstack -l pid Copy code
You can see from the output that , There is a thread deadlock , And pointed out that the line of code appeared . This allows you to quickly troubleshoot problems .
3、OOM Memory leak
java In the pile OOM Exception is a common memory overflow exception in practical application . Generally, we use the memory mapping analysis tool first ( such as MAT) Yes dump Out of the heap for analysis , Confirm if there is a problem with the object in memory .
Of course it appears OOM There are many reasons , It's not a case of insufficient application resources in the heap . It is also possible that too many resources have not been released , Or frequent applications , System resource depletion . I need to check all three cases one by one .
OOM Three situations of :
1. Application resources ( Memory ) Too small , Not enough use .
2. Too many resources to apply for , There is no release .
3. Too many resources to apply for , Run out of resources . such as : Too many threads , Thread memory is too large, etc .
1. Check the application resources .
Instructions :jmap -heap 11869 Copy code
Check out the new generation , Memory allocation and usage of old generation heap , See if it's too small .
From the above investigation , There is no problem with the memory requested by the program .
2. screening gc
especially fgc Under the circumstances , Memory of each generation .
Instructions :jstat -gcutil 11938 1000 Output once per second gc Generation memory allocation of , as well as gc Time replication code
3. Find the most memory consuming object
Instructions : jmap -histo:live 11869 | more Copy code
In the above output information , The maximum memory object is 161kb, In the normal range . If an object takes up a lot of space , Like more than 100Mb, We should focus on the analysis of , Why not release .
Be careful , The above instructions :
jmap -histo:live 11869 | more

 After performing , Can cause jvm To enforce once fgc, It is not recommended to use , You can take dump memory dump , Offline use of visual tools for analysis , More detailed .

jmap -dump:format=b,file=/tmp/dump.dat 11869

 Or use online operation and maintenance tools , Automated processing , Easy and fast positioning , Lost error time . Copy code
4. Confirm if resources are exhausted
pstree Look at the number of process threads
netstat Check the number of network connections
Or use :
ll /proc/${PID}/fd | wc -l // Number of open handles
ll /proc/${PID}/task | wc -l ( The effect is equal to pstree -p | wc -l) // Number of threads open
These are some common jvm Command application .
The application of a tool is not a master key , Cure all diseases , Problem solving often requires a combination of multiple tools to better position the problem , No matter what analytical tools are used , The most important thing is to be familiar with the strengths and weaknesses of each tool . In this way, we can learn from each other , In combination with .
Reference article
https://segmentfault.com/a/1190000009707894
Java object-oriented : The concept of object and three basic characteristics of object-oriented
Novice tutorial - It's not just technology that you learn , Is the dream !
Java The benefits of polymorphism _android_hl The blog of -CSDN Blog _ The benefits of polymorphism
边栏推荐
- GBase 8c系统表-pg_class
- 线程安全的单例模式
- MySQL learning 03
- Introduce in detail how to communicate with Huawei cloud IOT through mqtt protocol
- 内存池(内核角度理解new开辟空间的过程)
- Detailed analysis of micro service component sentinel (hystrix)
- Servlet中数据传到JSP页面使用el表达式${}无法显示问题
- easyPOI
- oauth2.0鉴权,登录访问 “/oauth/token”,请求头Authorization(basicToken)如何取值???
- 4. Classes and objects
猜你喜欢
![[shutter] hero animation (hero realizes radial animation | hero component createrecttween setting)](/img/e7/915404743d6639ac359bb4e7f7fbb7.jpg)
[shutter] hero animation (hero realizes radial animation | hero component createrecttween setting)
The use of Flink CDC mongodb and the implementation of Flink SQL parsing complex nested JSON data in monggo
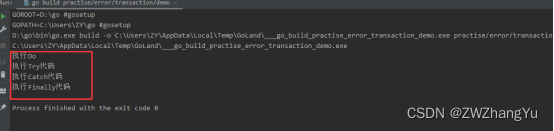
Use go language to realize try{}catch{}finally
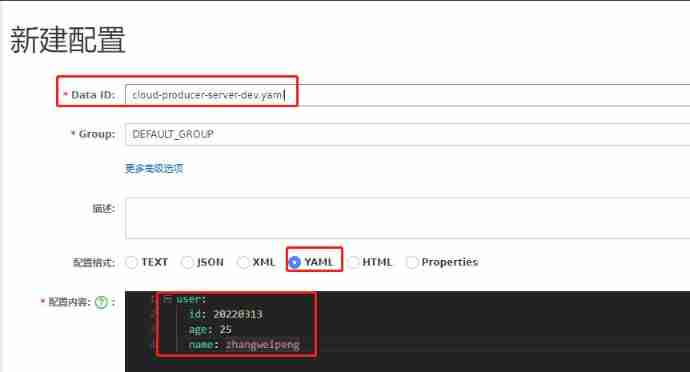
Detailed introduction to the usage of Nacos configuration center
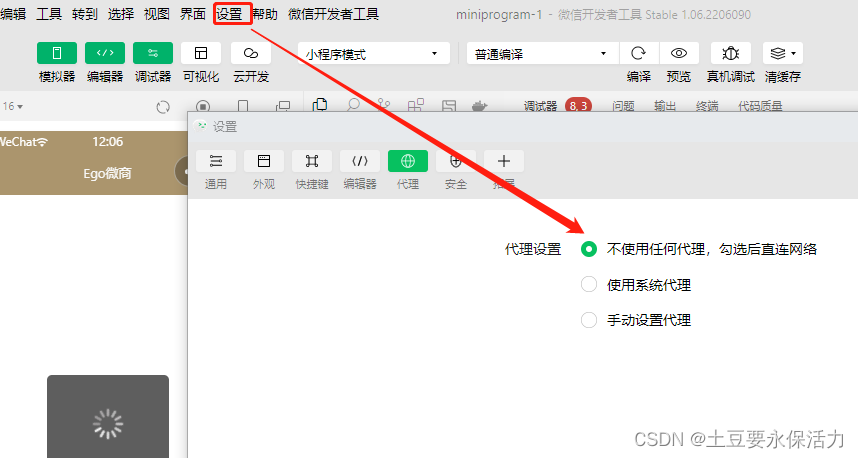
微信小程序開發工具 POST net::ERR_PROXY_CONNECTION_FAILED 代理問題
Tongda OA V12 process center
Flink CDC mongoDB 使用及Flink sql解析monggo中复杂嵌套JSON数据实现

Coroutinecontext in kotlin
![[shutter] pull the navigation bar sideways (drawer component | pageview component)](/img/6f/dfc9dae5f890125d0cebdb2a0f4638.gif)
[shutter] pull the navigation bar sideways (drawer component | pageview component)

Restcloud ETL cross database data aggregation operation
随机推荐
[Yu Yue education] China Ocean University job search OMG reference
Iptables layer 4 forwarding
Gbase 8C system table PG_ conversion
Awk from getting started to getting into the ground (3) the built-in functions printf and print of awk realize formatted printing
[shutter] bottom navigation bar implementation (bottomnavigationbar bottom navigation bar | bottomnavigationbaritem navigation bar entry | pageview)
Summary of ES6 filter() array filtering methods
Qt之QComboBox添加QCheckBox(下拉列表框插入复选框,含源码+注释)
微信小程序开发工具 POST net::ERR_PROXY_CONNECTION_FAILED 代理问题
Apple releases MacOS 11.6.4 update: mainly security fixes
Thread safe singleton mode
Unrecognized SSL message, plaintext connection?
Prohibited package name
How do it students find short-term internships? Which is better, short-term internship or long-term internship?
GBase 8c系统表-pg_authid
GBase 8c系统表-pg_amproc
GBase 8c系统表pg_cast
Detailed introduction to the usage of Nacos configuration center
Method of removing webpage scroll bar and inner and outer margins
Gbase 8C system table PG_ authid
Distributed transaction solution