当前位置:网站首页>Pointnet++ learning
Pointnet++ learning
2022-07-05 05:26:00 【Master Ma】
1、 Normalization and anti normalization of point cloud
The role of normalization :
After data normalization , The optimization process of the optimal solution will obviously become smooth , It's easier to converge to the optimal solution correctly
def pc_normalize(pc):
    """
     Normalize the point cloud data
    :param pc:  Normalized point cloud data is required
    :return:  Normalized point cloud data
    """
    #  Seeking the center of mass , That is, a translation amount , It's actually the mean value
    centroid = np.mean(pc, axis=0)
    pc = pc - centroid
    m = np.max(np.sqrt(np.sum(pc ** 2, axis=1)))
    #  Scale the point cloud
    pc = pc / m
    return pc
def np.mean(a, axis=None, dtype=None, out=None, keepdims=np._NoValue, *,
         where=np._NoValue):
"""
 Calculates the arithmetic mean along the specified axis
Parameters:
a: Point cloud data to be calculated
axis: Specify axis
	 axis=0: Yes a Average each column of the array
	 axis=1: Yes a Average each row of the array
"""
Inverse normalization of point cloud :
Due to the normalization operation of point cloud , Will make PointNet The predicted result is different from the original point cloud size , In order to restore the original size , The predicted point cloud can be de normalized , Even if the resulting point cloud is multiplied by the scaling size m, Plus the translation dimension centroid.
ret = pred × m + centroid
2、os.path.join() function
os.path.join() Path function is used to splice path files , Multiple parameters can be passed in .
3、Python rstrip() Method
Python rstrip() Delete string The specified character at the end of the string , The default is white space , Including Spaces 、 A newline 、 A carriage return 、 tabs .
4、 How to do sample( sampling ) ?
PointNet++ a PointNet The main improvement of is to introduce the idea of local features : Put the whole big point cloud P Divided into overlap Small cloud , Separate use PointNet Feature extraction of small point cloud .Sample( The purpose of sampling ) Is to select the representative points of the above small cloud ( Center point ), The way of implementation here is FPS(fathest point sampling):
a. There are two sets A = {}, B = P
b. Random selection B One of the points x Join in A, And from B Delete point in x
c. Calculation B Every point in z To A The distances of all points in the are obtained z_1, z_2, …, z_len(A), choice min(z_1, z_2, …, z_len(A) Record as point z To the assembly A Distance of ;
d. from B Select distance set in A The farthest point y, Add to set A, And from B Delete point y.
e. repeat c, d Until the assembly A The number of midpoint meets the preset threshold .
Is it the same as that in graph theory Dijkstra The algorithm is very similar , It's just Dijkstra The algorithm seeks the shortest distance . Let's use a two-dimensional diagram to show more intuitively sample Purpose : The left figure shows the input points , The right figure shows the use of FPS The center point obtained by algorithm sampling ( Red inverted triangle ). These center points will be used for the following group operation .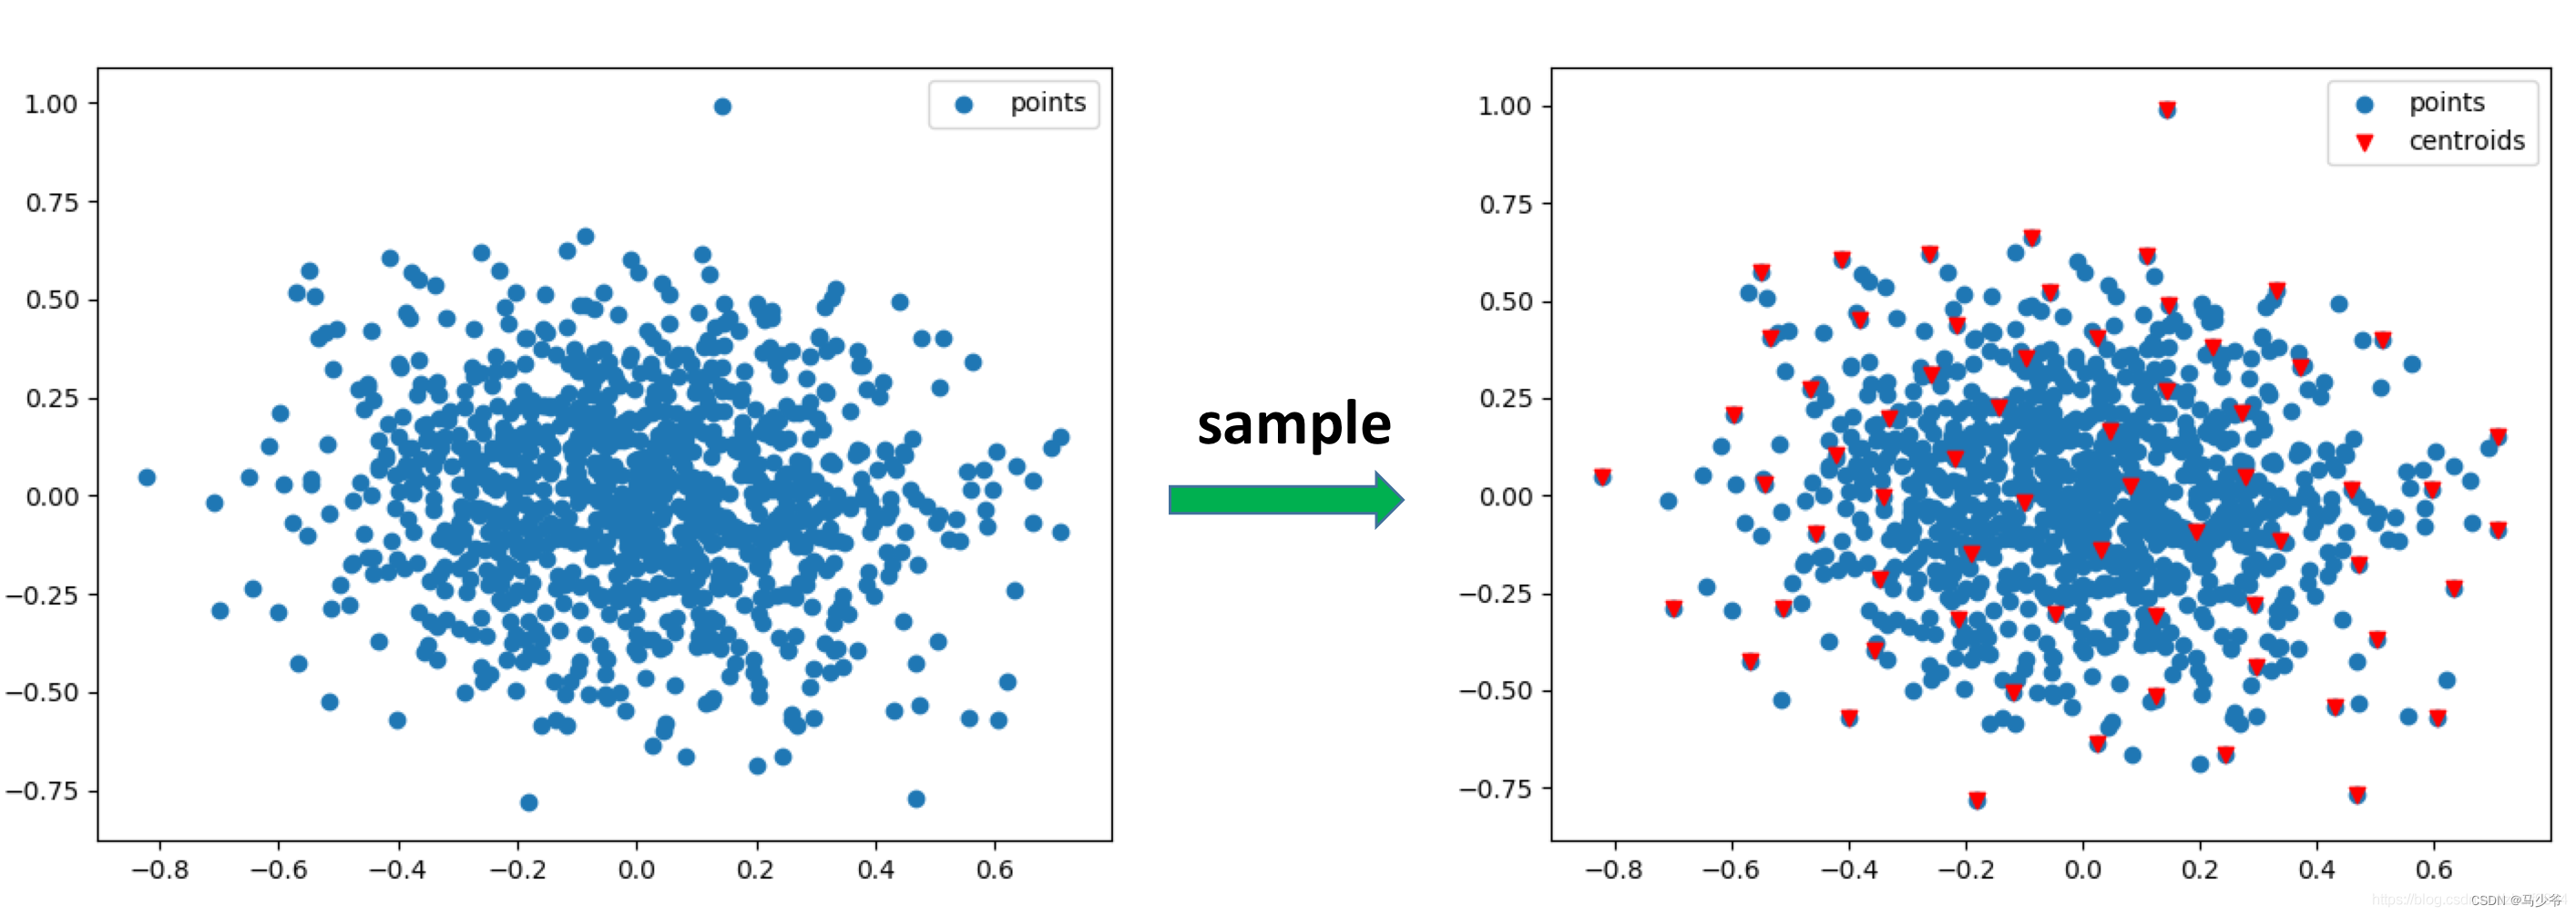
sample Code for (fps Algorithm ) The code for is as follows , Part is the implementation of vectorization , And there are some skills in the implementation ; It is suggested that you first think about how to use code to realize the above fps Algorithm :
input and output What are the differences ? Input: Point set xyz shape=(B, N, 3), Number of center points M; Output: M Coordinate or index of the center point centroids, shape=(B, M, 3) or (B, M). The index value is returned in the code .
If not for Cycle to compare distances , How to realize ? If it's not easy to write , Take a look at the code implementation below .
How to realize points in a point set - Vectorization calculation of point distance ? There is a hole in the implementation here , When dist=0 when , It is possible that 1e-8 And other small values , But there is no error in the root sign , So a better way is to use square distance , Or use torch.where Filter the distance equals 0 Value .
def get_dists(points1, points2):
    '''
    Calculate dists between two group points
    :param cur_point: shape=(B, M, C)
    :param points: shape=(B, N, C)
    :return:
    '''
    B, M, C = points1.shape
    _, N, _ = points2.shape
    dists = torch.sum(torch.pow(points1, 2), dim=-1).view(B, M, 1) + \
            torch.sum(torch.pow(points2, 2), dim=-1).view(B, 1, N)
    dists -= 2 * torch.matmul(points1, points2.permute(0, 2, 1))
    dists = torch.where(dists < 0, torch.ones_like(dists) * 1e-7, dists) # Very Important for dist = 0.
    return torch.sqrt(dists).float()

def fps(xyz, M):
    '''
    Sample M points from points according to farthest point sampling (FPS) algorithm.
    :param xyz: shape=(B, N, 3)
    :return: inds: shape=(B, M)
    '''
    device = xyz.device
    B, N, C = xyz.shape
    centroids = torch.zeros(size=(B, M), dtype=torch.long).to(device)
    dists = torch.ones(B, N).to(device) * 1e5
    inds = torch.randint(0, N, size=(B, ), dtype=torch.long).to(device)
    batchlists = torch.arange(0, B, dtype=torch.long).to(device)
    for i in range(M):
        centroids[:, i] = inds
        cur_point = xyz[batchlists, inds, :] # (B, 3)
        cur_dist = torch.squeeze(get_dists(torch.unsqueeze(cur_point, 1), xyz))
        dists[cur_dist < dists] = cur_dist[cur_dist < dists]
        inds = torch.max(dists, dim=1)[1]
    return centroids
5、 How to do group ?
after sample operation , We've got a little cloud P in M A central point ,group The operation of is based on each central point centroid For the center of a circle , Manually set the radius r, The points inside each circle serve as a local area , Then use the next PointNet The extracted features . What needs to be noted here is , For convenience batch operation , The number of points in each local area is consistent , All for K, If the number of points in a circle is less than K, Then the points in the circle can be sampled repeatedly , Reach the quantity K; If the number of points in a region is greater than K, So random selection K A little bit , that will do .group The result of the operation is shown in the figure below , Many small local areas can be formed 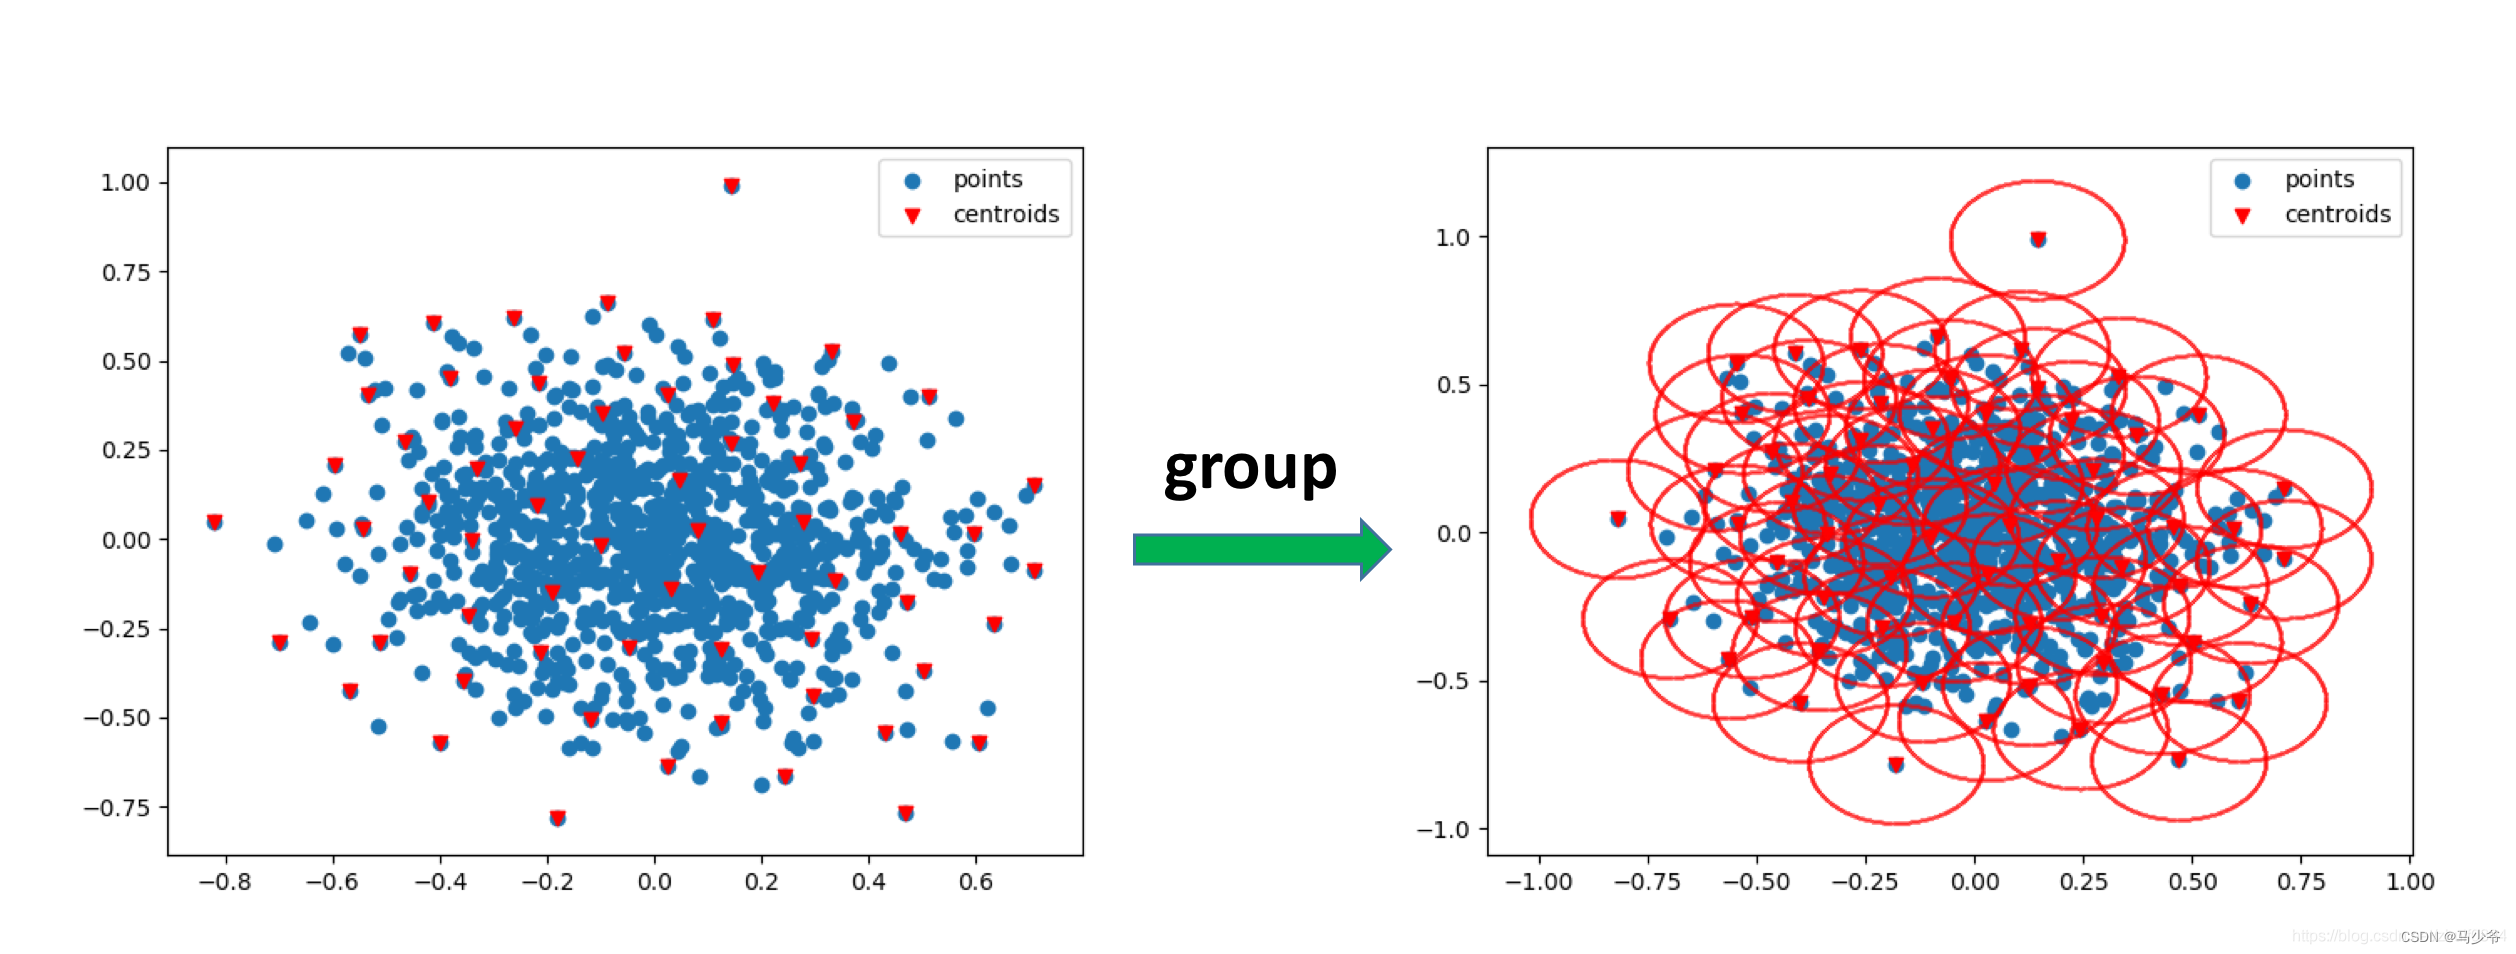
Group How to write your code ? First of all, we have to consider the problem clearly :
group What are the inputs and outputs of ? Input : Complete point cloud (B, N, 3), Center point (B, M), radius r, The quantity mentioned above K; Output : Many local point clouds (B, M, K, 3) Or its index (B, M, K), The index value is returned in the following code , shape by (B, M, K)
The difficulty lies in the choice of vectorization implementation K A little bit : Greater than... In the circle K And less than K How does time work .
Specific code reference is as follows :
def gather_points(points, inds):
    '''
    :param points: shape=(B, N, C)
    :param inds: shape=(B, M) or shape=(B, M, K)
    :return: sampling points: shape=(B, M, C) or shape=(B, M, K, C)
    '''
    device = points.device
    B, N, C = points.shape
    inds_shape = list(inds.shape)
    inds_shape[1:] = [1] * len(inds_shape[1:])
    repeat_shape = list(inds.shape)
    repeat_shape[0] = 1
    batchlists = torch.arange(0, B, dtype=torch.long).to(device).reshape(inds_shape).repeat(repeat_shape)
    return points[batchlists, inds, :]

def ball_query(xyz, new_xyz, radius, K):
    '''
    :param xyz: shape=(B, N, 3)
    :param new_xyz: shape=(B, M, 3)
    :param radius: int
    :param K: int, an upper limit samples
    :return: shape=(B, M, K)
    '''
    device = xyz.device
    B, N, C = xyz.shape
    M = new_xyz.shape[1]
    grouped_inds = torch.arange(0, N, dtype=torch.long).to(device).view(1, 1, N).repeat(B, M, 1)
    dists = get_dists(new_xyz, xyz)
    grouped_inds[dists > radius] = N
    grouped_inds = torch.sort(grouped_inds, dim=-1)[0][:, :, :K]
    grouped_min_inds = grouped_inds[:, :, 0:1].repeat(1, 1, K)
    grouped_inds[grouped_inds == N] = grouped_min_inds[grouped_inds == N]
    return grouped_inds
6、Pointnet How to extract features ?
After sample and group operation , The whole big point cloud is divided into many overlap Small cloud , The whole complete point cloud can be expressed as shape=(B, M, K, C0) Of tensor, M Indicates the number of center points , K Represents the number of points selected in the sphere neighborhood of each central point , C0 It's a feature dimension , Initial input point C0=3 or C0=6( add normal Information ). The next step is to use PointNet For every little cloud P’(shape=(K, C0)) Feature extraction . Yes, little cloud P’ Each point in is continuous 1d Convolution + bn + relu operation , Learn the characteristics of each point , Last in K Pool the maximum and average values on the channel , Get the characteristics of the current small point cloud F(shape=(C, )), There is no direct use when implementing here nn.Conv1d, It USES nn.Conv2d, kernel size=1, The essence should be the same . Every little cloud P’(K, C0) after PointNet Get the feature F(C, ), So one batch The data of (shape=(B, M, K, C0)), after PointNet After module , You will get a dimension of (B, M, C) Characteristics of . This part of the code is relatively simple , Namely PyTorch General operation of , Part of the code is as follows :
self.backbone = nn.Sequential()
        for i, out_channels in enumerate(mlp):
            self.backbone.add_module('Conv{}'.format(i),
                                     nn.Conv2d(in_channels, out_channels, 1,
                                               stride=1, padding=0, bias=False))
            if bn:
                self.backbone.add_module('Bn{}'.format(i),
                                         nn.BatchNorm2d(out_channels))
            self.backbone.add_module('Relu{}'.format(i), nn.ReLU())
            in_channels = out_channels
Above is a set abstraction Operation . PointNet++ Yes, there is 3 Time set abstraction Operation of the :
for the first time : (B, N, C0) -> (B, M1, C1) , C0 = 3 or C0=6( add normal Information )
The second time : (B, M1, C1+3) -> (B, M2, C2)
third time : (B, M2, C2+3) -> (B, C3)
Here's a detail , You can see C1 and C2 It's all followed by 3, This is to add location information on the basis of learning features (x, y, z), Send it again as a new feature PointNet The Internet .
7、 How does the classification task operate after extracting features ,loss What is it? ?
After extracting the features of each point cloud (C3, ) after , Next, it is the same as the classification task in the image ,C3 The feature of dimension is used as input , Then through two full connection layers and a classification layer ( The classification layer is the full connection layer with output nodes equal to the number of categories ), Output the probability of each class .
The loss function adopts the cross entropy loss function , Corresponding PyTorch Medium nn.CrossEntropy().
8、 How to upsample in segmentation tasks , loss What is it? ?
Segmentation task requires point cloud P Classify each point in , and PointNet++ Medium set abstraction because sampling The operation reduces the input point cloud P Number of points in , How to conduct up sampling to restore the number of point clouds at the time of input ?
In the image segmentation task , In order to restore the resolution of the image , It is often operated by deconvolution or interpolation , How to restore the number of point clouds in point clouds ?
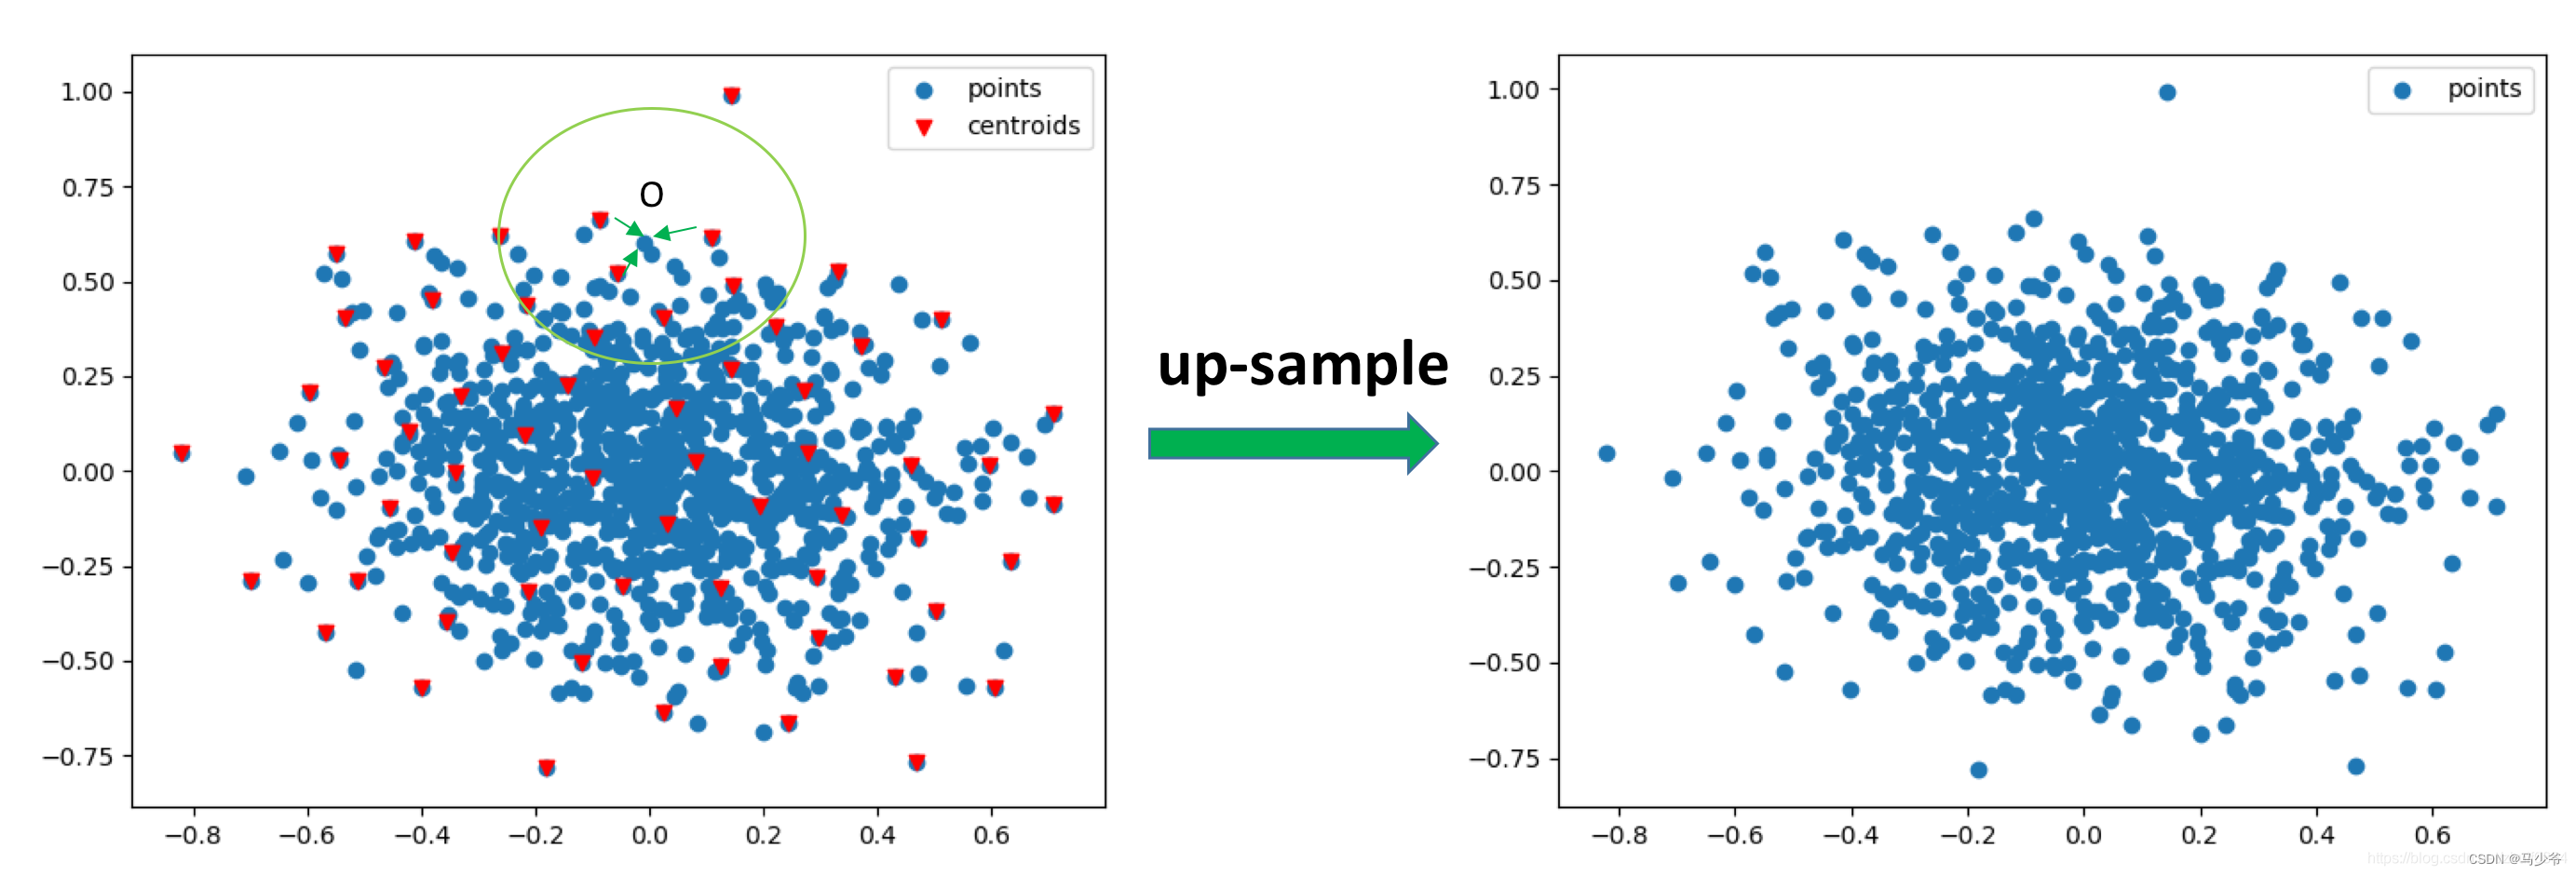
Actually , stay PointNet++ Medium set abstraction In the module , Current point cloud Q And the point cloud after down sampling Q’ The point position information in the is always saved , Point cloud upsampling takes advantage of this feature . Here we use the two-dimensional diagram to explain intuitively , The red inverted triangle in the left figure below represents the point cloud after down sampling Q’, The blue point cloud represents the point cloud before down sampling Q, The upper sampling in the point cloud is used PointNet Point cloud after learning Q’ The feature of represents the point cloud before down sampling Q Characteristics of . The way is k Nearest neighbor algorithm , In the paper k=3. As shown in the figure , about Q Every point in the O, stay Q’ Find its nearest k A little bit , Based on distance weighting ( distance O near , Its power is great ; distance O far , Its power is great ) Sum this k Points are represented by the characteristics of points O Characteristics of , The specific calculation method is :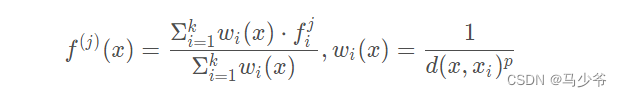
Upper sampling got C’ Dimension characteristics , And the number of points has been restored to the number before the next sampling ; take C’ The characteristics of dimension and set abstraction Point clouds with the same number of points in ( Symmetrical position ) features (C dimension ) Go ahead concat operation , Then carry out multiple Conv1d + Bn + ReLU operation , Get new features .
After three sampling operations , The point cloud restores the number of points in the initial input point cloud , Once again conv1d + bn + relu layer And a peer-to-peer classification layer , Finally, we get the classification of each point .
Of the upper sampling part PyTorch The implementation code is as follows :
def three_nn(xyz1, xyz2):
    '''

    :param xyz1: shape=(B, N1, 3)
    :param xyz2: shape=(B, N2, 3)
    :return: dists: shape=(B, N1, 3), inds: shape=(B, N1, 3)
    '''
    dists = get_dists(xyz1, xyz2)
    dists, inds = torch.sort(dists, dim=-1)
    dists, inds = dists[:, :, :3], inds[:, :, :3]
    return dists, inds


def three_interpolate(xyz1, xyz2, points2):
    '''

    :param xyz1: shape=(B, N1, 3)
    :param xyz2: shape=(B, N2, 3)
    :param points2: shape=(B, N2, C2)
    :return: interpolated_points: shape=(B, N1, C2)
    '''
    _, _, C2 = points2.shape
    dists, inds = three_nn(xyz1, xyz2)
    inversed_dists = 1.0 / (dists + 1e-8)
    weight = inversed_dists / torch.sum(inversed_dists, dim=-1, keepdim=True) # shape=(B, N1, 3)
    weight = torch.unsqueeze(weight, -1).repeat(1, 1, 1, C2)
    interpolated_points = gather_points(points2, inds)  # shape=(B, N1, 3, C2)
    interpolated_points = torch.sum(weight * interpolated_points, dim=2)
    return interpolated_points
9、 With tensor analysis PointNet++ How do dimensions and dimensions change in the network ?
Backbone network :
Input data(B, N, 6) -> Set Abstraction[sample(B, 512, 3) -> group(B, 512, 32, 6) -> PointNet(B, 512, 32, 128) -> Pooling(B, 512, 128)] -> Set Abstraction[sample(B, 128, 3) -> group(B, 128, 64, 128 + 3) -> PointNet(B, 128, 64, 256) -> Pooling(B, 128, 256) ] -> Set Abstraction[sample(B, 1, 3) -> group(B, 1, 128, 256 + 3) -> PointNet(B, 1, 128, 1024) -> Pooling(B, 1, 1024)] -> Features(B, 1, 1024)
Classification module :
Features(B, 1024) -> FC(B, 512) -> FC(B, 256) -> Output(B, n_clsclasses)
Segmentation module :
Features(B, 1, 1024) -> FP[unsapmling(B, 128, 1024) -> concat(B, 128, 1024+256)->PointNet(B, 128, 256)]
-> FP(unsampling(B, 512, 256) -> concat(B, 512, 256+128) -> PointNet(B, 512, 128))
-> FP(unsampling(B, N, 128) -> concat(B, N, 128+6)->PointNet(B, N, 128))
-> Conv1d(B, N, 128) -> Conv1d(B, N, n_segclasses)
If the above modules can be understood clearly and can write code , be based on PyTorch Of PointNet++ The network can be realized .
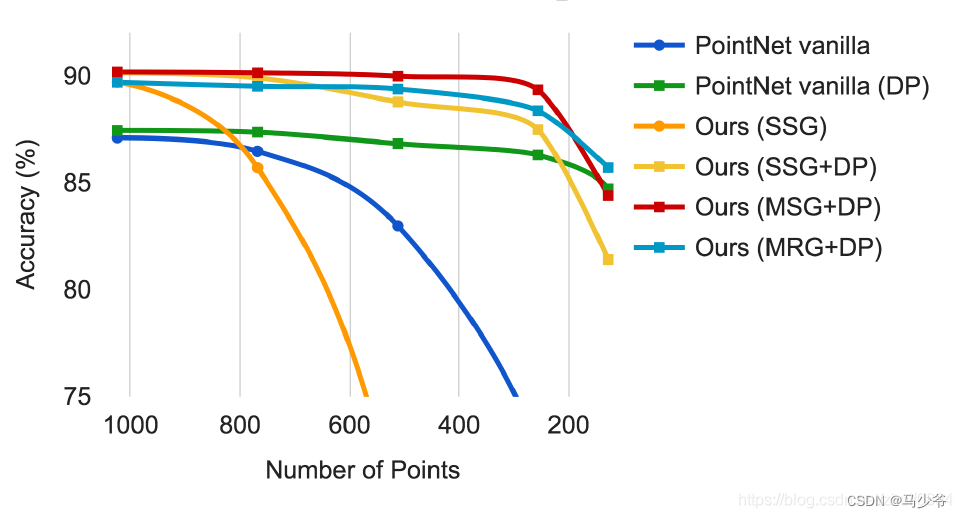
10、PointNet++ Of MSG, MRG framework ?
The above article mainly introduces PointNet++ Of SSG(single scale grouping), In order to solve the problem of uneven density distribution in point clouds , The author puts forward MSG(multi-scale grouping) and MRG(multi resolution grouping). The following picture is the picture in the author's paper ( stay ModelNet40 Experiments on datasets ), Tested PointNet, SSG, MSG, MRG Performance of , The abscissa represents the number of points in the point cloud at the prediction time , The ordinate represents the accuracy . As you can see from the diagram , When the number of points is large ,SSG, MRG, MSG Similar performance , Significantly higher than PointNet; But as the number of points in the point cloud decreases , There are two lines of obvious decline in accuracy , There are four lines with a slight downward trend . The obvious decline of the two lines is not taken DP Strategic . Even if it's PointNet The network is taking DP After the strategy , Its performance is less than 600 It will also be significantly higher than SSG.. thus it can be seen ,DP It plays an important role in solving the uneven density of point clouds , and MSG, MRG It seems not so important ? Here is a brief introduction MSG Thought .
MSG It means every time Set Abstraction When , At a certain central point centroid Conduct group Use different sizes when operating ( for example 0.1, 0.2, 0.4, SSG Only 0.2) The radius of , To get local areas of different sizes , Send them to different PointNet In the network , Finally, these learned features of different scales are concat Operation to represent the current center point centroid The operation of .
How does point cloud enhance data ?
Point clouds are different from images , There is random cropping in the image 、 The zoom 、 Color jitter and other data enhancement methods . In the point cloud , How to do data enhancement ?
The data enhancement of point cloud mainly includes : Random rotation , Random translation , Random jitter, etc , Specific implementation code reference :
DP What's the usage? , How did it happen ?
DP It refers to randomly discarding some input points during training (DP means random input dropout during training), Such a training method is more effective for predicting low-density point clouds ( Relative to the input point cloud ), That is, the model trained in high-density point clouds , Make predictions in low-density point clouds , It can achieve the same effect as the training concentration . say concretely , Manually set the super parameters p( In the paper p=0.95), from [0, p] Randomly choose a value dr(drouout ratio), For every point in the point cloud , Randomly produce a 0-1 Value , If the value is less than or equal to dr It means that the point is discarded . Here's a detail , After some points are discarded , Every batch The number of points in is different , To solve this problem , All lost points are replaced by the first point , In this way, every batch The number of midpoint is the same . The specific implementation code is as follows ( In code p=0.875):
def random_point_dropout(pc, max_dropout_ratio=0.875):
    dropout_ratio =  np.random.random()*max_dropout_ratio # 0~0.875
    drop_idx = np.where(np.random.random((pc.shape[0]))<=dropout_ratio)[0]
    if len(drop_idx)>0:
        pc[drop_idx,:] = pc[0,:] # set to the first point
    return pc
Reference link :https://blog.csdn.net/zhulf0804/article/details/108530499
边栏推荐
- 读者写者模型
- Acwing 4300. Two operations
- [转]:Apache Felix Framework配置属性
- Web APIs DOM节点
- [trans]: spécification osgi
- Haut OJ 1347: addition of choice -- high progress addition
- Animation scoring data analysis and visualization and it industry recruitment data analysis and visualization
- A new micro ORM open source framework
- kubeadm系列-00-overview
- Yolov5 adds attention mechanism
猜你喜欢
利用HashMap实现简单缓存
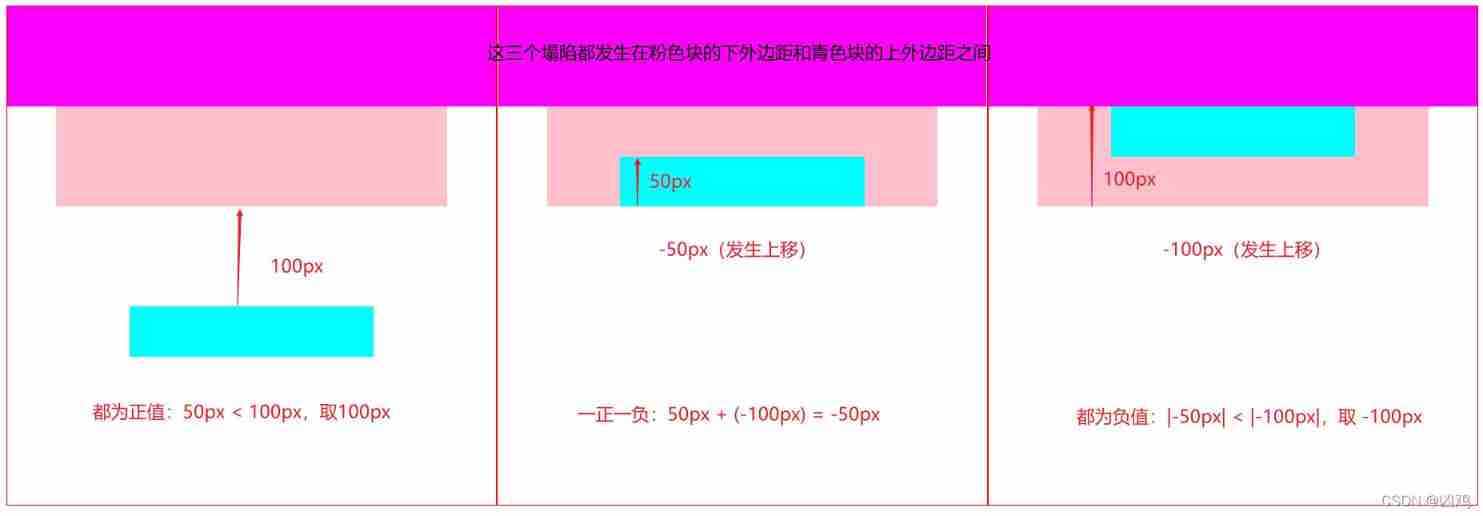
Collapse of adjacent vertical outer margins

The present is a gift from heaven -- a film review of the journey of the soul
On-off and on-off of quality system construction
![[转]: OSGI规范 深入浅出](/img/54/d73a8d3e375dfe430c2eca39617b9c.png)
[转]: OSGI规范 深入浅出
剑指 Offer 53 - II. 0~n-1中缺失的数字
Hang wait lock vs spin lock (where both are used)
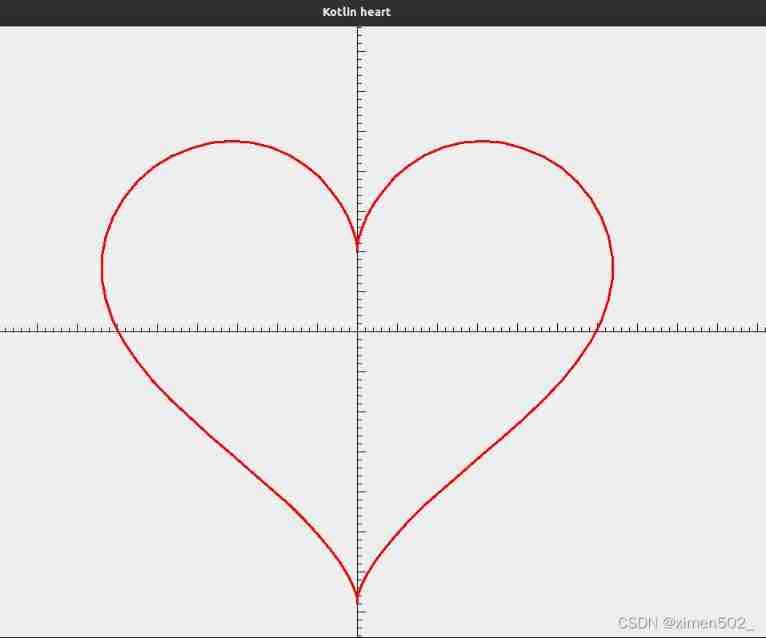
Romance of programmers on Valentine's Day
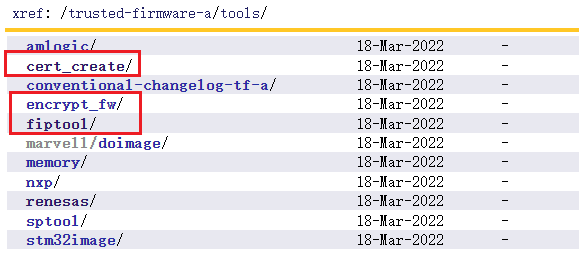
TF-A中的工具介绍
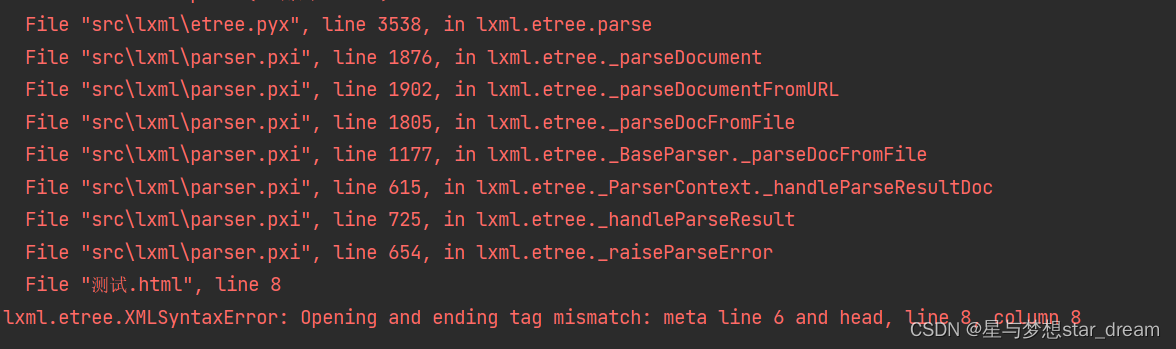
lxml. etree. XMLSyntaxError: Opening and ending tag mismatch: meta line 6 and head, line 8, column 8
随机推荐
利用HashMap实现简单缓存
用STM32点个灯
Drawing dynamic 3D circle with pure C language
[merge array] 88 merge two ordered arrays
When will Wei Lai, who has been watched by public opinion, start to "build high-rise buildings" again?
Pointnet++的改进
Use of room database
挂起等待锁 vs 自旋锁(两者的使用场合)
游戏商城毕业设计
[turn to] MySQL operation practice (III): table connection
[paper notes] multi goal reinforcement learning: challenging robotics environments and request for research
Reader writer model
PMP考试敏捷占比有多少?解疑
Csp-j-2020-excellent split multiple solutions
Zzulioj 1673: b: clever characters???
PMP candidates, please check the precautions for PMP examination in July
C language Essay 1
Chapter 6 data flow modeling - after class exercises
[转]MySQL操作实战(一):关键字 & 函数
Merge sort