In this paper , We will discuss how to design a scalable index monitoring and warning system . A good monitoring and warning system , Observability of infrastructure , High availability , Reliability plays a key role .
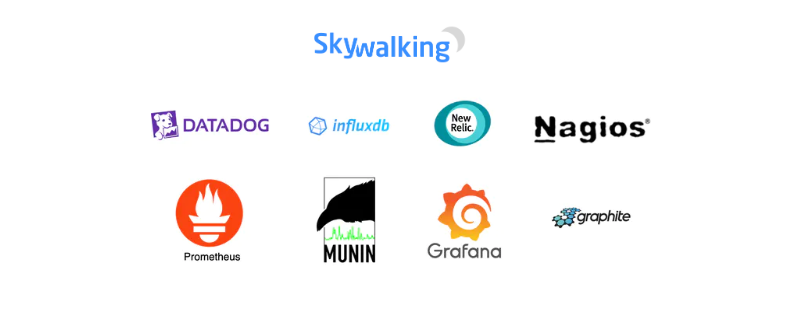
The following figure shows some popular indicator monitoring and alarm services in the market .
Next , We will design a similar service , It can be used inside large companies .
The design requirements
Start with a story about Xiao Ming's interview .

interviewer : If you are asked to design an indicator monitoring and alarm system , What would you do ?
Xiao Ming : well , This system is for internal use , Or design image Datadog such SaaS service ?
interviewer : Good question , At present, this system is only used internally .
Xiao Ming : What indicator information do we want to collect ?
interviewer : Including the index information of the operating system , Middleware metrics , And the running application services qps These indicators .
Xiao Ming : How large is the infrastructure we monitor with this system ?
interviewer :1 100 million active users ,1000 Server pools , Each pool 100 Taiwan machine .
Xiao Ming : How long does the index data need to be saved ?
interviewer : We want to keep it for a year .
Xiao Ming : ok , For long-term storage , Can the resolution of index data be reduced ?
interviewer : Good question , For the latest data , Will save 7 God ,7 It can be reduced to 1 Minute resolution , And then 30 After heaven , May, in accordance with the 1 Hour resolution for further summary .
Xiao Ming : Which alarm channels are supported ?
interviewer : mail , electric nailing , Enterprise WeChat ,Http Endpoint.
Xiao Ming : Do we need to collect logs ? There is also the need to support link tracking in distributed systems ?
interviewer : Currently focusing on indicators , Others are not considered for the time being .
Xiao Ming : well , Probably understand .
To sum up , The infrastructure being monitored is large , And indicators that need to support various dimensions . in addition , The overall system also has higher requirements , Consider scalability , Low latency , Reliability and flexibility .
Basic knowledge of
An indicator monitoring and alarm system usually consists of five components , As shown in the figure below
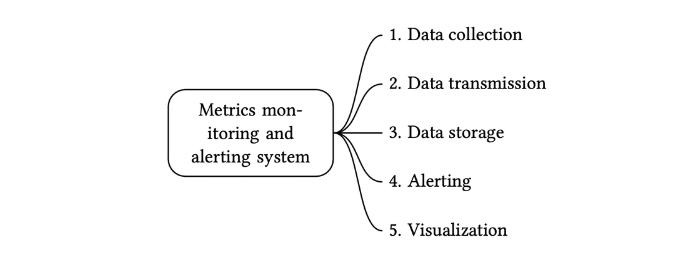
- data collection : Collect indicator data from different data sources .
- The data transfer : Send the index data to the index monitoring system .
- data storage : Store metrics .
- The alarm : Analyze the received data , When an abnormality is detected, an alarm notification can be sent .
- visualization : Visualization page , In graphics , Present data in the form of charts .
Data patterns
Indicator data is usually saved as a time series , It contains a set of values and their associated timestamps .
The sequence itself can be uniquely identified by name , It can also be identified by a group of labels .
Let's look at two examples .
Example 1: Production server i631 stay 20:00 Of CPU What's the load ?

The data points marked in the above figure can be represented in the following format

In the example above , The time series consists of the index name , label (host:i631,env:prod), The timestamp and the corresponding value constitute .
Example 2: In the past 10 Within minutes, all in Shanghai Web The average number of servers CPU What's the load ?
conceptually , We will find something similar to the following
CPU.load host=webserver01,region=shanghai 1613707265 50

CPU.load host=webserver01,region=shanghai 1613707270 62

CPU.load host=webserver02,region=shanghai 1613707275 43
We can calculate the average by the value at the end of each line above CPU load , The above data format is also called row Protocol . It is the input format commonly used by many monitoring software on the market ,Prometheus and OpenTSDB There are two examples .
Each time series contains the following :
- Index name , String type metric name .
- An array of key value pairs , Label indicating the indicator ,List<key,value>
- An array containing time stamps and corresponding values ,List <value, timestamp>
data storage
Data storage is the core of design , It is not recommended to build your own storage system , Nor is it recommended to use a conventional storage system ( such as MySQL) To finish the work .
In theory , Conventional databases can support time series data , But it requires expert level tuning of the database , To meet the needs of scenarios with a large amount of data .
Specifically speaking , Relational databases do not optimize time series data , There are several reasons
- Calculate the average value in the rolling time window , Need to write complex and difficult to read SQL.
- To support labels (tag/label) data , We need to add an index to each tag .
- by comparison , Relational databases do not perform well in continuous high concurrency write operations .
that NoSQL ? ? Theoretically , A few in the market NoSQL Database can effectively process time series data . such as Cassandra and Bigtable Fine . however , Want to meet the needs of efficient storage and query of data , And building scalable systems , Need to understand each NoSQL How it works inside .
by comparison , Time series database specially optimized for time series data , More suitable for this kind of scene .
OpenTSDB It's a distributed temporal database , But because it's based on Hadoop and HBase, function Hadoop/HBase Clustering also brings complexity .Twitter Used MetricsDB Time series database stores index data , And Amazon offers Timestream Time series database service .
according to DB-engines The report of , The two most popular time series databases are InfluxDB and Prometheus , They can store a large amount of time series data , And support the real-time analysis of these data quickly .
As shown in the figure below ,8 nucleus CPU and 32 GB RAM Of InfluxDB Can handle over per second 250,000 Time to write .

High level design
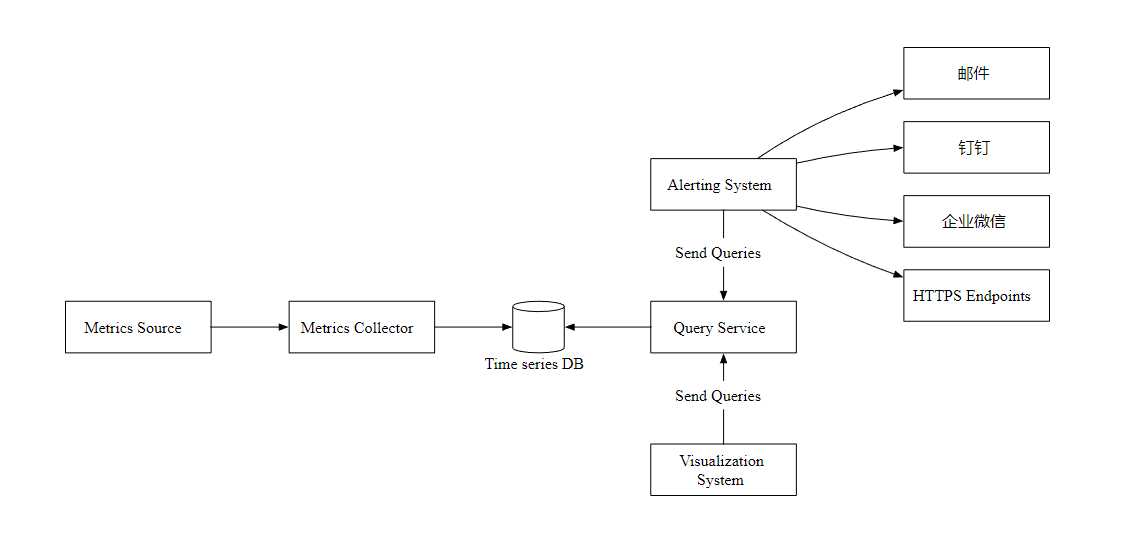
- Metrics Source Source of indicators , Application service , database , Message queuing, etc .
- Metrics Collector Indicator collector .
- Time series DB Time series database , Store metrics .
- Query Service Query service , Provide index query interface .
- Alerting System The alarm system , When an exception is detected , Send alert notification .
- Visualization System visualization , Show the indicators in the form of charts .
In depth design
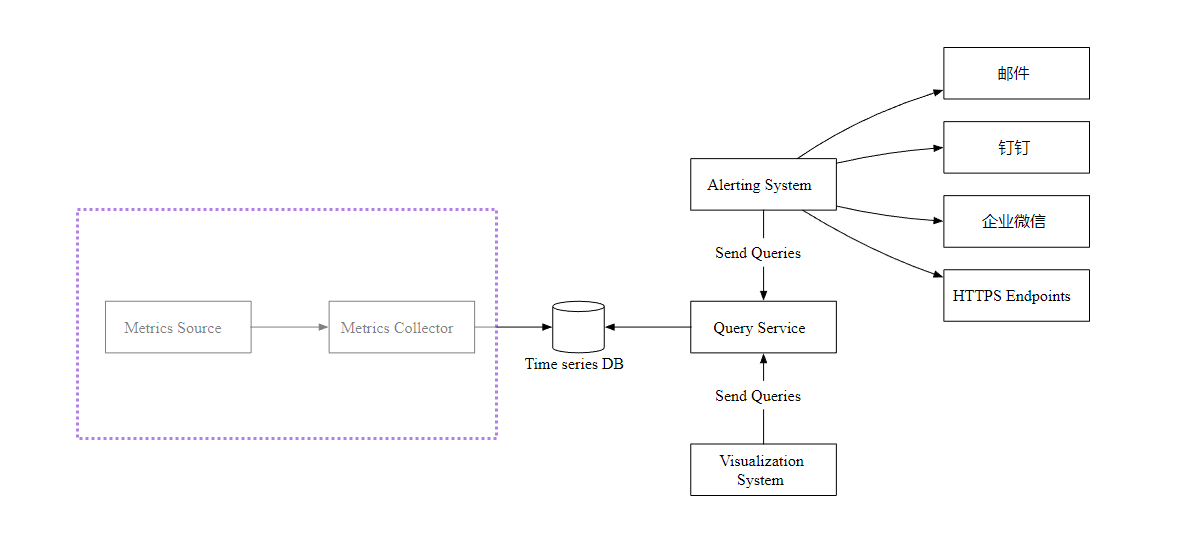
Now? , Let's focus on the data collection process . There are mainly two ways of pushing and pulling .
Pull mode
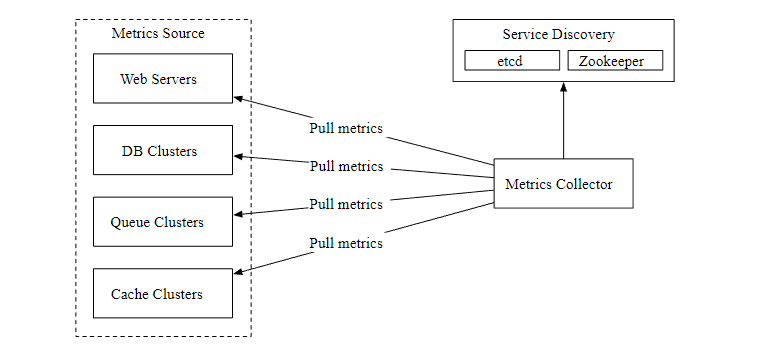
The figure above shows data collection using pull mode , The data collector is set separately , Regularly pull index data from running applications .
Here's a question , How does the data collector know the address of each data source ? A better solution is to introduce the service registration and discovery component , such as etcd,ZooKeeper, as follows

The following figure shows our current data pull process .

- The indicator collector obtains metadata from the service discovery component , Including pulling interval ,IP Address , Overtime , Retry parameters, etc .
- The indicator collector passes the set HTTP Endpoint obtains indicator data .
In a scenario with a large amount of data , A single indicator collector is difficult to support , We must use a set of indicator collectors . But how should multiple collectors and multiple data sources coordinate , In order to work normally without conflict ?
Consistent hashing is very suitable for this scenario , We can map the data source to the hash ring , as follows
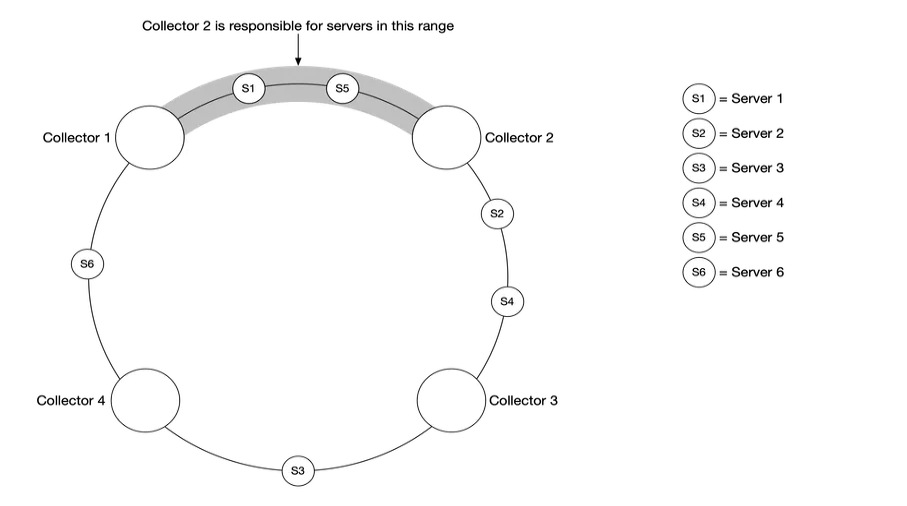
This ensures that each indicator collector has a corresponding data source , Work with each other without conflict .
Push mode
As shown in the figure below , In push mode , Various indicator data sources (Web application , database , Message queue ) Send directly to the indicator collector .

In push mode , You need to install the collector agent on each monitored server , It can collect the indicator data of the server , Then send it to the indicator collector regularly .
Which is better, push or pull ? There is no fixed answer , Both schemes are feasible , Even in some complex scenes , You need to support push and pull at the same time .
Extended data transmission
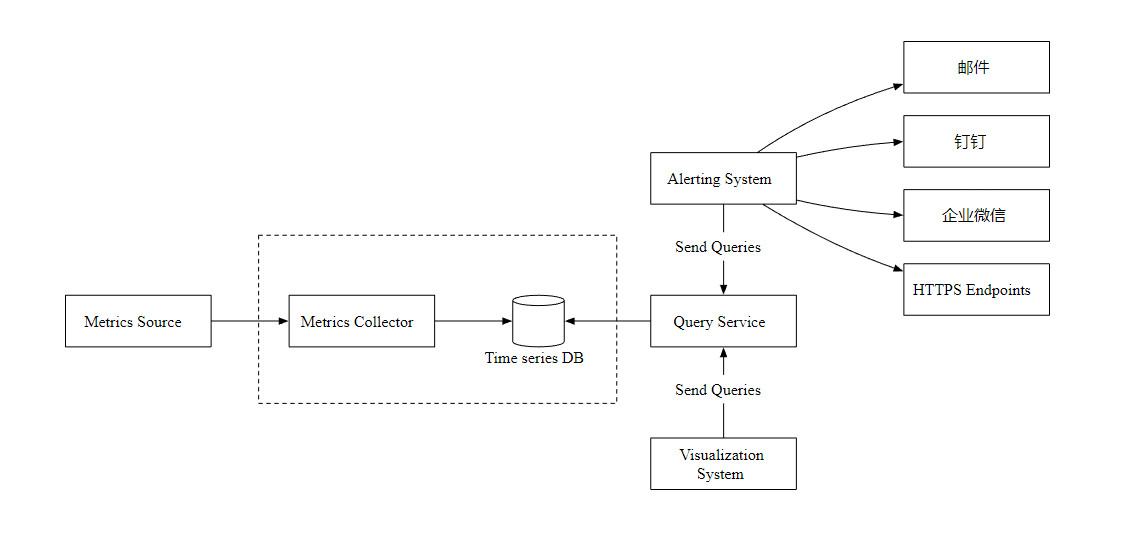
Now? , Let's focus on indicator collectors and time series databases . Whether you use push or pull mode , In a scenario where a large amount of data needs to be received , The indicator collector is usually a service cluster .
however , When the chronological database is unavailable , There is a risk of data loss , therefore , We introduced Kafka Message queuing components , Here's the picture
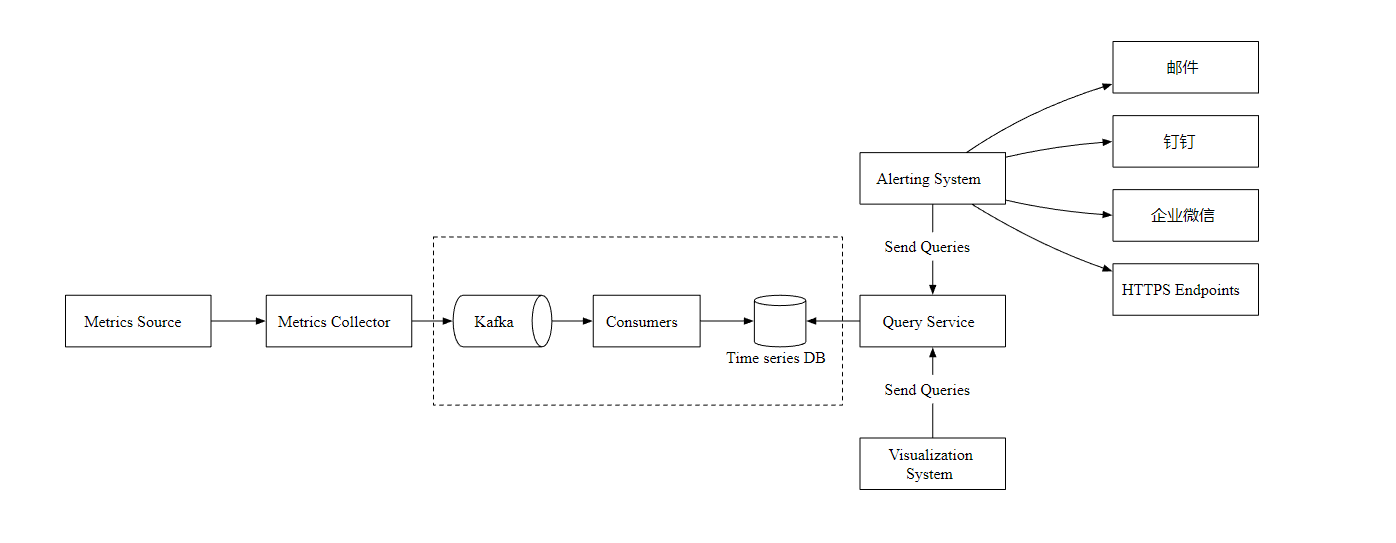
The indicator collector sends the indicator data to Kafka Message queue , Then consumers or stream processing services process data , such as Apache Storm、Flink and Spark, Finally, push it to the timing database .
Index calculation
Indicators can be aggregated and calculated in multiple places , See how they are different .
- Client agent : The collection agent installed on the client only supports simple aggregation logic .
- Transmission pipeline : Before the data is written to the timing database , We can use Flink Stream processing services perform aggregate Computing , Then write only the summarized data , This will greatly reduce the amount of writing . But because we don't store the original data , So the data accuracy is lost .
- Query end : We can aggregate and query the original data in real time at the query end , But this way of query is not very efficient .
Temporal database query language
Most popular indicator monitoring systems , such as Prometheus and InfluxDB Not used SQL, It has its own query language . One of the main reasons is that it is difficult to pass SQL To query time series data , And it's hard to read , Like the following SQL Can you see what data you are looking for ?
select id,
       temp,
       avg(temp) over (partition by group_nr order by time_read) as rolling_avg
from (
  select id,
         temp,
         time_read,
         interval_group,
         id - row_number() over (partition by interval_group order by time_read) as group_nr
  from (
    select id,
    time_read,
    "epoch"::timestamp + "900 seconds"::interval * (extract(epoch from time_read)::int4 / 900) as interval_group,
    temp
    from readings
  ) t1
) t2
order by time_read;
by comparison , InfluxDB Used for timing data Flux The query language will be simpler and better understood , as follows
from(db:"telegraf")
  |> range(start:-1h)
  |> filter(fn: (r) => r._measurement == "foo")
  |> exponentialMovingAverage(size:-10s)
Data encoding and compression
Data encoding and compression can greatly reduce the size of data , Especially in time series database , Here is a simple example .
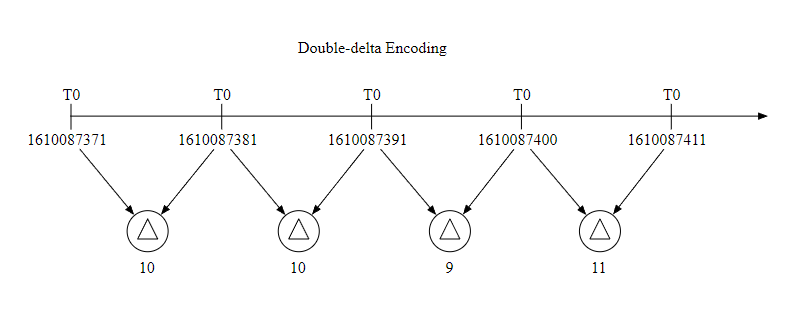
Because the time interval of general data collection is fixed , So we can store a basic value together with the increment , such as 1610087371, 10, 10, 9, 11 such , It can take up less space .
Down sampling
Down sampling is the process of converting high-resolution data into low-resolution data , This can reduce disk usage . Because our data retention period is 1 year , We can down sample the old data , This is an example :
- 7 Day data , No sampling .
- 30 Day data , Down sampling to 1 Minute resolution
- 1 Annual data , Down sampling to 1 Hour resolution .
Let's look at another specific example , It is the 10 Second resolution data are aggregated into 30 Second resolution .
Raw data
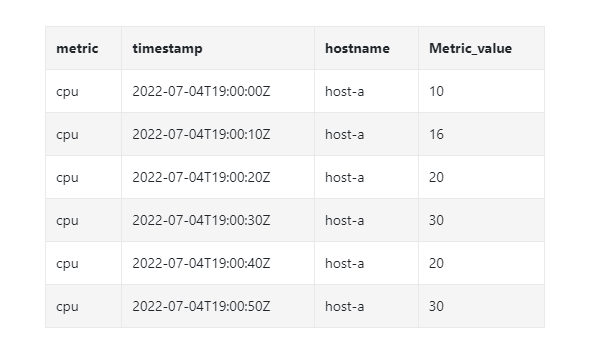
After downsampling

Alarm service
Let's take a look at the design of alarm service , And the workflow .
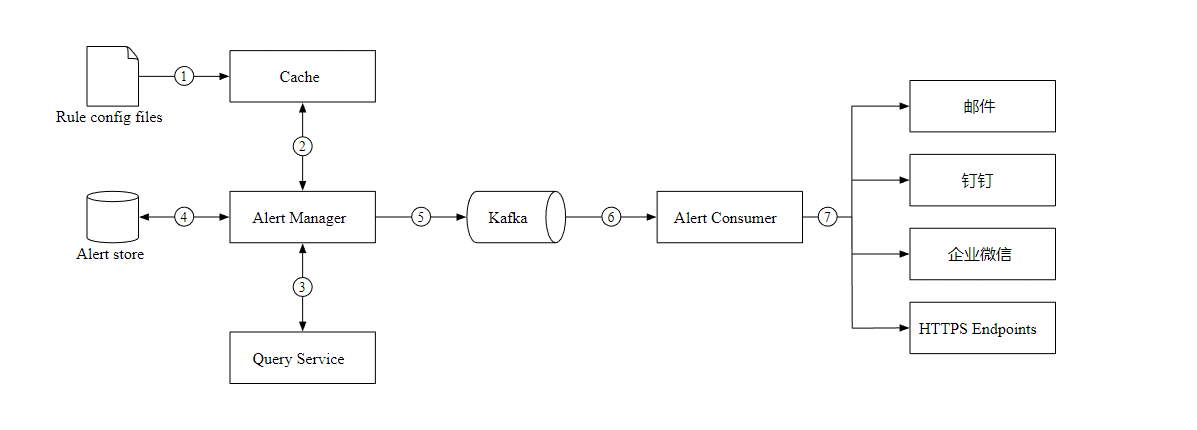
load YAML Format alarm configuration file to cache .
- name: instance_down
  rules:
  #  The service is unavailable for more than  5  Minute trigger alarm .
  - alert: instance_down
    expr: up == 0
    for: 5m
    labels:
      severity: page
The alert manager reads the configuration from the cache .
According to the alarm rules , Query indicators according to the set time and conditions , If the threshold is exceeded , The alarm is triggered .
Alert Store Save the status of all alarms ( Hang up , Trigger , resolved ).
Qualified alarms will be added to Kafka in .
Consumption queue , According to the alarm rules , Send alert information to different notification channels .
visualization
Visualization is built on the data layer , Indicator data can be displayed on the indicator dashboard , The alarm information can be displayed on the alarm dashboard . The following figure shows some indicators , Number of requests from the server 、 Memory /CPU utilization 、 Page load time 、 Traffic and login information .
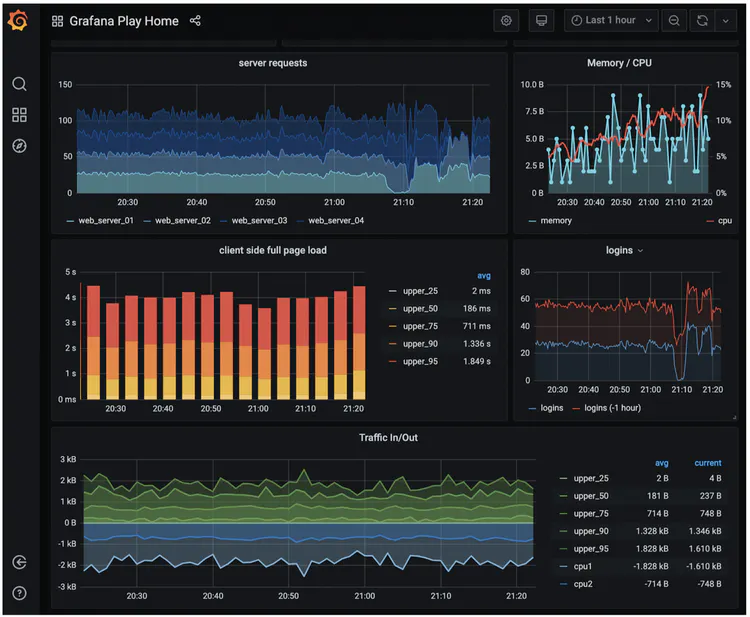
Grafana It can be a very good visualization system , We can use it directly .
summary
In this paper , We introduce the design of index monitoring and alarm system . At a high level , We discussed data collection 、 Time series database 、 Alarm and visualization , The following figure is our final design :

Reference
[0] System Design Interview Volume 2:
https://www.amazon.com/System-Design-Interview-Insiders-Guide/dp/1736049119
[1] Datadog: https://www.datadoghq.com/
[2] Splunk: https://www.splunk.com/
[3] Elastic stack: https://www.elastic.co/elastic-stack
[4] Dapper, a Large-Scale Distributed Systems Tracing Infrastructure:
https://research.google/pubs/pub36356/
[5] Distributed Systems Tracing with Zipkin:
https://blog.twitter.com/engineering/en_us/a/2012/distributed-systems-tracing-with-zipkin.html
[6] Prometheus: https://prometheus.io/docs/introduction/overview/
[7] OpenTSDB - A Distributed, Scalable Monitoring System: http://opentsdb.net/
[8] Data model: : https://prometheus.io/docs/concepts/data_model/
[9] Schema design for time-series data | Cloud Bigtable Documentation
https://cloud.google.com/bigtable/docs/schema-design-time-series
[10] MetricsDB: TimeSeries Database for storing metrics at Twitter:
https://blog.twitter.com/engineering/en_us/topics/infrastructure/2019/metricsdb.html
[11] Amazon Timestream: https://aws.amazon.com/timestream/
[12] DB-Engines Ranking of time-series DBMS: https://db-engines.com/en/ranking/time+series+dbms
[13] InfluxDB: https://www.influxdata.com/
[14] etcd: https://etcd.io
[15] Service Discovery with Zookeeper
https://cloud.spring.io/spring-cloud-zookeeper/1.2.x/multi/multi_spring-cloud-zookeeper-discovery.html
[16] Amazon CloudWatch: https://aws.amazon.com/cloudwatch/
[17] Graphite: https://graphiteapp.org/
[18] Push vs Pull: http://bit.ly/3aJEPxE
[19] Pull doesn’t scale - or does it?:
https://prometheus.io/blog/2016/07/23/pull-does-not-scale-or-does-it/
[20] Monitoring Architecture:
https://developer.lightbend.com/guides/monitoring-at-scale/monitoring-architecture/architecture.html
[21] Push vs Pull in Monitoring Systems:
https://giedrius.blog/2019/05/11/push-vs-pull-in-monitoring-systems/
[22] Pushgateway: https://github.com/prometheus/pushgateway
[23] Building Applications with Serverless Architectures
https://aws.amazon.com/lambda/serverless-architectures-learn-more/
[24] Gorilla: A Fast, Scalable, In-Memory Time Series Database:
http://www.vldb.org/pvldb/vol8/p1816-teller.pdf
[25] Why We’re Building Flux, a New Data Scripting and Query Language:
https://www.influxdata.com/blog/why-were-building-flux-a-new-data-scripting-and-query-language/
[26] InfluxDB storage engine: https://docs.influxdata.com/influxdb/v2.0/reference/internals/storage-engine/
[27] YAML: https://en.wikipedia.org/wiki/YAML
[28] Grafana Demo: https://play.grafana.org/
Last
Made a .NET The learning website , Covering distributed systems , Data structure and algorithm , Design patterns , operating system , Computer network, etc , And job recommendation and interview experience sharing , Welcome to flirt .

Official account
reply dotnet Get the website address .
reply Interview questions obtain .NET Interview questions .
reply Programmer sideline Get a sideline guide for programmers .


![[NTIRE 2022]Residual Local Feature Network for Efficient Super-Resolution](/img/f3/782246100bca3517d95869be80d9c5.png)


