当前位置:网站首页>Model application of time series analysis - stock price prediction
Model application of time series analysis - stock price prediction
2022-07-07 07:21:00 【Data analysis cases】
author | Dong Ye
Time series is a special type of data set , Where one or more variables are measured over time .
For example, weather changes , Stock price changes , Time series analysis is to reflect the dynamic dependencies contained in time series by building models , In order to predict the changes in the future . Right recently 7 Days of the weather 、 Prediction of tomorrow's closing share price .

01 Model classification of time series analysis
At present, there are three kinds of time series analysis models :
1.1 Classical time series model
The classical time series model is a series of statistical models , For example, autoregressive models (AR)、 Integrated moving average autoregressive model (ARIMA), Generalized autoregressive conditional heteroscedasticity model (GARCH), They are based on time changes in time series , And it is applicable to univariate time series , These models are generally only applicable to time series .
1.2 Monitoring model
Linear regression 、 Random forests 、XGBoost This kind of classical machine learning algorithm , Although not specifically designed for time series analysis , But it has a good effect in variable prediction .
1.3 Deep learning model
Long and short term memory model LSTM、Facebook Open source time series Library Prophet, Amazon DeepAR, This kind of model can automatically learn and extract features from raw data and incomplete data , Consider both long-term and short-term data dependence of time series .
02 The main characteristics of time series data
2.1 Three components of time series data : Seasonality 、 Trends and noise
Seasonality Is the repeated motion that appears in the time series variable . for example , The temperature in a place is higher in summer , In winter, it is lower . You can calculate the average monthly temperature and use this seasonality as a basis for predicting future values .
trend It can be a long-term upward or downward pattern . In temperature time series , There may be a trend due to global warming . for example , In addition to the summer / Outside the seasonality of winter , It is likely to see a slight increase in the average temperature over time .
noise It is a part of variability in time series , Parts that cannot be explained by seasonality or trend , The error term that always exists .

2.2 Autocorrelation in time series data
Autocorrelation is the correlation between the current value and the past value of the time series , This means that historical data may be used to predict the future . Autocorrelation has very strong rationality , Because our view of history makes us naturally believe : History will repeat , Past experience can be used to reflect the future .
2.3 Stationarity in time series
Stationarity means that the change characteristics of time series data remain stable , The historical distribution and future distribution of data tend to be consistent . Usually stock price trend data 、 The weather temperature data has a trend 、 periodic , Does not directly satisfy the stationarity characteristic , Generally, nonstationary data is converted into stationary data by difference method , For example, the rise of share price , The temperature is based on the monthly year-on-year change , By removing trends from time series 、 Seasonal changes to stabilize the data .

03 The practical application - Stock price forecast
Predicting the performance of the stock market is one of the most difficult things , However, time series analysis can provide reference for technical analysis of stocks , The classic time series model will be used below ARIMA And deep learning LSTM The model predicts the stock price .
We will use Akshare Library Download domestic A Stock trading data , And with Ping An Bank ( Stock code :000001) For example .


Classical time series model – ARIMA
ARIMA Integrated moving average autoregressive model , This model is suitable for the analysis of nonstationary and aperiodic time series ARIMA The model has three components , Usually, the ARIMA(p,d,q) Represent the model .

AR Is the autoregressive term ,p Is the number of autoregressive terms ;
I For the difference item ,d The number of differences made to make it a stationary sequence ( Order );
MA by " moving average ",q Is the moving average number of terms .
among L It's a lag operator (Lag operator),d in Z, d>0.
Usually analyze time series data , Please refer to the figure below :

Judge the stability of the sequence , Usually we use ADF test :

The original sequence of stock prices does not satisfy the stationarity condition , We need to deal with the stability , Generally, the method of difference and transformation is adopted , The following are the steps to determine the relevant parameters of the model ,
1 For non-stationary time series, we should first d Order difference operation , Into a stationary time series
2 The autocorrelation coefficients of the obtained stationary time series are calculated respectively ACF And partial autocorrelation coefficient PACF, Through the analysis of autocorrelation diagram and partial autocorrelation diagram , Get the best class p Sum order q
3 From the above d、p、q, obtain ARIMA Model , Then start to test the obtained model .


From the above figure, we can see that our preliminary model can be selected ARIMA(1,1,1)
Auto_ARIMA
In addition to selecting model parameters by using the above graphical observation method , We can borrow pmdarima.arima Built in Auto-ARIMA Package automatic iteration (p,d,q) Three parameters , Find all possible parameters by exhaustive method , So as to obtain the minimum AIC Model of .


Use model as prediction :


Predict point by point :


The above is using ARIMA The model predicts the results of the last day , It belongs to point by point prediction , If used to predict the future N The result of the day , The model feedback is relatively poor , The longer the number of consecutive forecast periods , The worse the effect .


In the example above , The result of point by point prediction is more accurate than that of complete sequence prediction , But it's a little deceptive .
under these circumstances , Except for the distance between the prediction point and the last predicted data point , In fact, the model does not need to understand the time series itself , Because even if it predicts wrong this time , When making the next prediction , It will only consider the real results , Completely ignore your own mistakes , Then continue to generate false predictions .
Although it doesn't sound very good , But in fact, this method is still useful , It can at least reflect the range of the next point , It can be used for Volatility Prediction and other applications .
LSTM Long and short term memory model
LSTM It is widely used in sequence prediction problems , It has been proved to be very effective . The reason they work well is because LSTM Able to store important past information , And forget unimportant information .LSTM There are three doors :
Input gate input gate : The input gate adds information to the cell state
Oblivion gate forget gate : Delete information that is no longer needed by the model
Output gate output gate : Select the information to be displayed as output

LSTM Specially designed “ door ” To introduce or remove status information , Similar to the filter in signal processing , Allow the signal to pass partially or be processed by the door when passing ; Some gates are also similar to logic gates in digital circuits , Allow the signal to pass or not .
Here are Python Implementation process :
1. Import data , Normalize the original data , Make the data between [0,1]
2. Use early data to predict the current period , Data sets ( Early stock price , Current share price ) treat as (X,Y)


3. Establish and train LSTM Model , The model is very simple , There is only one LSTM Layer and output layer , Seasonal effects are not specifically addressed , model training 100 round .


From the prediction results , First built LSTM The effect of point by point prediction of the model is not as good as ARIMA Model , We can adjust LSTM The layer number 、 add to dropout Value or increase epoch Count to improve the effect of the model .
About the adjustment of model parameters , There are many articles on the Internet that can be used for reference , I'm not going to repeat it .
Predicting the performance of the stock market is one of the most difficult things , The prediction involves many factors —— Physics and Psychology 、 Rational and irrational behavior . All these factors come together , Make the stock price fluctuate and difficult to predict accurately .
The model method discussed in this paper is only used to show the analysis ideas and methods of time series prediction , It is not enough to be applied in actual investment .
Time series prediction is a very interesting field , Except for the share price 、 Weather forecast and flights 、 Other data scenarios related to ticket sales can be explored .
边栏推荐
- Détailler le bleu dans les tâches de traduction automatique
- L'étape avancée du pointeur de langage C (haut de gamme) pour l'enroulement des cocons
- Apache AB stress test
- Use of completable future
- Kuboard无法发送邮件和钉钉告警问题解决
- 软件验收测试
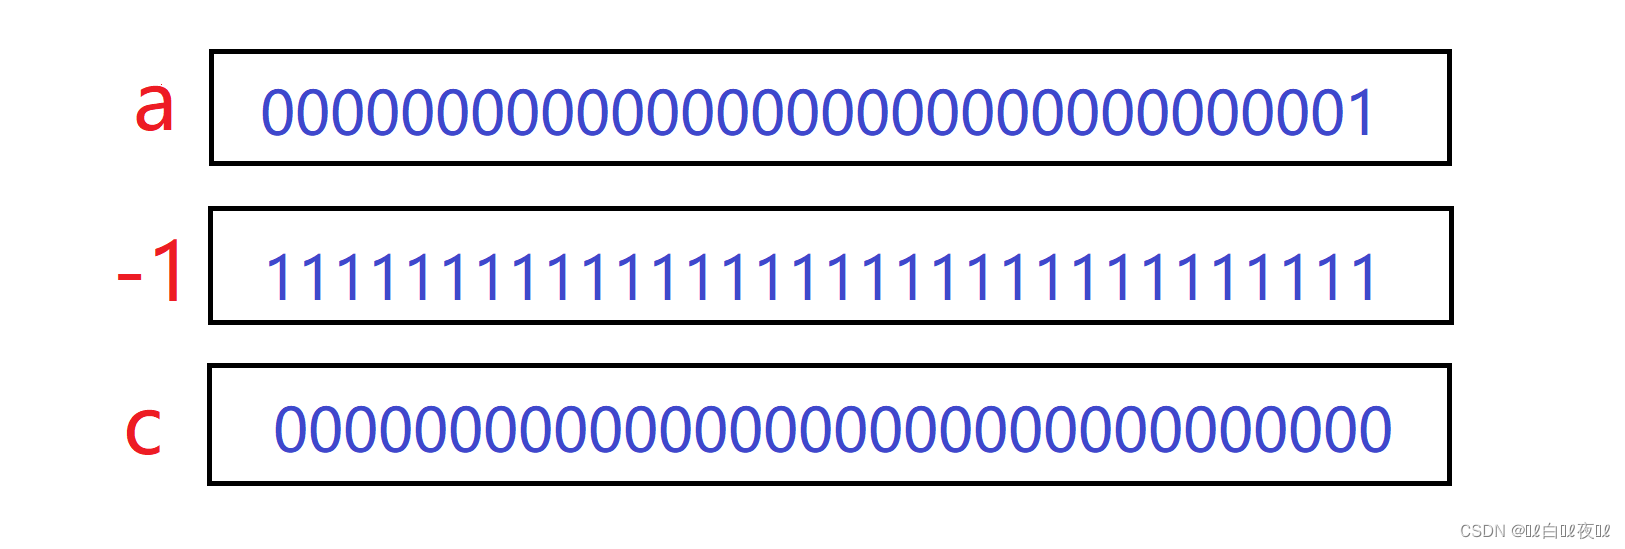
- About binary cannot express decimals accurately
- PostgreSQL source code (60) transaction system summary
- Fullgc problem analysis and solution summary
- How do I get the last part of a string- How to get the last part of a string?
猜你喜欢
sql中对集合进行非空校验
Apache AB stress test
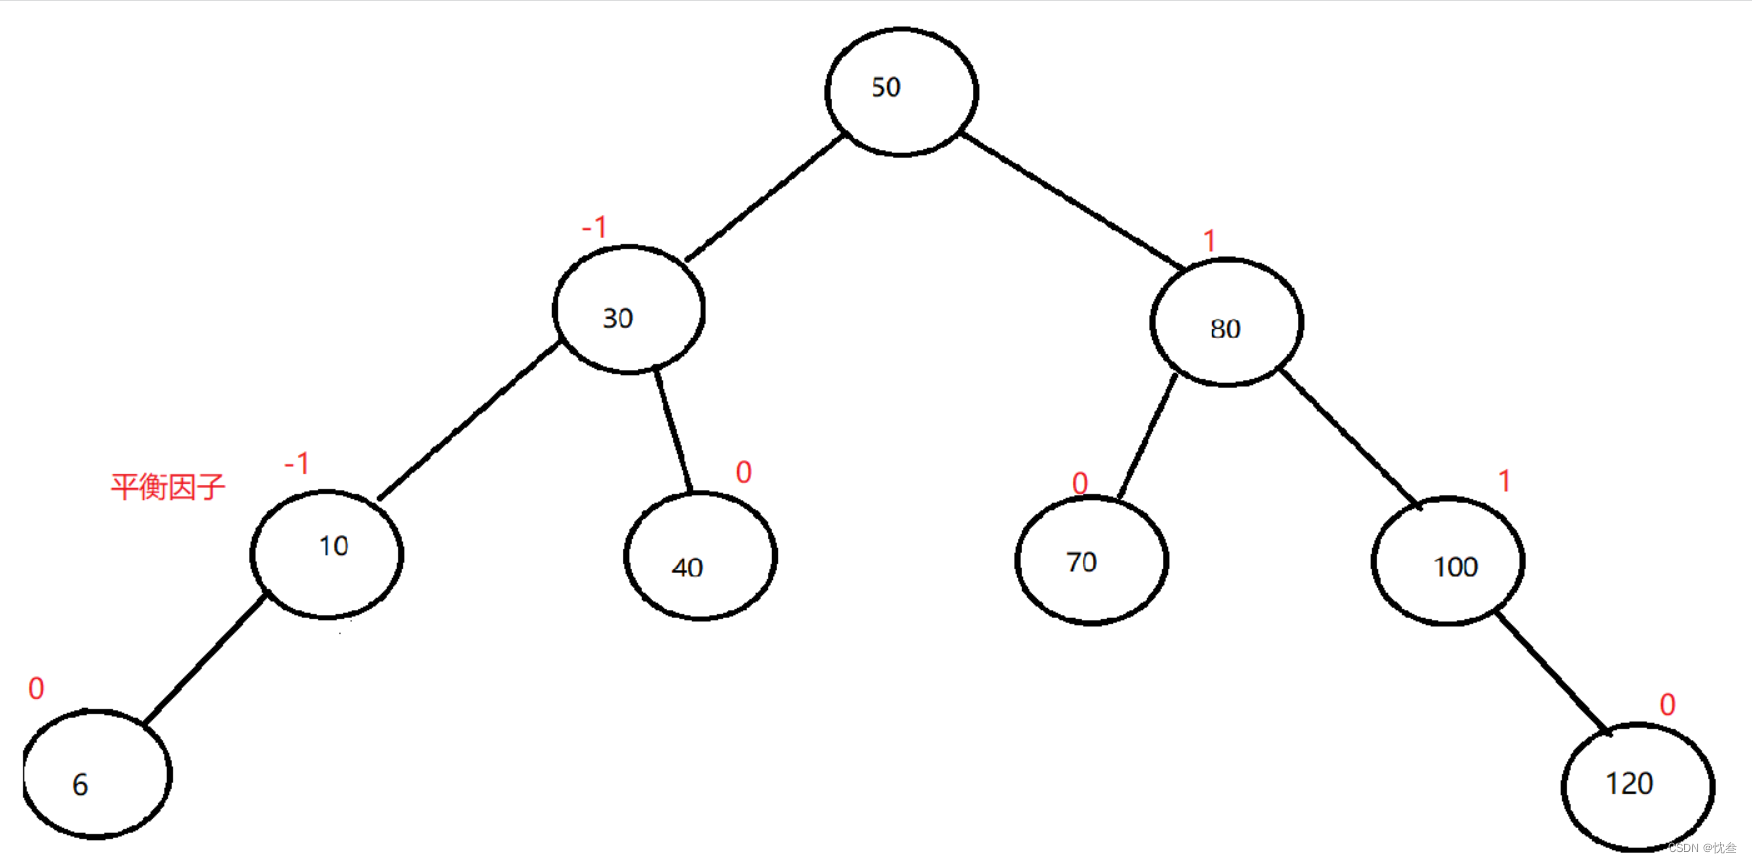
AVL树的实现
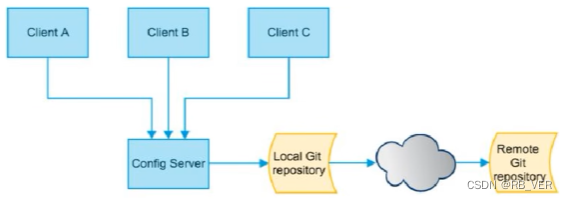
Config distributed configuration center

After the promotion, sales volume and flow are both. Is it really easy to relax?
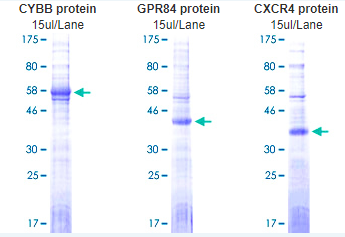
Abnova membrane protein lipoprotein technology and category display
抽絲剝繭C語言(高階)數據的儲存+練習
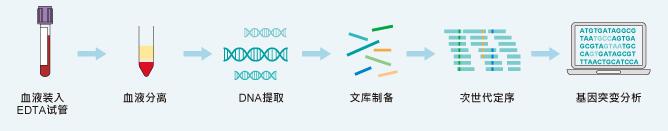
Abnova circulating tumor DNA whole blood isolation, genomic DNA extraction and analysis
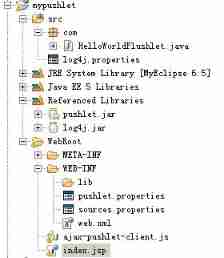
Example of Pushlet using handle of Pushlet
Kuboard无法发送邮件和钉钉告警问题解决
随机推荐
JS small exercise ---- time sharing reminder and greeting, form password display hidden effect, text box focus event, closing advertisement
选择商品属性弹框从底部弹出动画效果
[Luogu p1971] rabbit and egg game (bipartite game)
Tool class: object to map hump to underline underline hump
点亮显示屏的几个重要步骤
About binary cannot express decimals accurately
Bus message bus
Composition API premise
transform-origin属性详解
栈题目:有效括号的嵌套深度
Asynchronous components and suspend (in real development)
[explanation of JDBC and internal classes]
PostgreSQL source code (59) analysis of transaction ID allocation and overflow judgment methods
$parent(获取父组件) 和 $root(获取根组件)
Mobx knowledge point collection case (quick start)
PostgreSQL source code (60) transaction system summary
Tujia, muniao, meituan... Home stay summer war will start
Hidden Markov model (HMM) learning notes
How can brand e-commerce grow against the trend? See the future here!
Lvs+kept (DR mode) learning notes