当前位置:网站首页>skimage学习(2)——RGB转灰度、RGB 转 HSV、直方图匹配
skimage学习(2)——RGB转灰度、RGB 转 HSV、直方图匹配
2022-07-07 15:32:00 【原知】
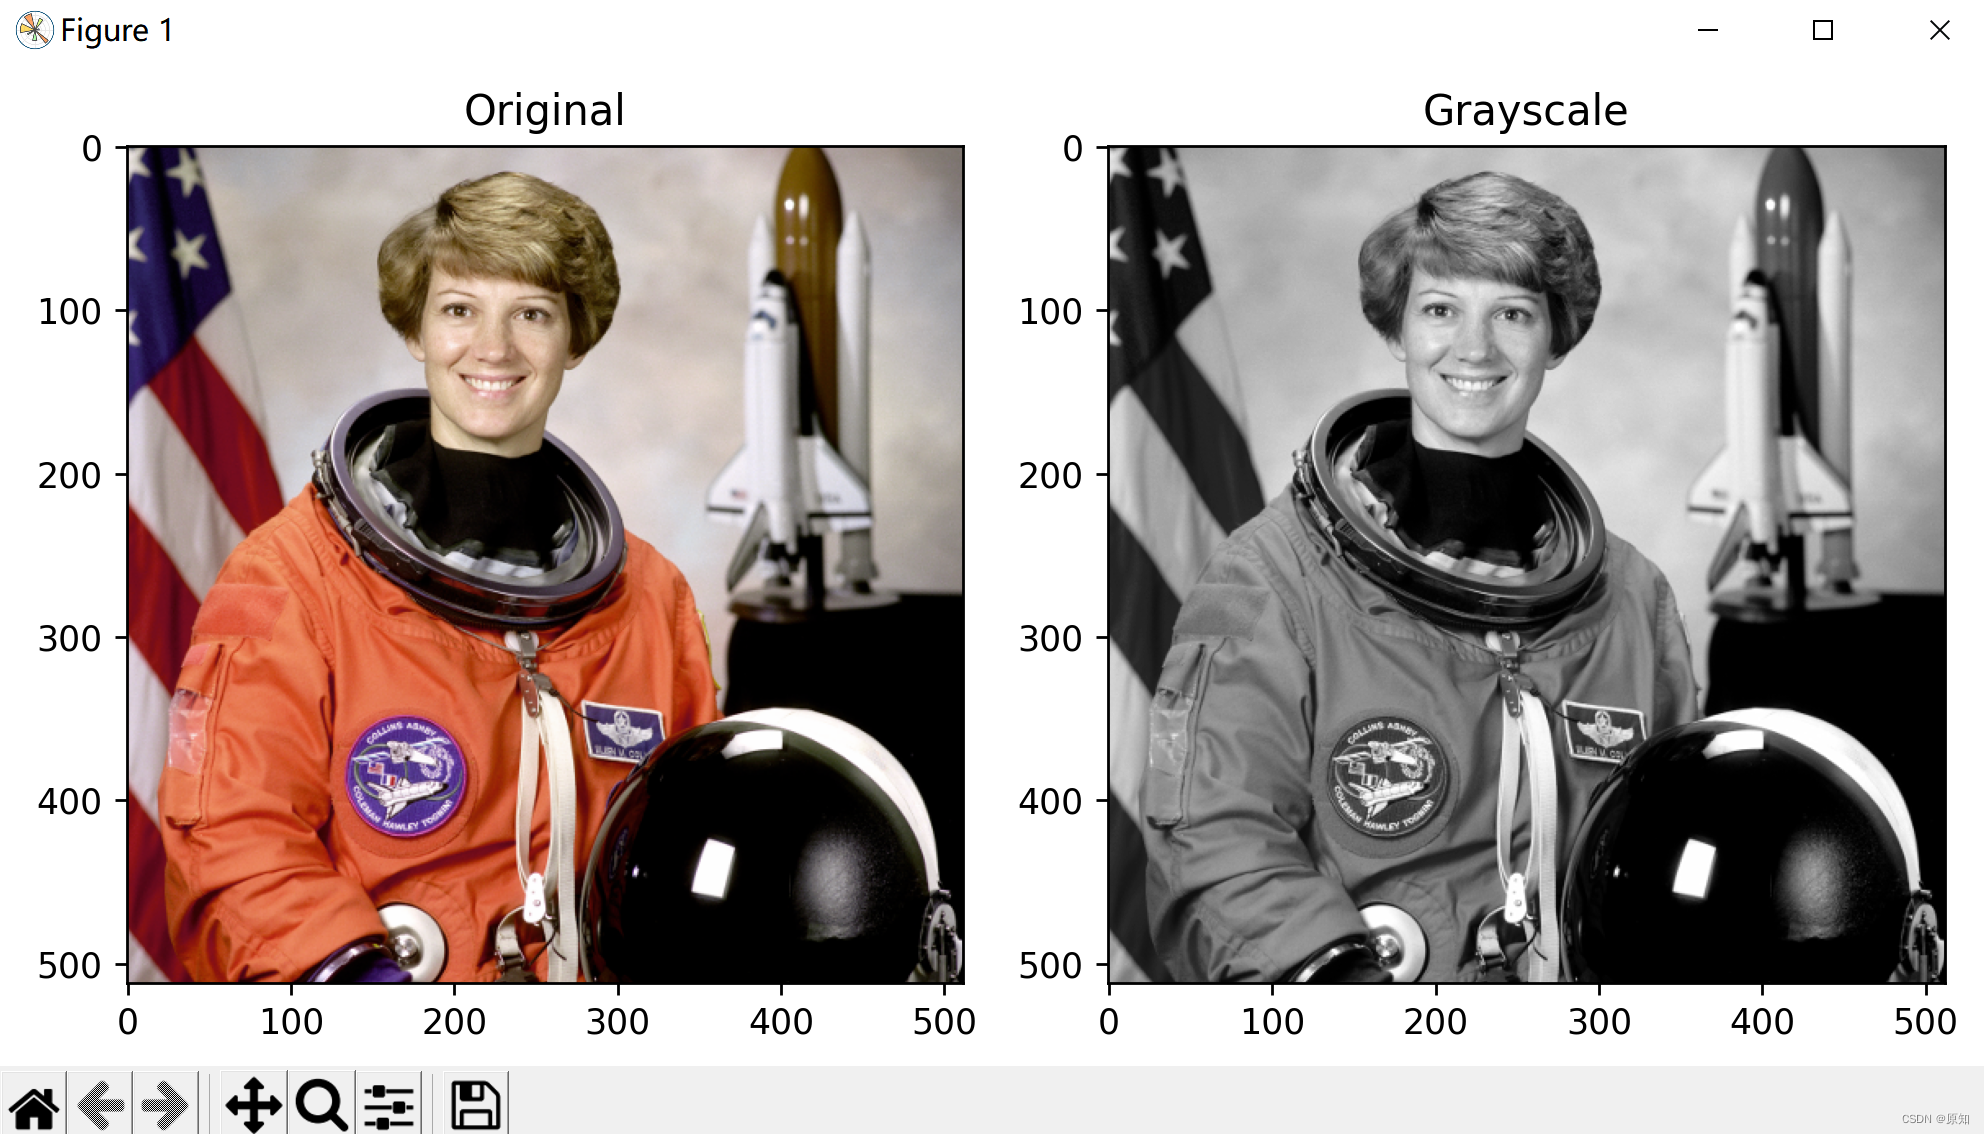
1、RGB转灰度
此示例将具有 RGB 通道的图像转换为具有单个灰度通道的图像。
每个灰度像素的值计算为相应的红色、绿色和蓝色像素的加权和:
Y = 0.2125 R + 0.7154 G + 0.0721 B
CRT 荧光粉使用这些权重,因为它们比同等权重更能代表人类对红色、绿色和蓝色的感知。
import matplotlib.pyplot as plt

from skimage import data
from skimage.color import rgb2gray

original = data.astronaut()
grayscale = rgb2gray(original)
#fig是一个变量名,fig代表绘图窗口(Figure);ax代表这个绘图窗口上的坐标系(axis),一般会继续对ax进行操作
#其中figsize用来设置图形的大小,a为图形的宽, b为图形的高,单位为英寸。
fig, axes = plt.subplots(1, 2, figsize=(8, 4))
ax = axes.ravel()

ax[0].imshow(original)
ax[0].set_title("Original")
ax[1].imshow(grayscale, cmap=plt.cm.gray)
ax[1].set_title("Grayscale")

fig.tight_layout()#ight_layout会自动调整子图参数,使之填充整个图像区域。这是个实验特性,可能在一些情况下不工作。它仅仅检查坐标轴标签、刻度标签以及标题的部分。
plt.show()
2、RGB 转 HSV
hsv详解:https://blog.csdn.net/bamboocan/article/details/70627137
这个例子说明了如何RGB到HSV(色调,饱和度,亮度)转换可以用来促进分割过程。
通常,图像中的物体有不同的颜色(色调)和亮度,所以这些特征可以用来分隔图像的不同区域。
在RGB表示中,色相和亮度表示为R、G、B通道的线性组合,而它们对应于HSV图像的单个通道(色相和值通道)。
一个简单的分割图像,然后可以有效地执行仅仅阈值的HSV通道。
比如图片染色均一化问题,我们常常用到rgb2hsv的手段来解决,可以有效的保护好纹理、分布等特征。
这里我们看下染色体的颜色分离的一个例子:
注意,这里的例子是HED颜色空间,HSV空间是同样的效果。
from skimage import io
import matplotlib.pyplot as plt

import matplotlib.pyplot as plt

from skimage import data
from skimage.color import rgb2hsv
#首先加载RGB图像并提取Hue和Value通道:
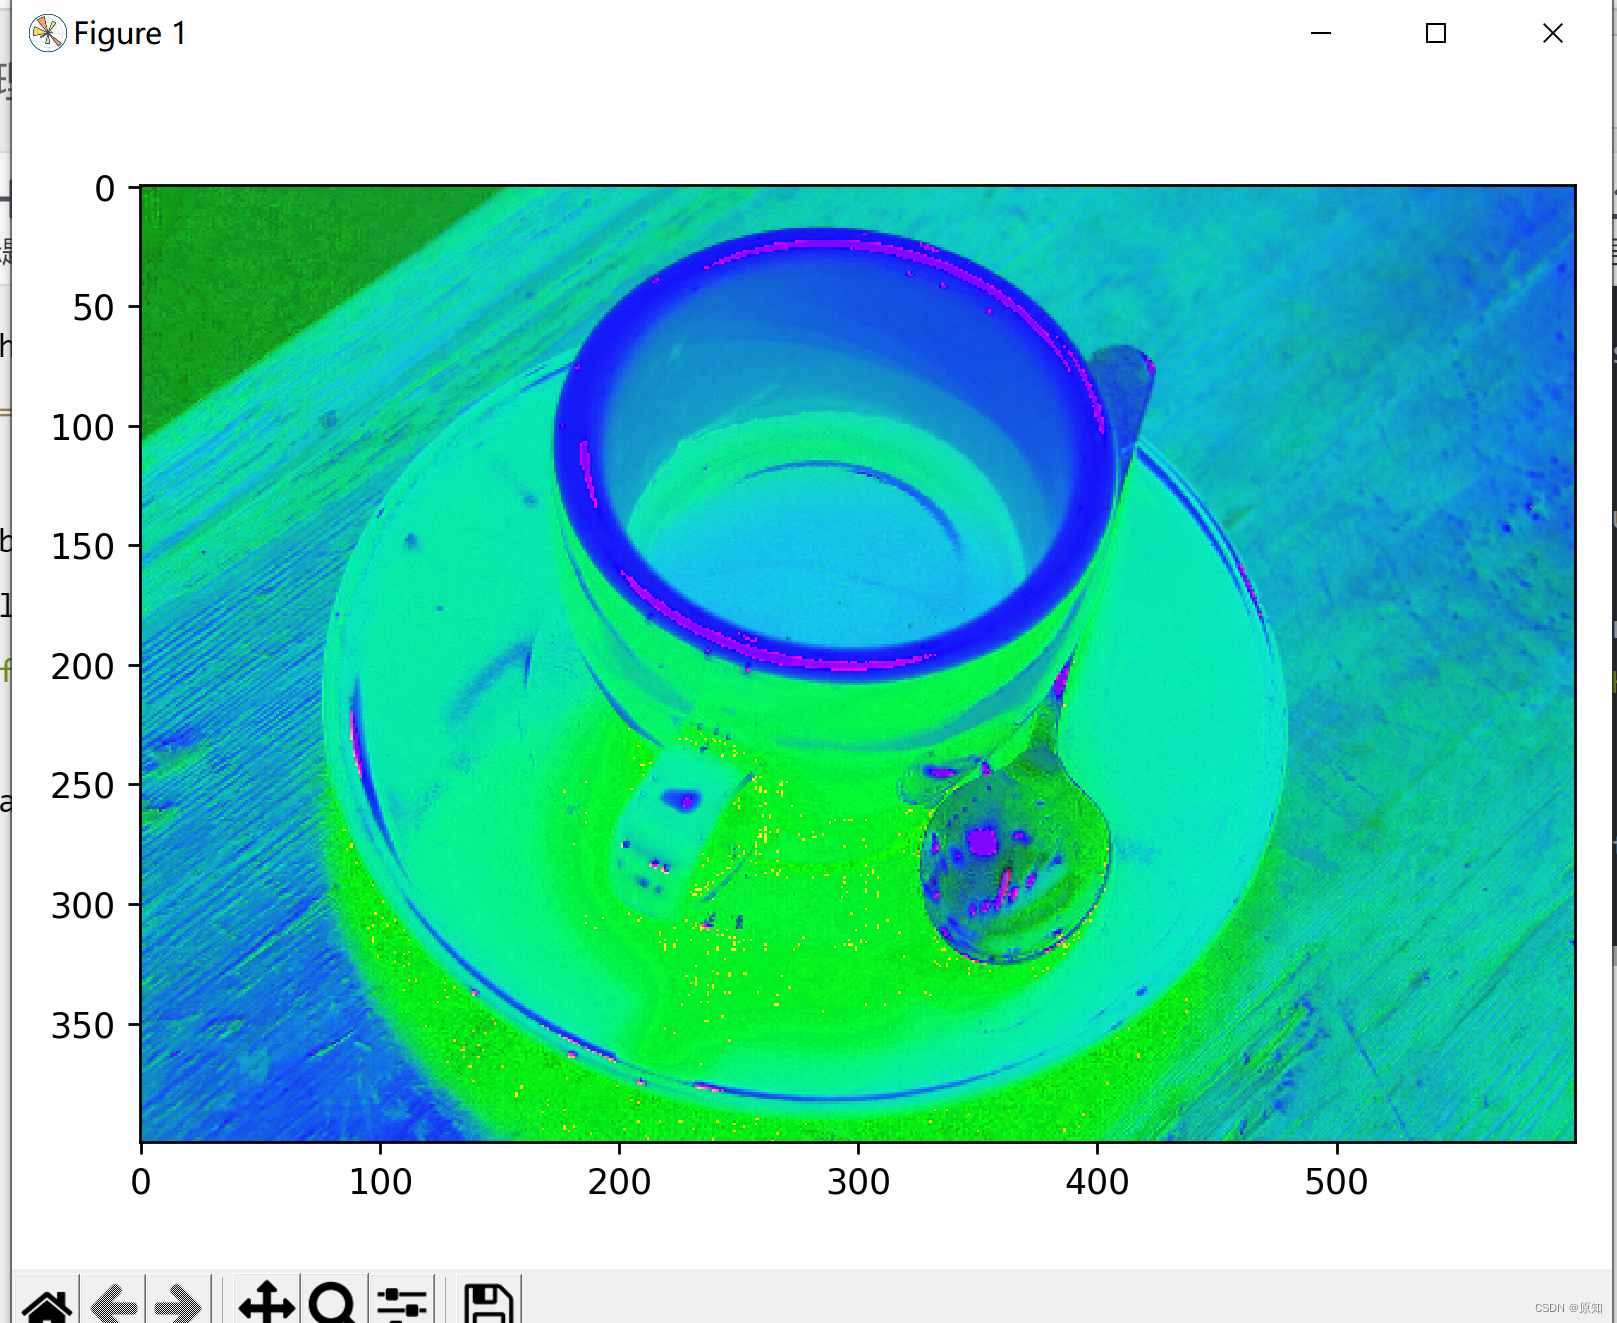
rgb_img = data.coffee()
hsv_img = rgb2hsv(rgb_img)
io.imshow(hsv_img)
plt.show()
hue_img = hsv_img[:, :, 0]#它是对多维数据的一种处理方式,代表了前两维全选,取其中的所有0号索引。
value_img = hsv_img[:, :, 2]
value1_img = hsv_img[:, :, 1]

fig, (ax0, ax1, ax2,ax3) = plt.subplots(ncols=4, figsize=(8, 2))

ax0.imshow(rgb_img)
ax0.set_title("RGB image")
ax0.axis('off')
ax1.imshow(hue_img, cmap='hsv')
ax1.set_title("Hue channel")
ax1.axis('off')
ax2.imshow(value_img)
ax2.set_title("Value channel")
ax2.axis('off')
ax3.imshow(value1_img)
ax3.set_title("Value1 channel")
ax3.axis('off')

fig.tight_layout()
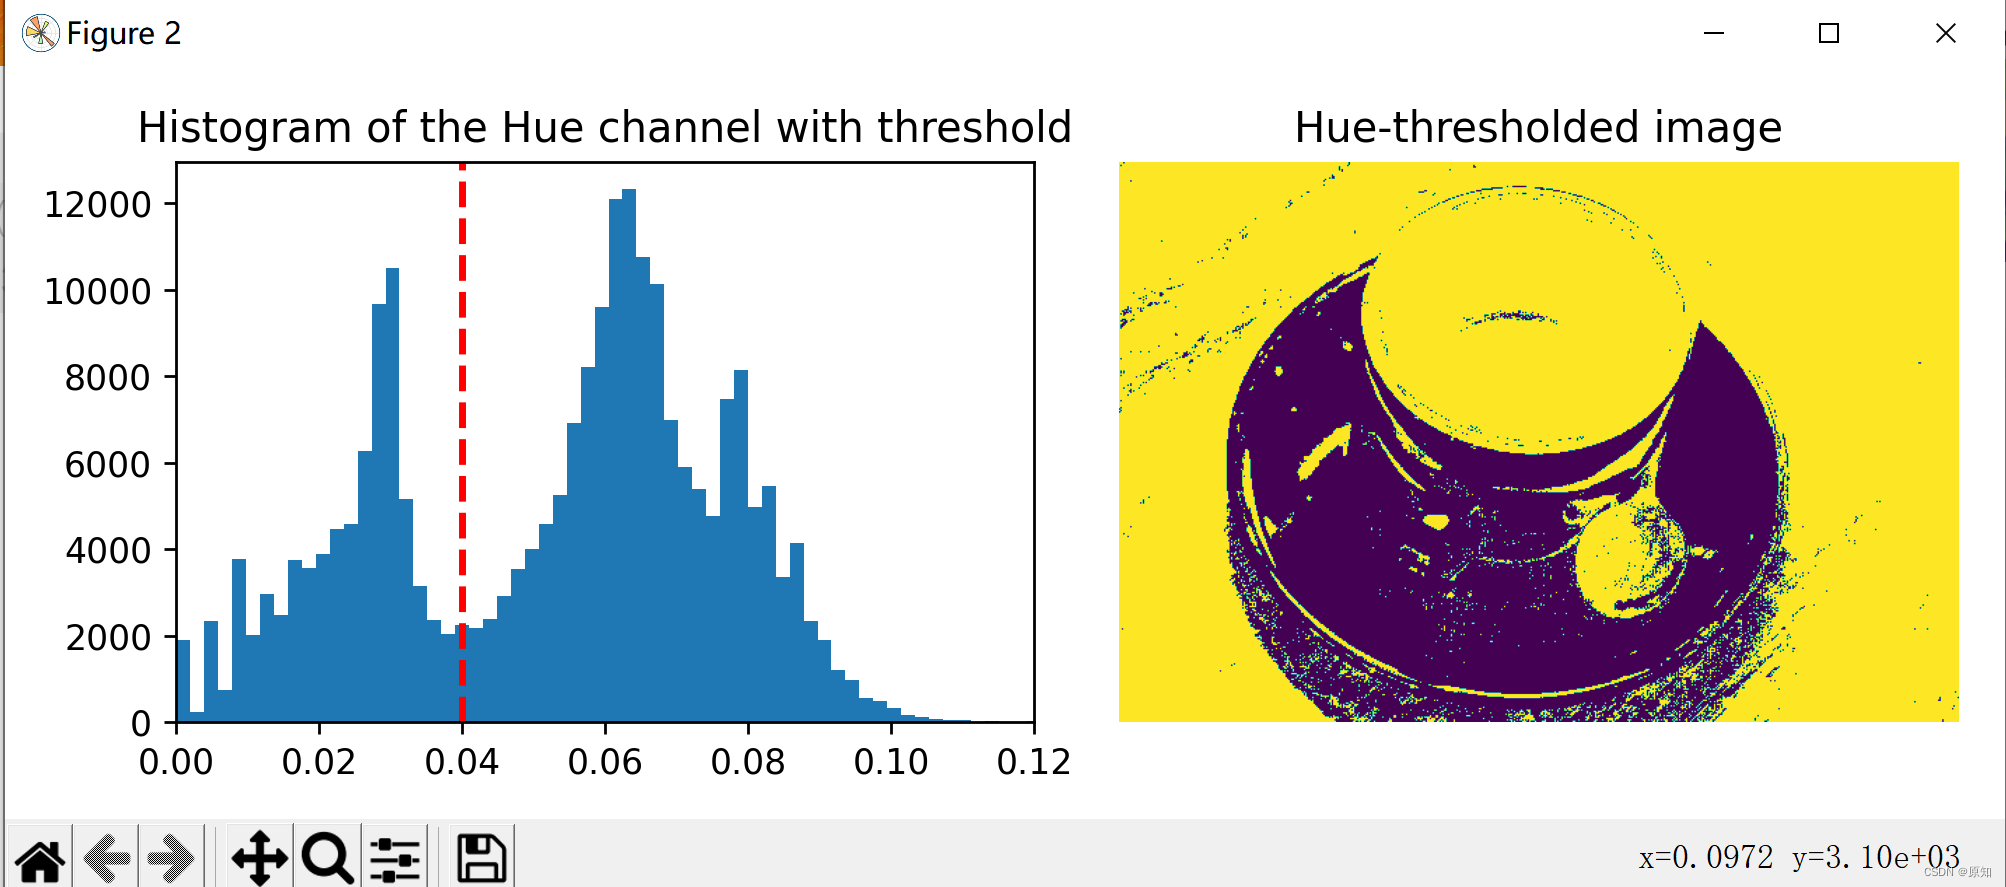
#在Hue通道上设置一个阈值,将杯子从背景中分离出来:
hue_threshold = 0.04#为什么这个通道是0.04
binary_img = hue_img > hue_threshold

fig, (ax0, ax1) = plt.subplots(ncols=2, figsize=(8, 3))

''' plt.hist 函数用于绘制直方图。函数原型: plt.hist(x, bins=None) 参数 x 是一个一维数组,bins 可以理解为矩形的个数,默认是 10。 '''
ax0.hist(hue_img.ravel(), 512)#512 为直方图条形的个数 自己设定
ax0.set_title("Histogram of the Hue channel with threshold")#Hue通道带阈值的直方图
#matplotlib库的axiss模块中的Axes.axvline()函数用于在轴上添加一条垂直线。
ax0.axvline(x=hue_threshold, color='r', linestyle='dashed', linewidth=2)
#matplotlib库的axiss模块中的Axes.set_xbound()函数用于设置x轴的上下数值边界。
ax0.set_xbound(0, 0.12)
ax1.imshow(binary_img)
ax1.set_title("Hue-thresholded image")
ax1.axis('off')

fig.tight_layout()
#在Value通道上执行一个额外的阈值,以部分去除杯子的阴影:
fig, ax0 = plt.subplots(figsize=(4, 3))

value_threshold = 0.10
binary_img = (hue_img > hue_threshold) | (value_img < value_threshold)

ax0.imshow(binary_img)
ax0.set_title("Hue and value thresholded image")
ax0.axis('off')

fig.tight_layout()
plt.show()

3、直方图匹配
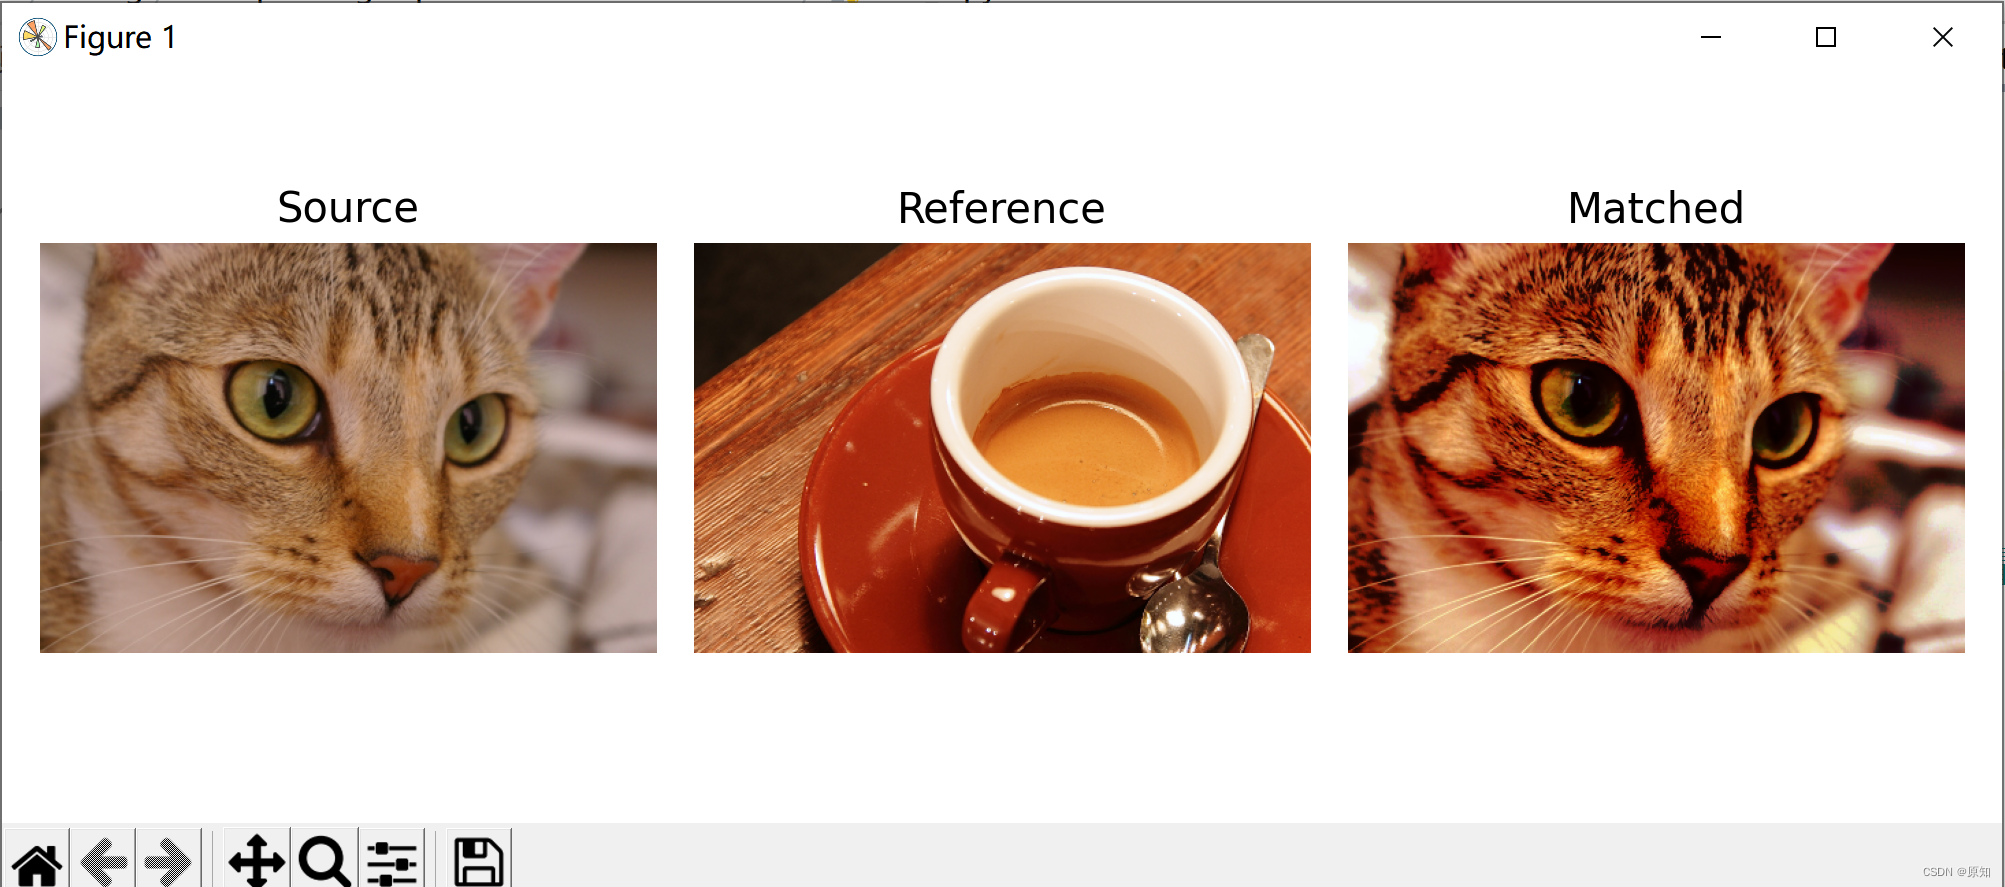
这个例子展示了直方图匹配的特性。它操作输入图像的像素,使其直方图与参考图像的直方图匹配。
如果图像有多个通道,只要输入图像和参考图像中的通道数量相等,则对每个通道独立进行匹配。
直方图匹配可以用作图像处理的轻量级归一化,例如特征匹配,特别是在图像从不同来源或不同条件(即光照)拍摄的情况下。
import matplotlib.pyplot as plt

from skimage import data
from skimage import exposure
from skimage.exposure import match_histograms

reference = data.coffee()
image = data.chelsea()

matched = match_histograms(image, reference, channel_axis=-1)
''' '''
fig, (ax1, ax2, ax3) = plt.subplots(nrows=1, ncols=3, figsize=(8, 3),
                                    sharex=True, sharey=True)
for aa in (ax1, ax2, ax3):
    aa.set_axis_off()

ax1.imshow(image)
ax1.set_title('Source')
ax2.imshow(reference)
ax2.set_title('Reference')
ax3.imshow(matched)
ax3.set_title('Matched')

plt.tight_layout()
plt.show()
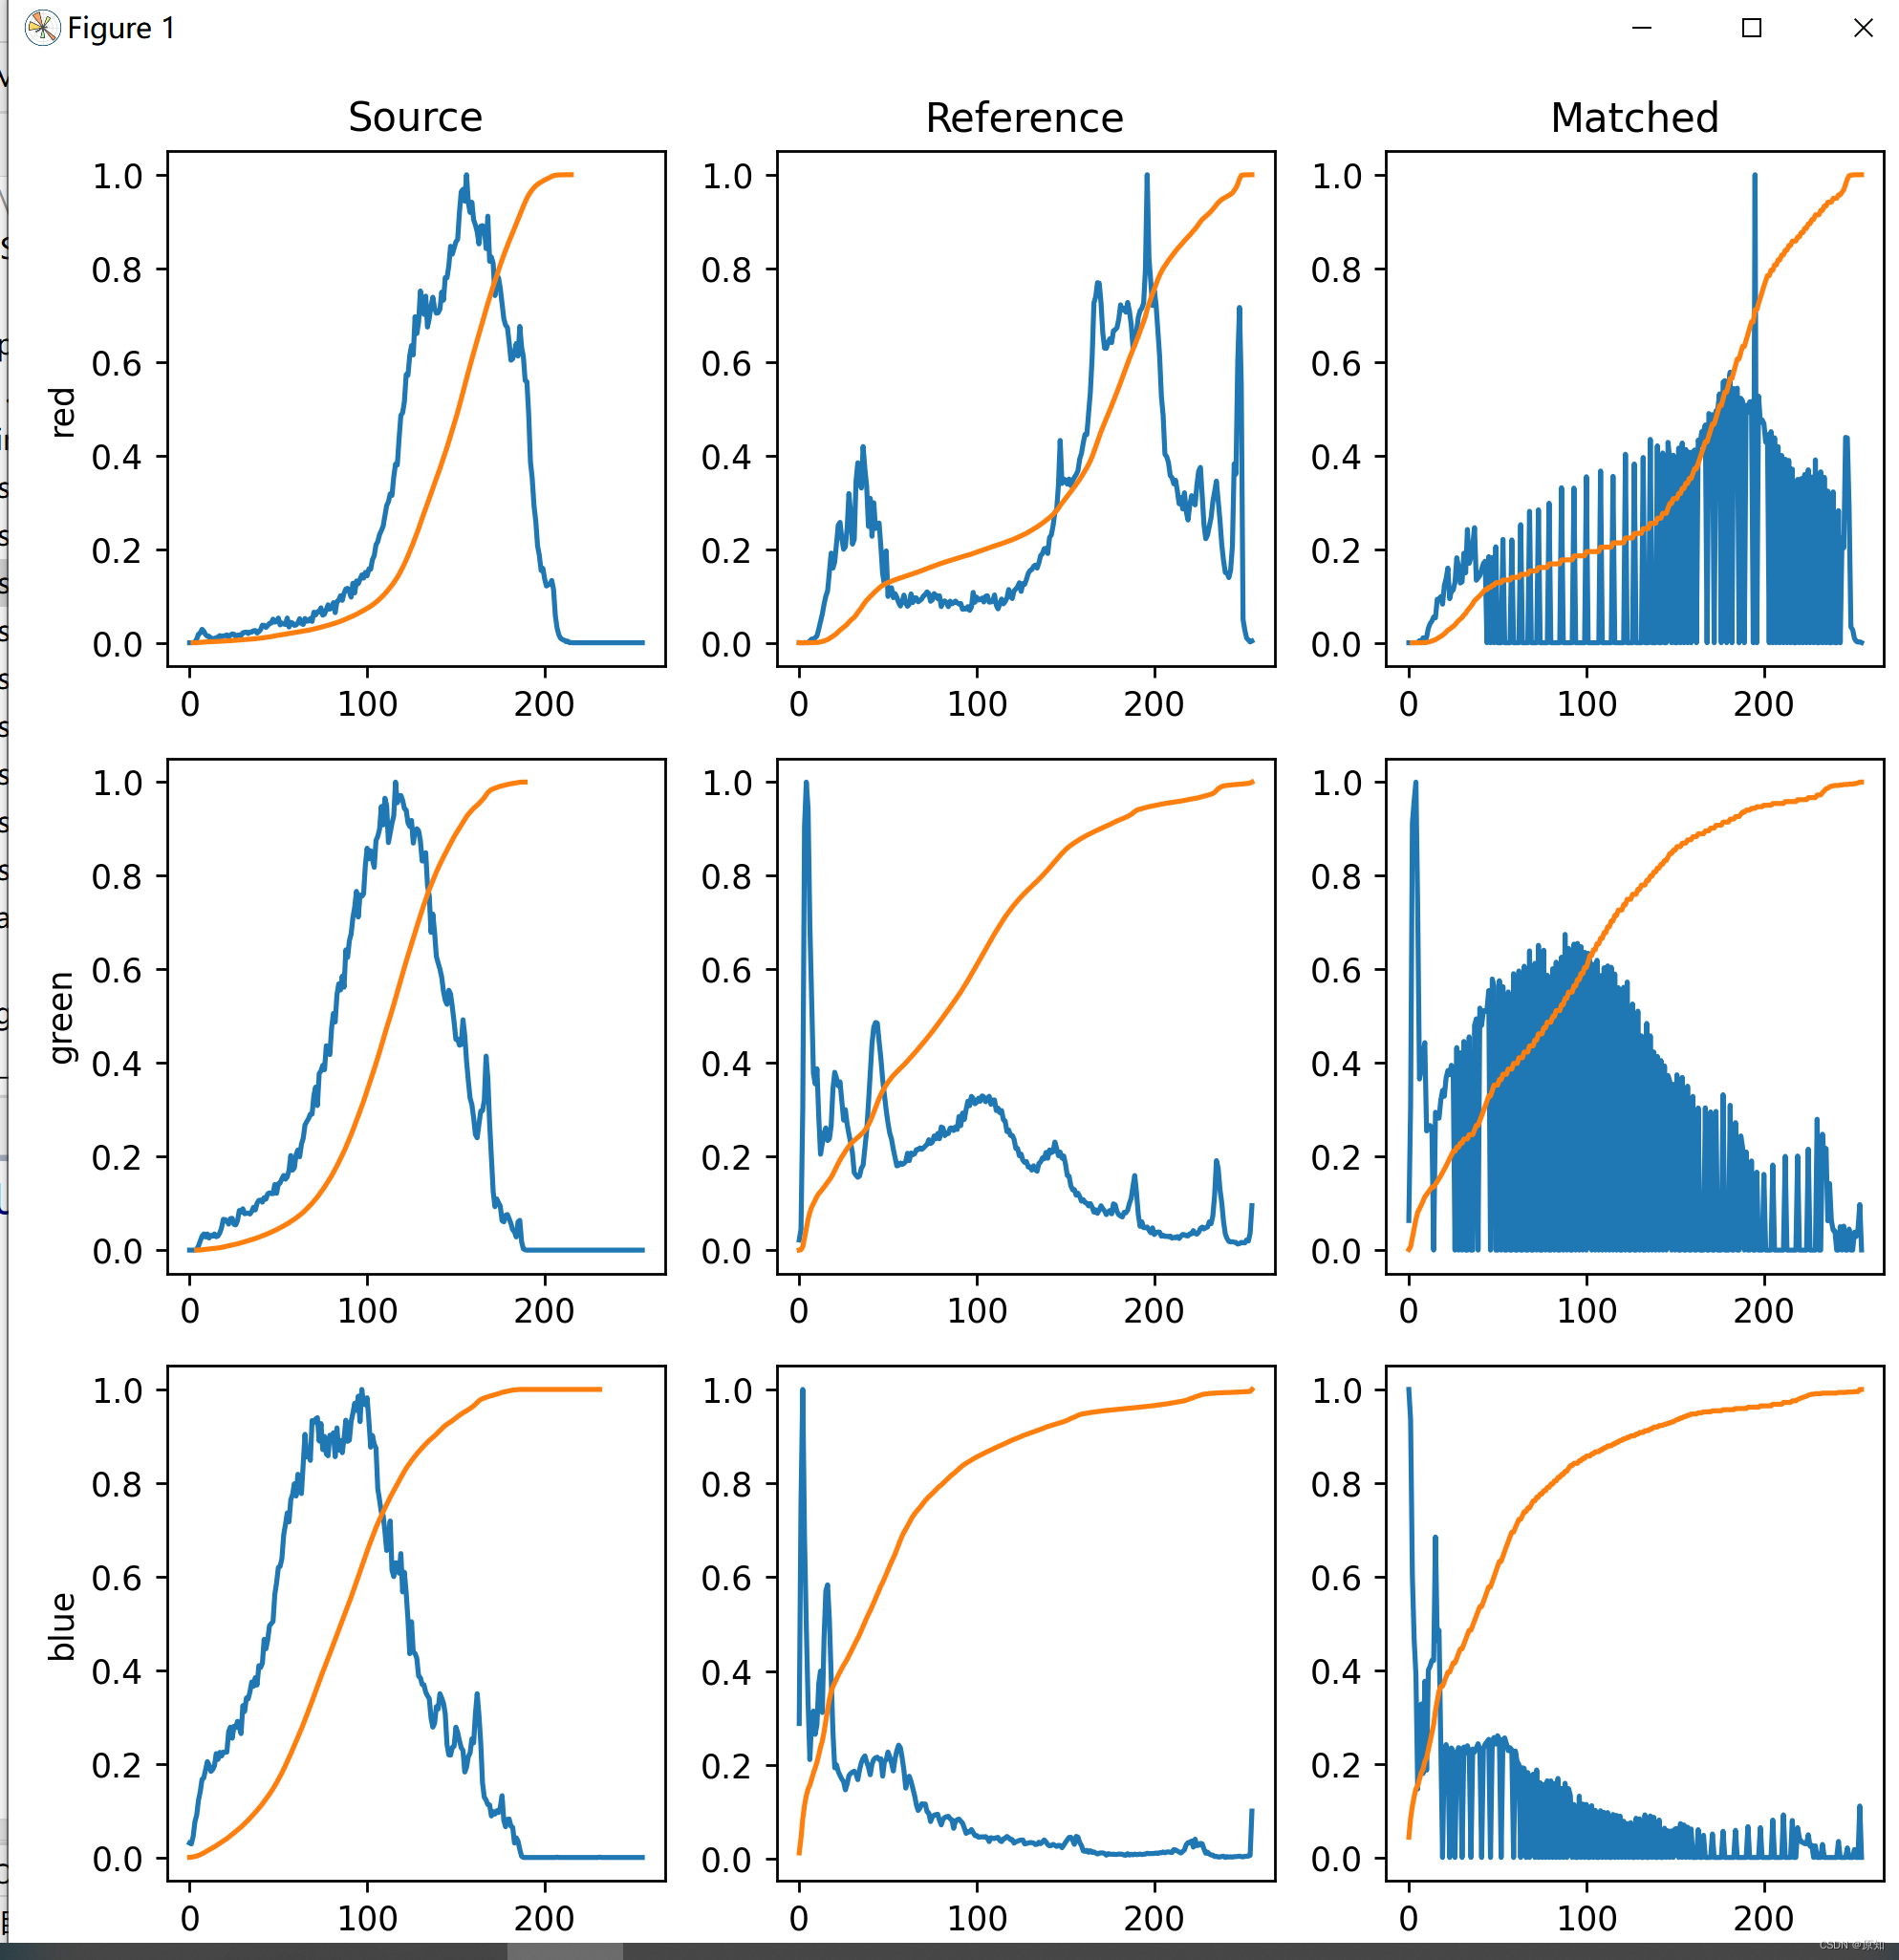
#为了说明直方图匹配的效果,我们绘制每个RGB通道的直方图和累积直方图。
# 很明显,每个通道的匹配图像与参考图像具有相同的累积直方图。
fig, axes = plt.subplots(nrows=3, ncols=3, figsize=(8, 8))

#enumerate使得多了一个索引,同时还能读取到元素
for i, img in enumerate((image, reference, matched)):
    for c, c_color in enumerate(('red', 'green', 'blue')):
        img_hist, bins = exposure.histogram(img[..., c], source_range='dtype')
        #各组数据除以数据中的最大值就是归一化处理。处理后最大值为1,其余的值均为小于 1 的数。
        #直方图中bin的含义:计算颜色直方图需要将颜色空间划分为若干小的颜色区间,即直方图的bin,通过计算颜色在每个小区间内德像素得到颜色直方图,bin越多,直方图对颜色的分辨率越强,但增加了计算机的负担。即(上图所分10个竖条区域,每个竖条区域称为一个bin)
        axes[c, i].plot(bin, img_hist / img_hist.max())

        img_cdf, bins = exposure.cumulative_distribution(img[..., c])
        axes[c, i].plot(bins, img_cdf)
        axes[c, 0].set_ylabel(c_color)
        print(c,i)
axes[0, 0].set_title('Source')
axes[0, 1].set_title('Reference')
axes[0, 2].set_title('Matched')

plt.tight_layout()
plt.show()
注解:
1、返回图像的直方图
cucim.skimage.exposure.histogram(image, nbins=256, source_range='image', normalize=False)
返回图像的直方图,与 numpy.histogram 不同,此函数返回 bin 的中心,并且不会重新组合整数数组。
对于整数数组,每个整数值都有自己的 bin,这提高了速度和intensity-resolution。
在展平图像上计算直方图:对于彩色图像,应在每个通道上单独使用该函数以获得每个颜色通道的直方图。
参数:
image:数组,输入图像。
nbins:整数,可选,用于计算直方图的 bin 数量。对于整数数组,此值将被忽略。
source_range:字符串,可选,‘image’(默认)确定输入图像的范围。 ‘dtype’ 确定该数据类型图像的预期范围。
normalize:布尔型,可选,如果为 True,则通过其值的总和对直方图进行归一化。
返回值:
hist:数组,直方图的值。
bin_centers:数组,bin中心的值。
2、返回给定图像的累积分布函数 (cdf)。
cucim.skimage.exposure.cumulative_distribution(image, nbins=256)
参数:
image:数组,图像阵列。
nbins:整数,可选,图像直方图的 bin 数量。
返回:
img_cdf:数组,累积分布函数的值。
bin_centers:数组,箱子的中心。
3、直方图匹配(histogram matching)
含义:使源图像的累积直方图和目标图像一致
from skimage.exposure import match_histograms
参数1:源图像;参数2:目标图像;参数3:多通道匹配
matched = match_histograms(image, reference, multichannel=True)
边栏推荐
- Lie cow count (spring daily question 53)
- LeetCode 1626. 无矛盾的最佳球队 每日一题
- 3000 words speak through HTTP cache
- 华东师大团队提出,具有DNA调控电路的卷积神经网络的系统分子实现
- Arduino 控制的双足机器人
- Three. JS series (3): porting shaders in shadertoy
- 【图像传感器】相关双采样CDS
- Talk about the realization of authority control and transaction record function of SAP system
- 如何选择合适的自动化测试工具?
- 如何快速检查钢网开口面积比是否符合 IPC7525
猜你喜欢
Personal notes of graphics (4)
【医学分割】attention-unet
ByteDance Android gold, silver and four analysis, Android interview question app
【C 语言】 题集 of Ⅹ

C语言进阶——函数指针

预测——灰色预测
面向接口编程

time标准库
Personal notes of graphics (1)
Sort out several important Android knowledge and advanced Android development interview questions
随机推荐
Cesium (4): the reason why gltf model is very dark after loading
如何选择合适的自动化测试工具?
three. JS create cool snow effect
1亿单身男女“在线相亲”,撑起130亿IPO
QT 图片背景色像素处理法
华东师大团队提出,具有DNA调控电路的卷积神经网络的系统分子实现
Geoserver2.18 series (5): connect to SQLSERVER database
Laravel changed the session from file saving to database saving
[summary of knowledge] summary of notes on using SVN in PHP
Personal notes of graphics (4)
《产品经理必读:五种经典的创新思维模型》的读后感
Set the route and optimize the URL in thinkphp3.2.3
【DesignMode】模板方法模式(Template method pattern)
[designmode] template method pattern
Opportunity interview experience summary
Direct dry goods, 100% praise
typescript ts 基础知识之类型声明
Sqlserver2014+: create indexes while creating tables
Advanced C language -- function pointer
最新Android高级面试题汇总,Android面试题及答案
