当前位置:网站首页>De debugging (set the main thread as hidden debugging to destroy the debugging Channel & debugger detection)
De debugging (set the main thread as hidden debugging to destroy the debugging Channel & debugger detection)
2022-07-05 03:33:00 【#A#】
Debugging is essentially the next int3( abnormal ), There's an exception , The debugger will receive an exception , Will give the opportunity to deal with , Find the debugger before processing , Find the debugger after processing , Find the debugger twice . Using the functions of the driver layer can hide the thread settings under debugging , The original meaning is that the process does not debug , But the consequence is when the thread itself is attached with a debugger , Originally, one int3 The breakpoint of , What happens is an exception , There will be exceptions here , The debugger doesn't handle
Because it is an undisclosed function , You need to load the export table first
void GameProtect::AntiDebug()
{
auto hNtdll = LoadLibrary(L"ntdll.dll");
if (hNtdll)
{
ZwSetInfomationThreadPtr ZwSetInfomationThread;
ZwSetInfomationThread = (ZwSetInfomationThreadPtr)GetProcAddress(hNtdll, "ZwSetInformationThread");
ZwSetInfomationThread((DWORD)GetCurrentThread(), 0x11, 0x0, 0x0);
}
}
test : next int3 Breakpoint direct GG
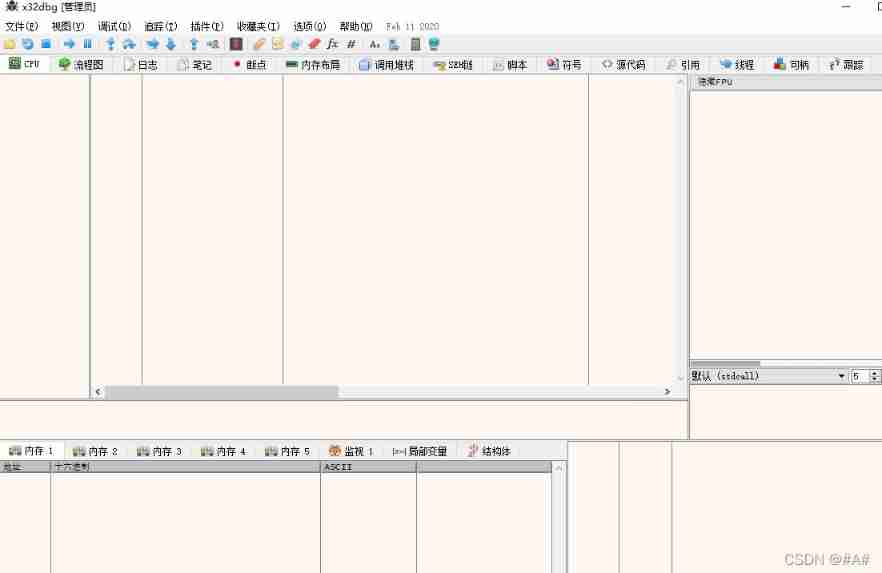
Because the next one int3 Breakpoints essentially produce an exception , Exception find the debugger and find that the debugger does not respond , Go back to the program to deal with , The program cannot handle , Find the debugger , The debugger crashes when it ignores it
Use these functions to be obscene , Otherwise, when reverse analysis, look at the string table directly GG, It's better to use the login to send the address directly
Debugger detection :
adopt BeingDebugged testing :
// testing PEB structure
	BOOL debug = IsDebuggerPresent();
	BOOL _debug;
	CheckRemoteDebuggerPresent(GetCurrentProcess(), &_debug);

	if (debug)AfxMessageBox(L"IsDebuggerPresent  Debugger detected ");
	if (_debug)AfxMessageBox(L"CheckRemoteDebuggerPresent  Debugger detected ");
Compile operation use x32DBG additional :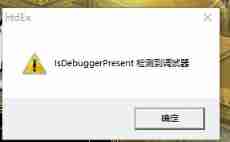
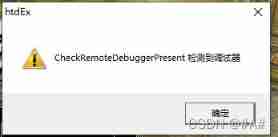
It was detected .
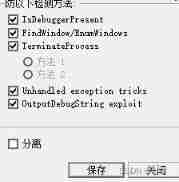
General debugger such as OD Will dispose of this place It has plug-ins that can fix this place , In essence, it's going to be beingdebug Field processed
commonly BeingDebugged The detection of is of little use The assembly code is directly changed 0 perhaps HOOK This function can also pass
OD Plug in for :
Detect the debugger through kernel properties :
In principle application layer Access to kernel mode is not available , But Microsoft still left a hole .
utilize NtQueryInformationProcess pick up information :
NTSTATUS(NTAPI* NtQueryInformationProcess)(
	HANDLE ProcessHandle,// Process handle
	DWORD ProcessInformationClass,// Information types
	PVOID ProcessInformation,// Information pointer
	ULONG ProcessInformationLength,// Information pointer size
	PULONG ReturnLength  // Write buffer size
	)
PROCESSINFOCLASS 0x7   DebugPort
PROCESSINFOCLASS 0x1E  DebugObjectHandle
PROCESSINFOCLASS 0x1F  DebugFlags
The third parameter is an enumeration type But with DWORD Also yes
BOOL GameProtect::CheckDebugByNT()
{
    //
    DWORD debug_port = 0;
    NtQueryInfomationProcess(HProcess, 0x07, &debug_port, sizeof(debug_port), 0x0);
    if (debug_port)return TRUE;
    HANDLE debug_object = 0;
    // testing DBGOBJECT
    NtQueryInfomationProcess(HProcess, 0x1E, &debug_object, sizeof(debug_object), 0x0);
    if (debug_object)return TRUE;
    BOOL debug_flags = 1;
	NtQueryInfomationProcess(HProcess, 0x1F, &debug_flags, sizeof(debug_flags), 0x0);
	if (!debug_flags)return TRUE;
    return FALSE;
}边栏推荐
- LeetCode 234. Palindrome linked list
- Acwing第 58 场周赛【完结】
- Sqoop命令
- Tencent cloud, realize image upload
- 51 independent key basic experiment
- Sqoop安装
- Three line by line explanations of the source code of anchor free series network yolox (a total of ten articles, which are guaranteed to be explained line by line. After reading it, you can change the
- Talk about the SQL server version of DTM sub transaction barrier function
- Kuboard
- [Yu Yue education] National Open University autumn 2018 8109-22t (1) monetary and banking reference questions
猜你喜欢

Apache build web host
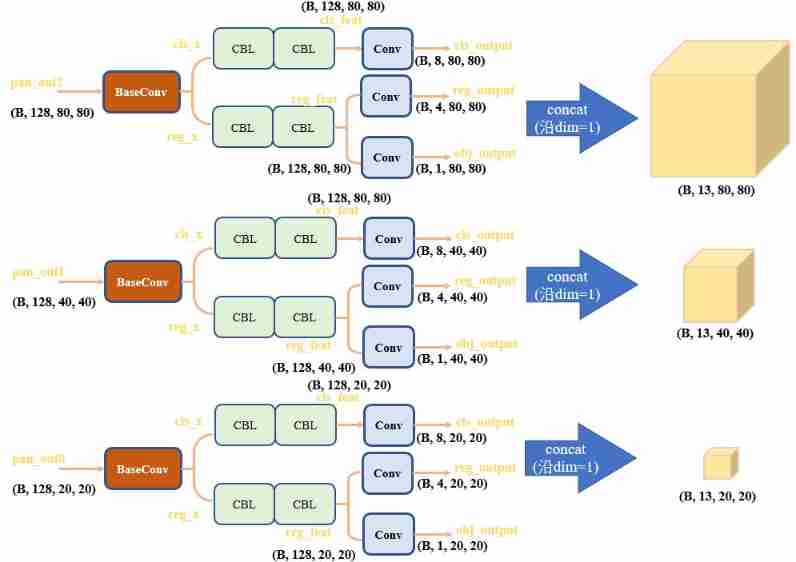
Three line by line explanations of the source code of anchor free series network yolox (a total of ten articles, which are guaranteed to be explained line by line. After reading it, you can change the

Port, domain name, protocol.

The perfect car for successful people: BMW X7! Superior performance, excellent comfort and safety
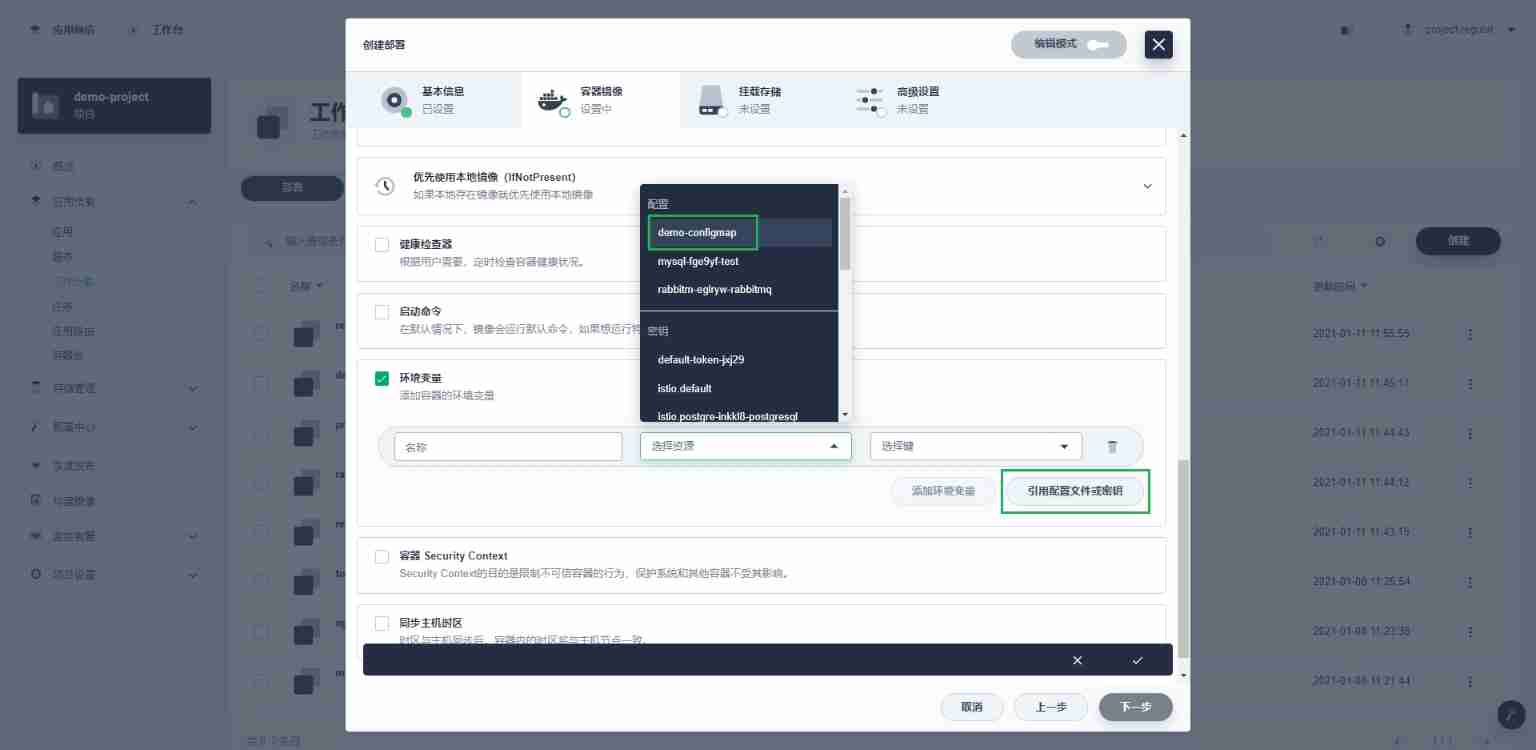
Use of kubesphere configuration set (configmap)
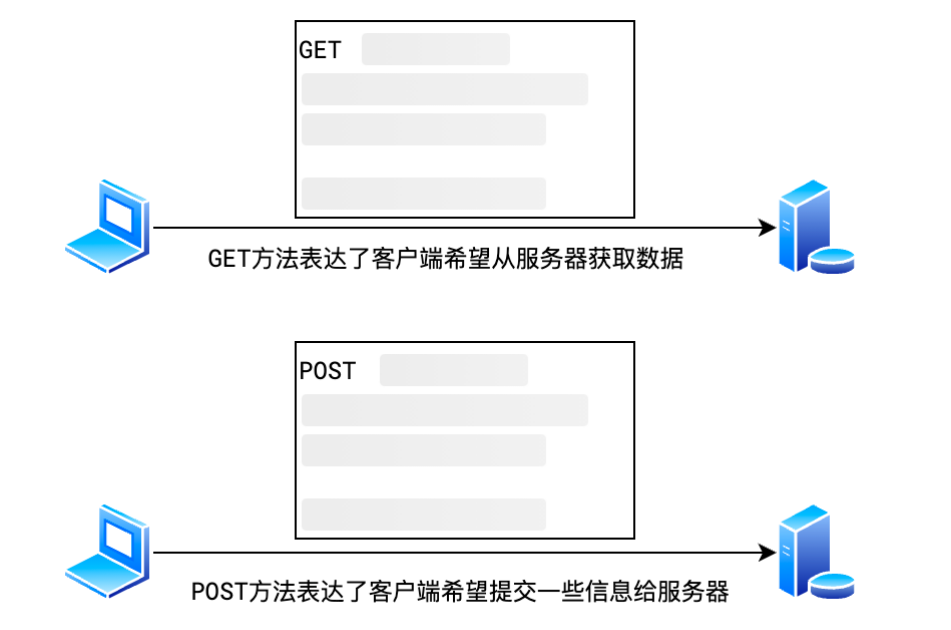
2. Common request methods
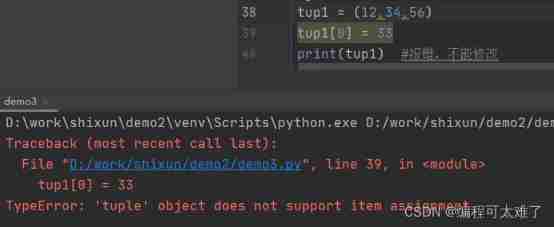
Basic knowledge of tuples
![[groovy] groovy environment setup (download groovy | install groovy | configure groovy environment variables)](/img/99/bb05b6c48a9e70ca7ff77733d954b9.jpg)
[groovy] groovy environment setup (download groovy | install groovy | configure groovy environment variables)
![Acwing game 58 [End]](/img/16/c55e0a7aedc354f1c739637ed13a6b.png)
Acwing game 58 [End]
Smart pointer shared_ PTR and weak_ Difference of PTR
随机推荐
为什么腾讯阿里等互联网大厂诞生的好产品越来越少?
v-if VS v-show 2.0
Use of kubesphere configuration set (configmap)
Azkaban概述
El select, El option drop-down selection box
In MySQL Association query, the foreign key is null. What if the data cannot be found?
Mongodb common commands
Kubernetes - identity and authority authentication
问下,这个ADB mysql支持sqlserver吗?
About MySQL database connection exceptions
Acwing第 58 场周赛【完结】
LeetCode146. LRU cache
New interesting test applet source code_ Test available
看 TDengine 社区英雄线上发布会,听 TD Hero 聊开发者传奇故事
Utilisation simple de devtools
LeetCode 234. Palindrome linked list
Unity implements the code of the attacked white flash (including shader)
Sqoop安装
How to define a unified response object gracefully
腾讯云,实现图片上传