当前位置:网站首页>Matplotlib drawing 3D graphics
Matplotlib drawing 3D graphics
2022-07-07 19:22:00 【En^_^ Joy】
use Matplotlib Draw a three-dimensional picture
Three dimensional drawing needs mplot3d modular , Add projection='3d' keyword , To create a three-dimensional coordinate axis
import matplotlib.pyplot as plt
from mpl_toolkits import mplot3d
import numpy as np

fig = plt.figure()
ax = plt.axes(projection='3d')

#  Drawing code

#  display picture
plt.show()
The following code omits these codes , Put the following code into the drawing code 
3D data points and lines
use ax.plot3D And ax.scatter3D To create line and scatter diagrams of three-dimensional coordinates , The parameters of three-dimensional function are basically the same as those of two-dimensional function
#  Data of 3D lines
zline = np.linspace(0, 15, 1000)
xline = np.sin(zline)
yline = np.cos(zline)
ax.plot3D(xline, yline, zline, 'gray')

#  Three dimensional scatter data
zdata = 15*np.random.random(100)
xdata = np.sin(zdata)+0.1*np.random.randn(100)
ydata = np.cos(zdata)+0.1*np.random.randn(100)
ax.scatter3D(xdata, ydata, zdata, c=zdata, cmap='Greens')
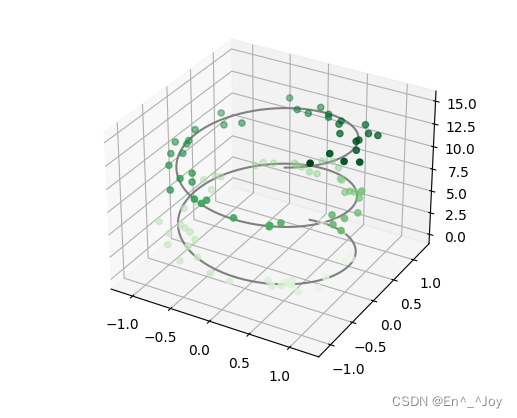
By default , Scatter will automatically change the transparency , To present a three-dimensional sense on the plane
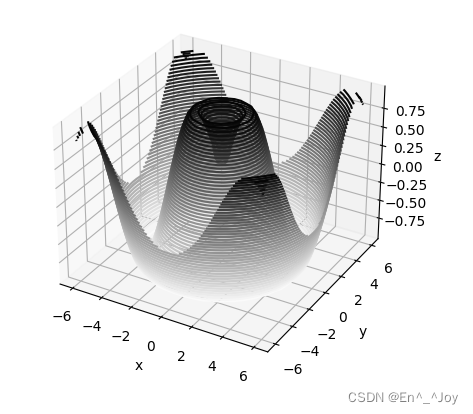
Three dimensional contour map
ax.contour3D All data is required to be in the format of two-dimensional grid data , Calculated by function z Axis numerical
def f(x, y):
    return np.sin(np.sqrt(x**2 + y**2))

x = np.linspace(-6, 6, 30)
y = np.linspace(-6, 6, 30)

X, Y = np.meshgrid(x, y)
Z = f(X, Y)

ax.contour3D(X, Y, Z, 50, cmap='binary')
ax.set_xlabel('x')
ax.set_ylabel('y')
ax.set_zlabel('z')
view_init You can adjust the observation angle and azimuth , In this case , Adjust the pitch angle to 60 degree , The azimuth is adjusted to 35 degree , Add the following line of code to the above code :
ax.view_init(60, 35)
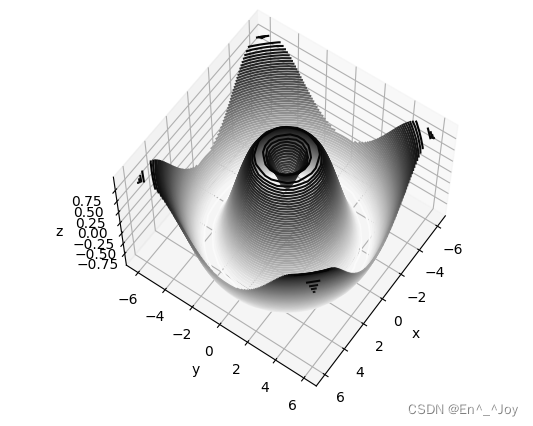
You can also click and drag the figure in the figure to change the angle
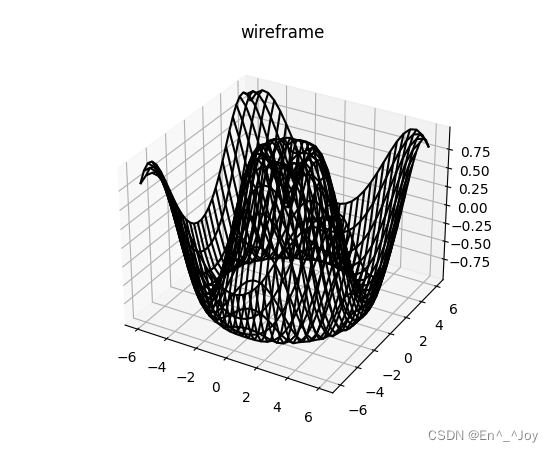
Wireframe and surface diagrams
ax.plot_wireframe Drawing wireframes
def f(x, y):
    return np.sin(np.sqrt(x**2 + y**2))

x = np.linspace(-6, 6, 30)
y = np.linspace(-6, 6, 30)

X, Y = np.meshgrid(x, y)
Z = f(X, Y)

ax.plot_wireframe(X, Y, Z, color='black')
ax.set_title('wireframe')
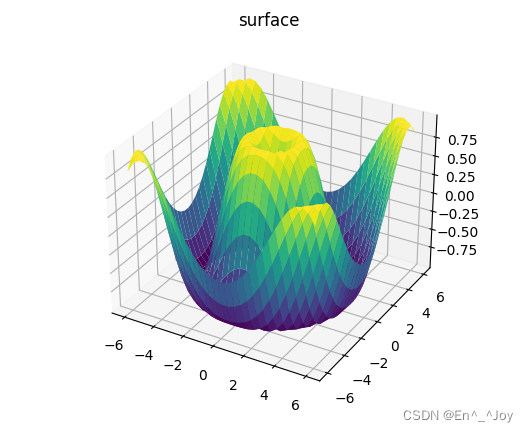
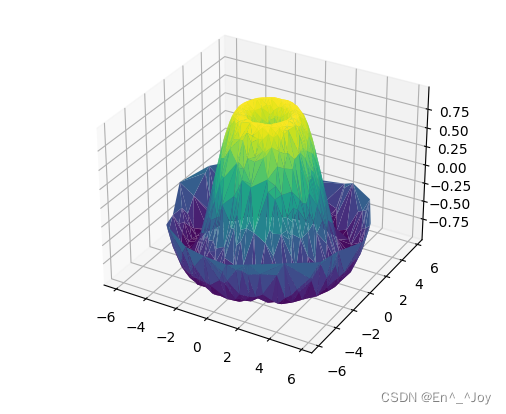
ax.plot_surface Draw the surface
def f(x, y):
    return np.sin(np.sqrt(x**2 + y**2))

x = np.linspace(-6, 6, 30)
y = np.linspace(-6, 6, 30)

X, Y = np.meshgrid(x, y)
Z = f(X, Y)

ax.plot_surface(X, Y, Z, rstride=1, cstride=1, cmap='viridis', edgecolor='none')
ax.set_title('surface')
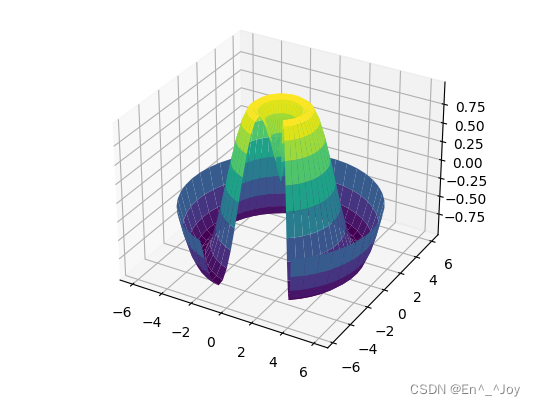
The two-dimensional data of drawing surface graph can be rectangular coordinate system data , It can also be polar data , Here is Polar data Created diagram
def f(x, y):
    return np.sin(np.sqrt(x**2 + y**2))

r = np.linspace(0, 6, 20)
theta = np.linspace(-0.9*np.pi, 0.8*np.pi, 40)
r, theta = np.meshgrid(r, theta)

X = r * np.sin(theta)
Y = r * np.cos(theta)
Z = f(X, Y)

ax.plot_surface(X, Y, Z, rstride=1, cstride=1, cmap='viridis', edgecolor='none')
Surface triangulation
Which of the above grid data that requires uniform sampling is too rigorous , It's not easy to achieve , If there is no uniform drawing of Cartesian or polar grids , You can use triangulation graphics
ax.scatter Draw the surface graph of 3D sampling
def f(x, y):
    return np.sin(np.sqrt(x**2 + y**2))

r = 6*np.random.random(1000)
theta = 2*np.pi*np.random.random(1000)

X = np.ravel(r * np.sin(theta))
Y = np.ravel(r * np.cos(theta))
Z = f(X, Y)

ax.scatter(X, Y, Z, c=Z, cmap='viridis', linewidth=0.5)
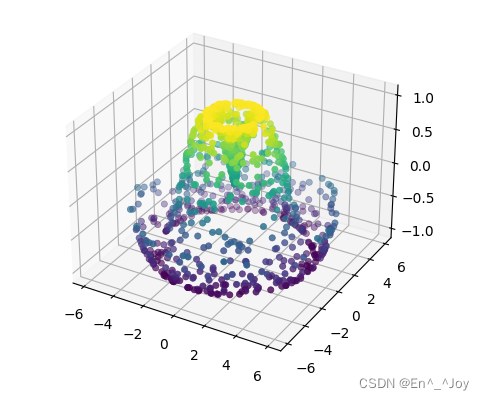
There are still many places in this picture that need to be repaired , Can be ax.plot_trisurf Function to complete , It first finds a set of triangles with all points connected , Then use this triangle to create a surface
def f(x, y):
    return np.sin(np.sqrt(x**2 + y**2))

r = 6*np.random.random(1000)
theta = 2*np.pi*np.random.random(1000)

X = np.ravel(r * np.sin(theta))
Y = np.ravel(r * np.cos(theta))
Z = f(X, Y)

ax.plot_trisurf(X, Y, Z, cmap='viridis', edgecolor='none')
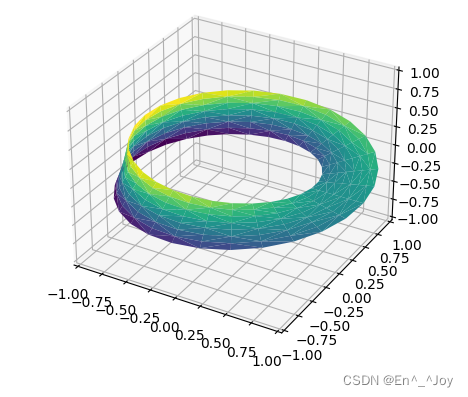
You can draw Mobius takes
theta = np.linspace(0, 2*np.pi, 30)
w = np.linspace(-0.25, 0.25, 8)
w, theta = np.meshgrid(w, theta)

phi = 0.5*theta

# x-y Radius in plane
r = 1+w*np.cos(phi)

x = np.ravel(r*np.cos(theta))
y = np.ravel(r*np.sin(theta))
z = np.ravel(w*np.sin(phi))

#  Define triangulation with basic parametric method
from matplotlib.tri import Triangulation
tri = Triangulation(np.ravel(w), np.ravel(theta))

ax.plot_trisurf(x, y, z, triangles=tri.triangles, cmap='viridis', linewidths=0.2)

ax.set_xlim(-1,1)
ax.set_ylim(-1,1)
ax.set_zlim(-1,1)
边栏推荐
- L1-027 rental (Lua)
- Experiment 1 of Compilation Principle: automatic implementation of lexical analyzer (Lex lexical analysis)
- Business experience in virtual digital human
- 基于图像和激光的多模态点云融合与视觉定位
- Reuse of data validation framework Apache bval
- CMD command enters MySQL times service name or command error (fool teaching)
- AI写首诗
- Teach your sister to write the message queue hand in hand
- 99% of people don't know that privatized deployment is also a permanently free instant messaging software!
- LeetCode 515(C#)
猜你喜欢
How to share the same storage among multiple kubernetes clusters
![[tpm2.0 principle and Application guide] Chapter 9, 10 and 11](/img/7f/0d4d91142bc3d79ea445a8f64afba7.png)
[tpm2.0 principle and Application guide] Chapter 9, 10 and 11

Seize Jay Chou
编译原理 实验一:词法分析器的自动实现(Lex词法分析)
Chief technology officer of Pasqual: analog quantum computing takes the lead in bringing quantum advantages to industry
Realize payment function in applet
Multimodal point cloud fusion and visual location based on image and laser
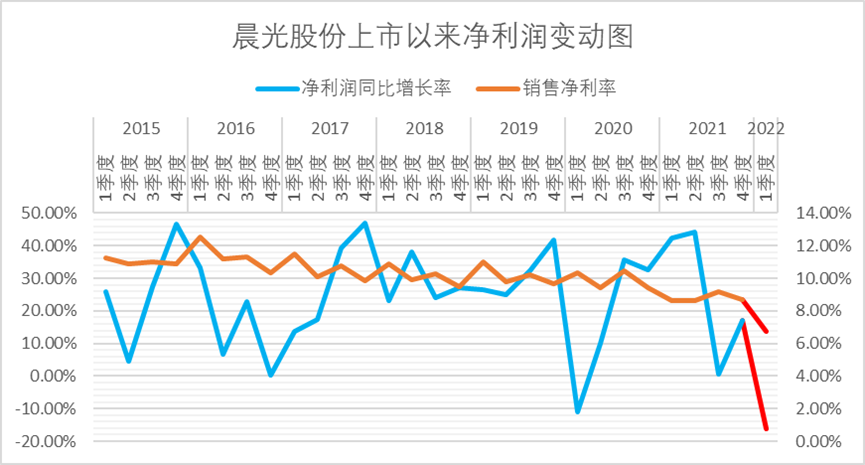
How to estimate the value of "not selling pens" Chenguang?
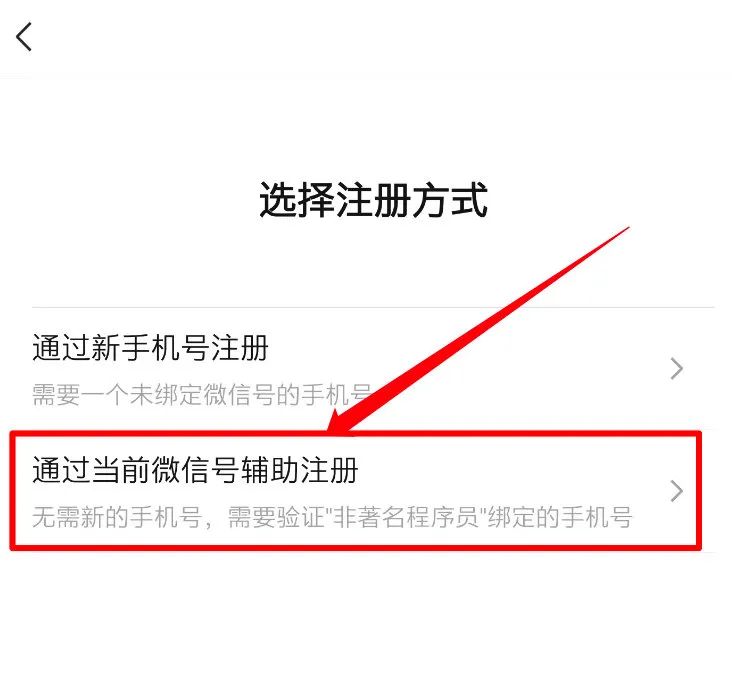
I feel cheated. Wechat tests the function of "size number" internally, and two wechat can be registered with the same mobile number
App capture of charles+postern
随机推荐
ES6笔记一
Basic operation of chain binary tree (implemented in C language)
Learn open62541 -- [67] add custom enum and display name
博睿数据入选《2022爱分析 · IT运维厂商全景报告》
索引总结(突击版本)
抢占周杰伦
3. About cookies
IP netns command (memo)
国内首次!这家中国企业的语言AI实力被公认全球No.2!仅次于谷歌
Embedded interview questions (algorithm part)
Install mysql8 for Linux X ultra detailed graphic tutorial
How to estimate the value of "not selling pens" Chenguang?
Pasqal首席技术官:模拟量子计算率先为工业带来量子优势
高温火烧浑不怕,钟薛高想留清白在人间
Numpy——axis
2022.07.04
Creative changes brought about by the yuan universe
Download from MySQL official website: mysql8 for Linux X Version (Graphic explanation)
Reuse of data validation framework Apache bval
Uvalive – 4621 CAV greed + analysis "suggestions collection"