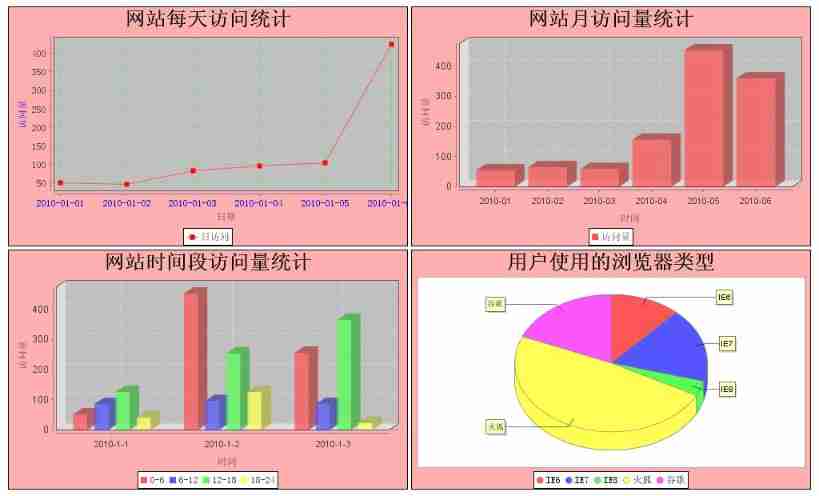
Columnar distribution statistics :
package com.xidian.servlet;import java.awt.Color;import java.awt.Font;import java.io.IOException;import javax.servlet.ServletException;import javax.servlet.http.HttpServlet;import javax.servlet.http.HttpServletRequest;import javax.servlet.http.HttpServletResponse;import org.jfree.chart.ChartFactory;import org.jfree.chart.ChartUtilities;import org.jfree.chart.JFreeChart;import org.jfree.chart.axis.CategoryAxis;import org.jfree.chart.axis.NumberAxis;import org.jfree.chart.plot.CategoryPlot;import org.jfree.chart.plot.PlotOrientation;import org.jfree.chart.renderer.category.BarRenderer;import org.jfree.chart.title.TextTitle;import org.jfree.data.category.DefaultCategoryDataset;/** * Columnar distribution statistics * @ explain * @author cuisuqiang * @version 1.0 * @since */@SuppressWarnings("serial")public class ParagraphsServlet extends HttpServlet { protected void service(HttpServletRequest request, HttpServletResponse response) throws ServletException, IOException { response.setContentType("text/html"); DefaultCategoryDataset dataTime = new DefaultCategoryDataset(); // This is a set of data dataTime.addValue(52, "0-6", "2010-1-1"); dataTime.addValue(86, "6-12", "2010-1-1"); dataTime.addValue(126, "12-18", "2010-1-1"); dataTime.addValue(42, "18-24", "2010-1-1"); // This is a set of data dataTime.addValue(452, "0-6", "2010-1-2"); dataTime.addValue(96, "6-12", "2010-1-2"); dataTime.addValue(254, "12-18", "2010-1-2"); dataTime.addValue(126, "18-24", "2010-1-2"); // This is a set of data dataTime.addValue(256, "0-6", "2010-1-3"); dataTime.addValue(86, "6-12", "2010-1-3"); dataTime.addValue(365, "12-18", "2010-1-3"); dataTime.addValue(24, "18-24", "2010-1-3"); try { DefaultCategoryDataset data = dataTime; // Use ChartFactory establish 3D Histogram , Do not want to use 3D, Use it directly createBarChart JFreeChart chart = ChartFactory.createBarChart3D( " Statistics of website visits during the time period ", " Time ", " Traffic volume ", data, PlotOrientation.VERTICAL, true, false, false ); // Set the background color of the whole picture chart.setBackgroundPaint(Color.PINK); // Set the picture to have a border chart.setBorderVisible(true); Font kfont = new Font(" Song style ", Font.PLAIN, 12); // Bottom Font titleFont = new Font(" Song style ", Font.BOLD, 25); // Picture title // Picture title chart.setTitle(new TextTitle(chart.getTitle().getText(), titleFont)); // Bottom chart.getLegend().setItemFont(kfont); // Get the coordinates, set the font, and solve the garbled code CategoryPlot categoryplot = (CategoryPlot) chart.getPlot(); categoryplot.setDomainGridlinesVisible(true); categoryplot.setRangeCrosshairVisible(true); categoryplot.setRangeCrosshairPaint(Color.blue); NumberAxis numberaxis = (NumberAxis) categoryplot.getRangeAxis(); numberaxis.setStandardTickUnits(NumberAxis.createIntegerTickUnits()); BarRenderer barrenderer = (BarRenderer) categoryplot.getRenderer(); barrenderer.setBaseItemLabelFont(new Font(" Song style ", Font.PLAIN, 12)); barrenderer.setSeriesItemLabelFont(1, new Font(" Song style ", Font.PLAIN, 12)); CategoryAxis domainAxis = categoryplot.getDomainAxis(); /*------ Set up X Text on axis coordinates -----------*/ domainAxis.setTickLabelFont(new Font("sans-serif", Font.PLAIN, 11)); /*------ Set up X The title text of the axis ------------*/ domainAxis.setLabelFont(new Font(" Song style ", Font.PLAIN, 12)); /*------ Set up Y Text on axis coordinates -----------*/ numberaxis.setTickLabelFont(new Font("sans-serif", Font.PLAIN, 12)); /*------ Set up Y The title text of the axis ------------*/ numberaxis.setLabelFont(new Font(" Song style ", Font.PLAIN, 12)); /*------ This code solves the problem of garbled Chinese characters at the bottom -----------*/ chart.getLegend().setItemFont(new Font(" Song style ", Font.PLAIN, 12)); ChartUtilities.writeChartAsJPEG(response.getOutputStream(), 1.0f, chart, 500, 300, null); } catch (Exception es) { es.printStackTrace(); } }}
JSP Upper use IMG Picture to request Servlet display picture :
<%@ page language="java" pageEncoding="UTF-8"%><%String path = request.getContextPath();String basePath = request.getScheme()+"://"+request.getServerName()+":"+request.getServerPort()+path+"/";%><!DOCTYPE HTML PUBLIC "-//W3C//DTD HTML 4.01 Transitional//EN"><html> <head> <base href="<%=basePath%>"> <title></title> <meta http-equiv="pragma" content="no-cache"> <meta http-equiv="cache-control" content="no-cache"> <meta http-equiv="expires" content="0"> <meta http-equiv="keywords" content="keyword1,keyword2,keyword3"> <meta http-equiv="description" content="This is my page"> </head> <body> <center> <img src="LineServlet"> <img src="PillarServlet"> <img src="ParagraphsServlet"> <img src="CakeServlet"> </center> </body></html>
WEB.xml To configure :
<?xml version="1.0" encoding="UTF-8"?><web-app version="2.5" xmlns="http://java.sun.com/xml/ns/javaee" xmlns:xsi="http://www.w3.org/2001/XMLSchema-instance" xsi:schemaLocation="http://java.sun.com/xml/ns/javaee http://java.sun.com/xml/ns/javaee/web-app_2_5.xsd"> <filter> <filter-name>EncodingFilter</filter-name> <filter-class>org.filter.EncodingFilter</filter-class> </filter> <filter-mapping> <filter-name>EncodingFilter</filter-name> <url-pattern>/*</url-pattern> </filter-mapping> <servlet> <servlet-name>LineServlet</servlet-name> <servlet-class>com.xidian.servlet.LineServlet</servlet-class> </servlet> <servlet> <servlet-name>PillarServlet</servlet-name> <servlet-class>com.xidian.servlet.PillarServlet</servlet-class> </servlet> <servlet> <servlet-name>ParagraphsServlet</servlet-name> <servlet-class> com.xidian.servlet.ParagraphsServlet </servlet-class> </servlet> <servlet> <servlet-name>CakeServlet</servlet-name> <servlet-class>com.xidian.servlet.CakeServlet</servlet-class> </servlet> <servlet-mapping> <servlet-name>LineServlet</servlet-name> <url-pattern>/LineServlet</url-pattern> </servlet-mapping> <servlet-mapping> <servlet-name>PillarServlet</servlet-name> <url-pattern>/PillarServlet</url-pattern> </servlet-mapping> <servlet-mapping> <servlet-name>ParagraphsServlet</servlet-name> <url-pattern>/ParagraphsServlet</url-pattern> </servlet-mapping> <servlet-mapping> <servlet-name>CakeServlet</servlet-name> <url-pattern>/CakeServlet</url-pattern> </servlet-mapping> <welcome-file-list> <welcome-file>index.jsp</welcome-file> </welcome-file-list></web-app>
In order to solve the disorder , I configured a filter :
package org.filter;import java.io.IOException;import javax.servlet.Filter;import javax.servlet.FilterChain;import javax.servlet.FilterConfig;import javax.servlet.ServletException;import javax.servlet.ServletRequest;import javax.servlet.ServletResponse;/** * Deal with the mess * @ explain * @author cuisuqiang * @version 1.0 * @since */public class EncodingFilter implements Filter { public void destroy() { } public void doFilter(ServletRequest request, ServletResponse response, FilterChain chain) throws IOException, ServletException { request.setCharacterEncoding("gbk"); response.setCharacterEncoding("gbk"); chain.doFilter(request, response); } public void init(FilterConfig arg0) throws ServletException { }}
Click download attachment
I recommend you to read more about “ jsp servlet jfreechart java report form Histogram The pie chart ” The article

