当前位置:网站首页>Kubernetes business log collection and monitoring
Kubernetes business log collection and monitoring
2020-11-09 11:32:00 【osc_0hs26yvj】
Cluster business log collection

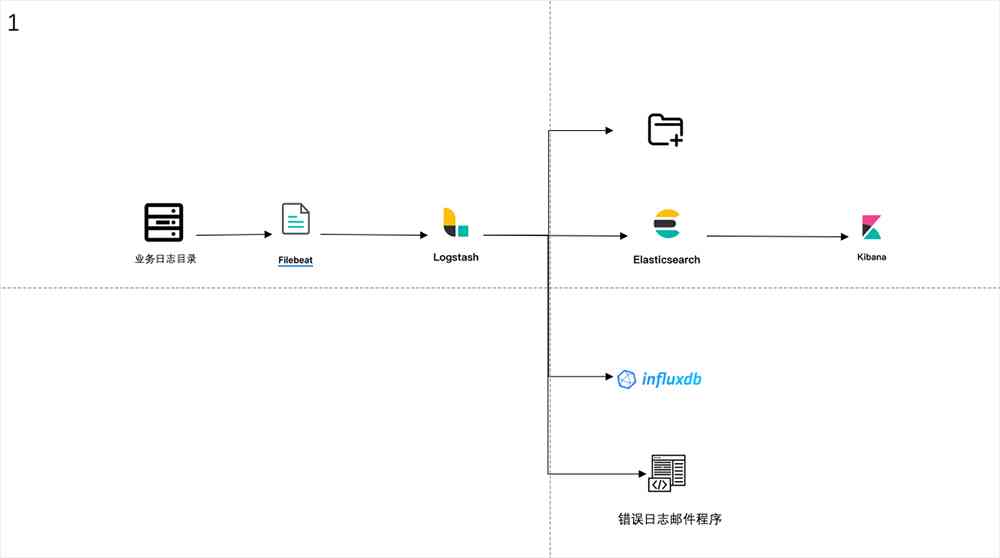
There are some problems with the old log collection architecture :
When Logstash After hanging up, there is the problem of losing logs , Previous upgrades across major versions Logstash If you fail, you lose your log for a period of time .
When Logstash One of the following consumption procedures has been suspended , for example ES Hang up , It will cause the log to write files and write InfluxDB Both have problems and because of Filebeat Will continue to push logs to Logstash This leads to the loss of logs .
The above two problems show that the coupling between components is serious , So it's moving Kubernetes We made some adjustments to the architecture , The adjusted log collection architecture is shown in the figure below 2.
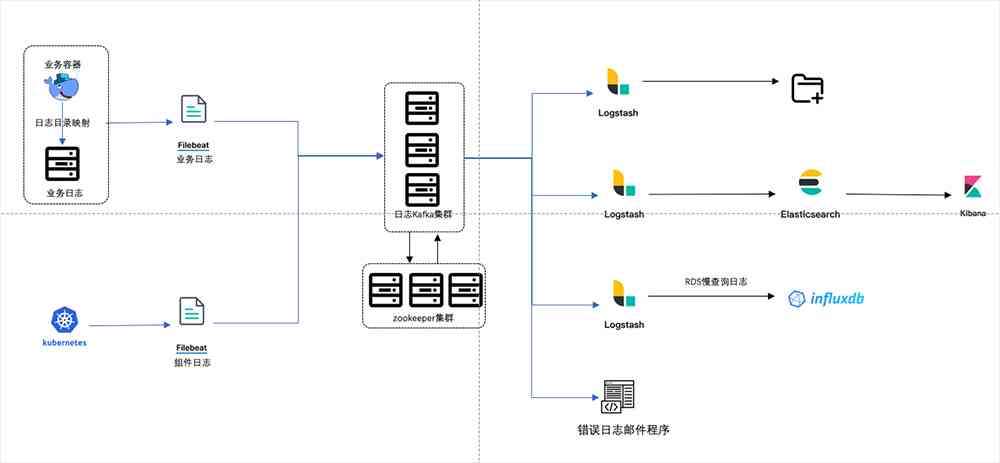
stay Filebeat and Logstash In between Kafka Used to temporarily cache logs , And used to decouple log consumers .
Start multiple Logstash Examples handle writing files separately 、 Connect ES、 Write InfluxDB Thus decoupling the log consumer coupling .
Because business migration requires fast 、 Time is short , There's no time to put all the logs in the container stdout Output , So the container log is mapped to the host , Re pass Filebeat collect , Realization Kubernetes Business log collection in .
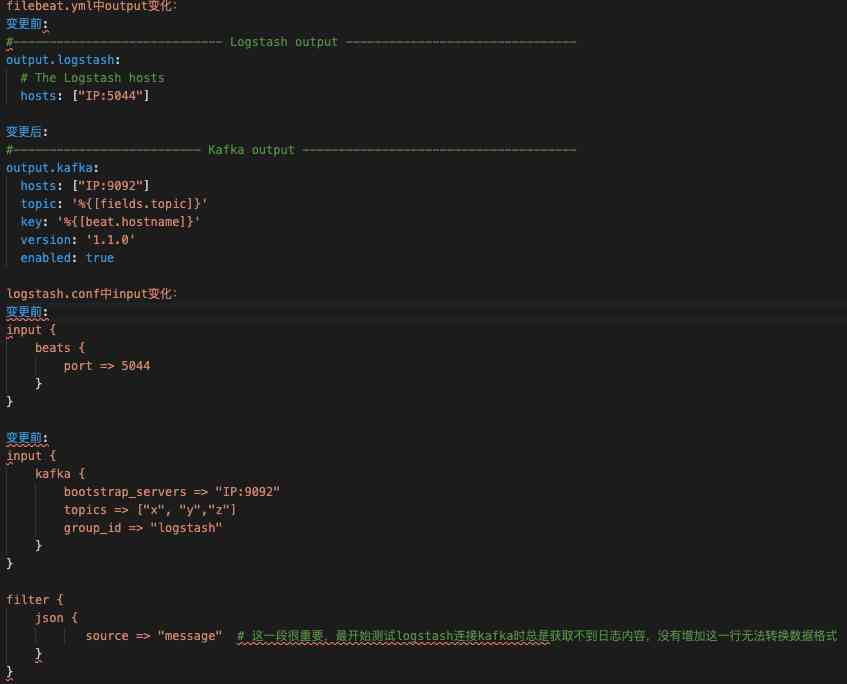
Here is given 1、3 Point change configuration change :
The first 1 The configuration changes brought about by the dot are compared as shown in the figure below 3.
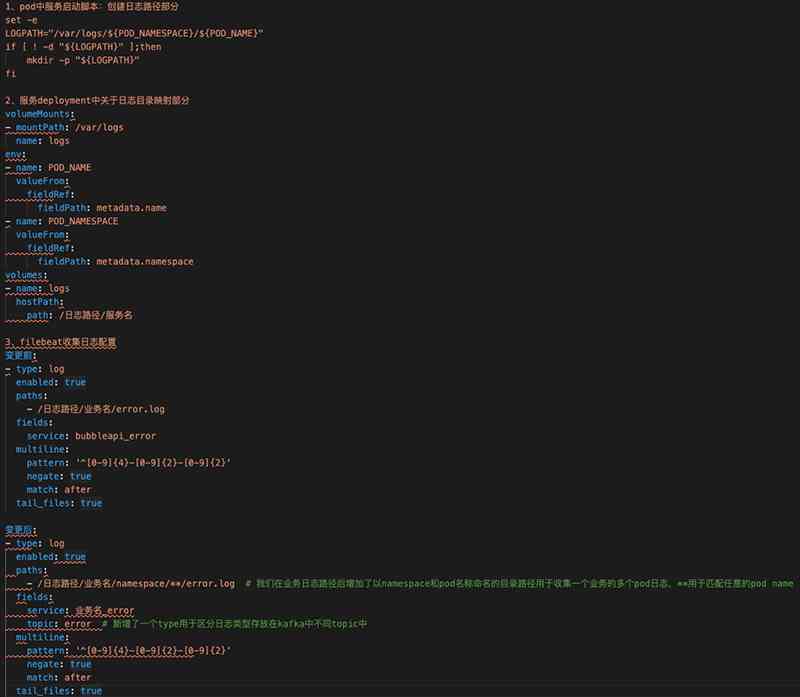
Focus on sharing next 3 A little change : At the beginning, when a new service is added within the company, the collection rules of all log types of the service need to be written directly filebeat.yml file , And then use Ansible Issue to all business machines, restart and Filebeat. This leads to filebeat.yml The files are getting longer and longer 、 Difficult to maintain and an incorrect configuration can lead to Filebeat I can't get up , The log cannot be collected in time . Later, we split each business log collection rule into small ones yaml The documents are stored in /etc/filebeat/inputs.d/ in , Business Filebeat Collection rules are automatically generated by a configuration script from Kubernetes The cluster obtains business namespace And service log path to automatically generate business Filebeat Configure again through Ansible Distribute the configuration to the specified directory . The first 3 Point configuration changes are compared as shown in the figure below 4 in 3 part .
Through the above modifications, we quickly completed the business log in Kubernetes Collection in a cluster , And improve the stability of the log system , It is convenient to upgrade the log system in the future .
Of course, our system also has shortcomings , Now our Filebeat Or use Systemd start-up , Every new one Node, All need to be installed once Filebeat, This node needs to be retrieved and sent to the node automatically , Later we plan to use Kubernetes DaemonSet Pattern to deploy Filebeat And when a new service is added, it's automatically updated Filebeat To configure 、 Use Kubernetes To complete Filebeat install 、 Configuration update .
Cluster state monitoring and business state monitoring
Let's first introduce the functions of each component :
Prometheus Operator:Prometheus It's the initiative to pull the monitoring data , stay Kubernetes in Pod Due to scheduling reasons IP Constantly changing , It's impossible for man to maintain , Automatic discovery is based on DNS Of , But it's still a bit troublesome to add .Prometheus Operator Is a group of user-defined CRD Resources and Controller The implementation of the ,Prometheus Operator This controller Yes RBAC jurisdiction 、 Responsible for monitoring the changes of these custom resources , And according to the definition of these resources, automatic completion such as Prometheus Server Automatic management of self and configuration .
Kube-state-metrics: Can collect most of Kubernetes Built in resource related data , for example Pod、Deploy、Service etc. . It also provides its own data , It is mainly the statistics of the number of resource collection and the number of abnormal collection . For example, how many Replicas? There are several available now ? How many? Pod yes running/stopped/terminated state ?Pod How many times did it restart ? And so on, these state values can be added by Prometheus rule To generate an alarm , Inform operation and maintenance and developers in time .
Prometheus: Used to collect cluster components Metric And various resource states in the cluster Metric And custom implementation of monitoring Metric data .
AlertManager: Deal with by Prometheus The alarm from the server and other clients . It's responsible for removing duplicate data 、 grouping , And route the alert to the right receiver , Like email 、Webhook etc. .
stay Kubernetes Before the central office's business , Both the monitoring system and the log collection system need to be installed in advance , Because the business is divided into regions and other reasons, there are multiple clusters in our company , Each cluster deployment area is not consistent , So when deploying monitoring services , Our solution is to create a complete set of monitoring system in each cluster , Because our business doesn't belong to PV Large business and small cluster size , Therefore, it is reasonable to have a monitoring system for each cluster . Each component service in the monitoring system is stored in a separate namespace in , Direct adoption YAML Way to install , Not used helm install . The cluster monitoring architecture is shown in the figure below 5.
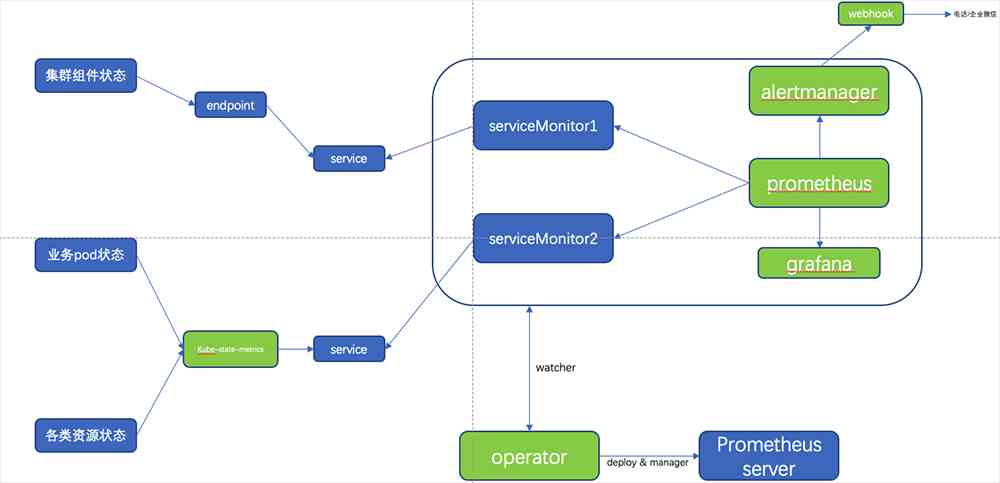
As can be seen from the figure, we mainly collected three aspects of monitoring data :
Cluster components : We have collected API、Controller、Scheduler、Kubelet、CoreDNS Five components of Metrics, Because our cluster is installed in binary mode , So some of the components Metric(Controller、Scheduler) Data acquisition needs to be configured by yourself Endpoints And cooperate with Service and ServiceMonitor complete Metric The collection of . Here's how Controller Of Endpoints、Service、ServiceMonitor The configuration is as follows 6.
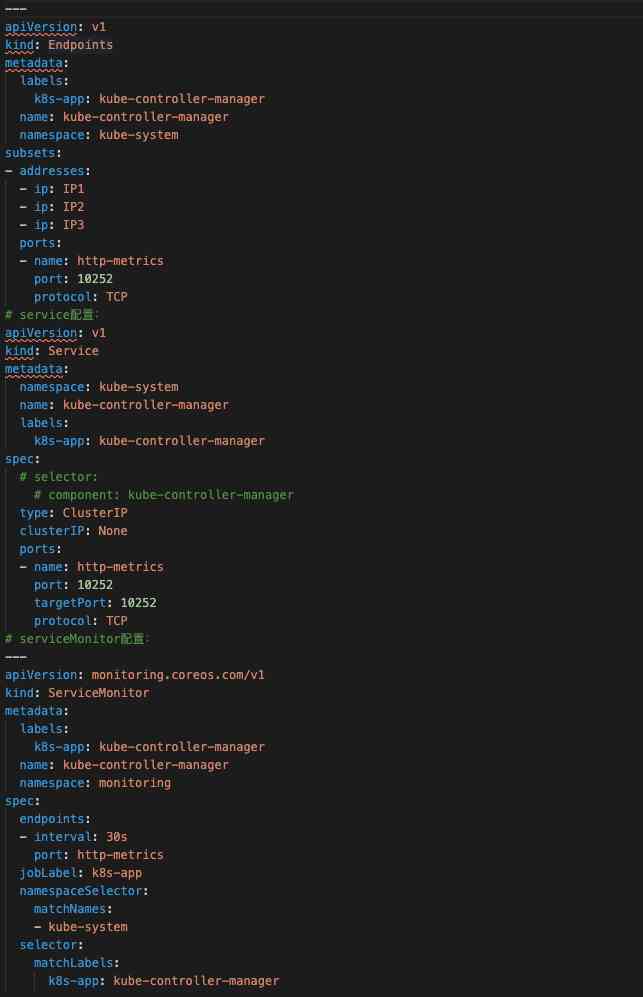
chart 6 Controller To configure
Pod State and resource state : These two aspects of Metric from kube-state-metrics Components complete the collection , as for kube-state-metrics I will not introduce more about the functions of There are good introductions both online and official .
And about the Prometheus Operator、Prometheus、Alertmanager、kube-state-metrics Deployment of , There are also many online tutorials , It's fun to build and solve problems by ourselves , You can also check my GitHub Warehouse :https://github.com/doubledna/k8s-monitor, Refer to installation .
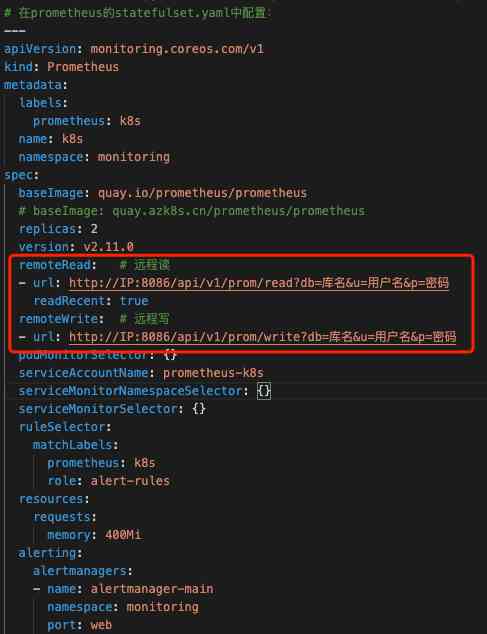
Here's the point Prometheus Storage , because Prometheus Deployed in Kubernetes Cluster and Pod It's dying at any time , So direct local storage is not appropriate , You can also use it PV To store , But now there are a lot of good and perfect Prometheus Remote storage options are available , Remote storage scheme is recommended . Our company adopts InfluxDB As Prometheus Remote storage solution , stand-alone InfluxDB The performance has been very strong, basically meet the daily needs , But because his cluster solution is not open source , There is a single point of failure . So you can choose other remote storage solutions to avoid this problem .Prometheus Connect InfluxDB The configuration is as follows 7.
About the police . In order to unify all kinds of alarm resources and alarm information format , An alarm was developed by the architecture department API Program , If other departments need to use, just convert the alarm content to specific Json Format sent to the alarm API The alarm information can be pushed to the personal phone 、 mailbox 、 SMS 、 In enterprise wechat . So in Alertmanager We adopted Webhook Patterns emit Json Format alarm data to specified API, It is suggested that students with ability should adopt this mode Self processing alarm data , Instead of using the default configuration method to send email or wechat , The default alarm format is not very beautiful .
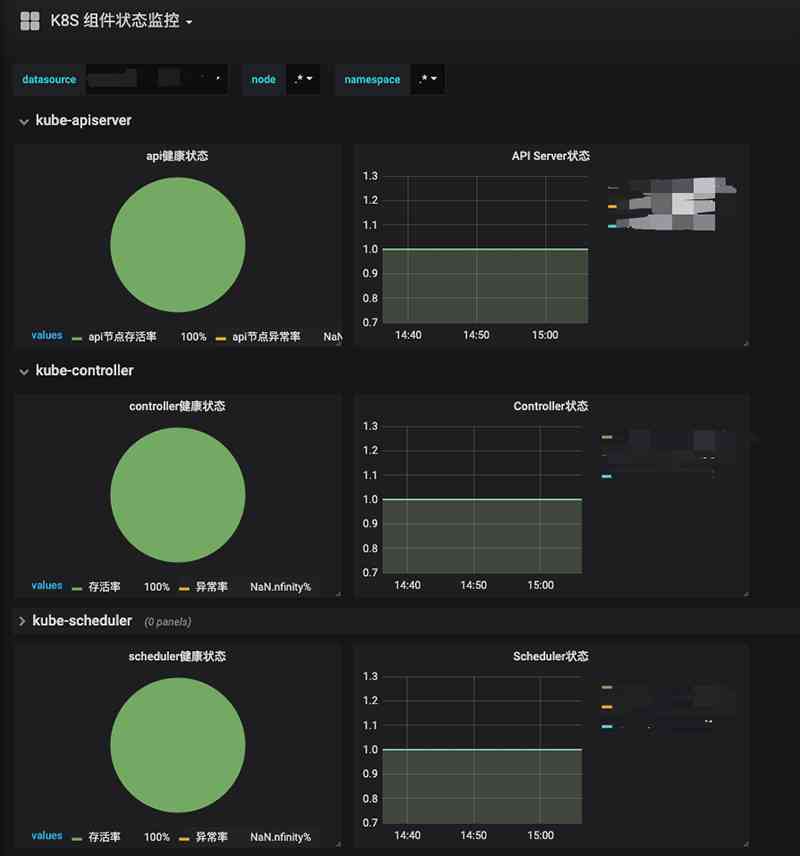
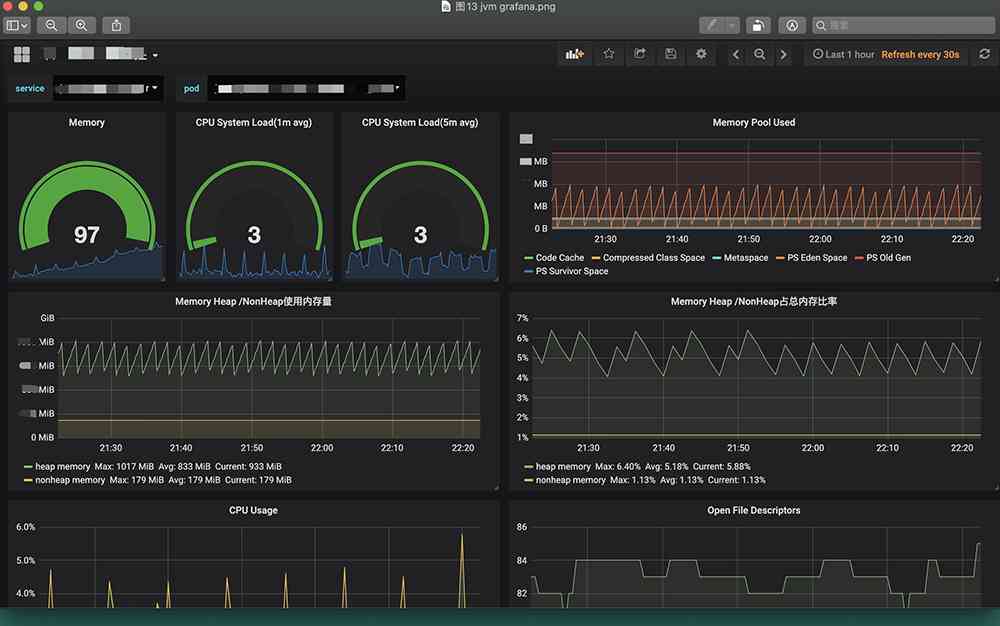
Of course, in terms of data presentation Grafana 了 ,Grafana The display effect picture is as follows 8 And graph 9, My graphics configuration is also based on Grafana Other students' templates in the official template , You can download your own template from the official website .
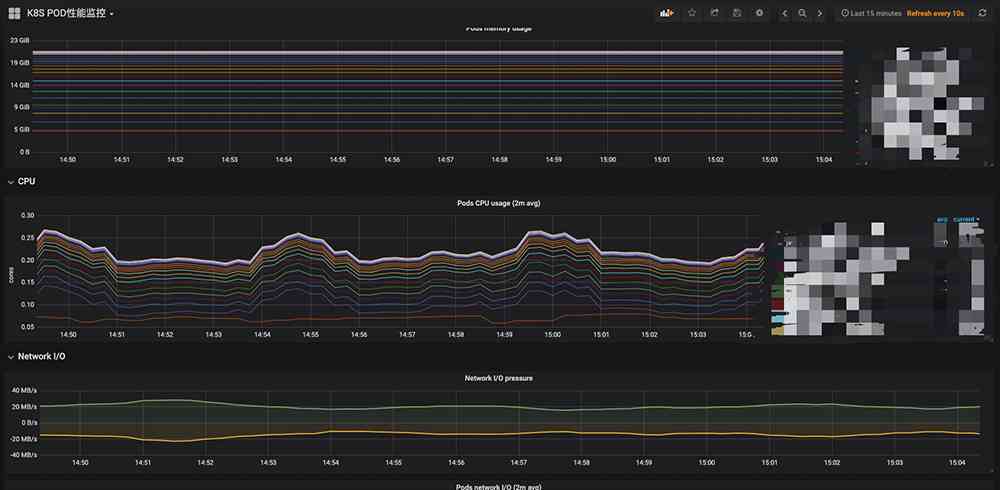
To sum up , For small and medium-sized enterprises, open source is adopted Prometheus Operator A package of tools to quickly build Kubernetes The monitoring system is perfect , This system can basically handle in Kubernetes Monitor business status and component status in , Of course, this system also has some shortcomings :
Event monitor / collect : stay Kubernetes in Pod The deployment process of will generate some events , These events will record Pod Life cycle and scheduling of . also event It's not persistent in a cluster . If you need to know the cluster Pod Scheduling of , And collecting event As an audit or other function , And when there are more and more businesses in the cluster , It is not likely to go to the cluster in real time to view event, that event Monitoring of / Collection is very important . I've been learning about Ali recently event Collection tool kube-eventer, It looks good , Interested students can discuss how to build .
In some cases Prometheus Too many alarm messages are generated 、 all too often : Although we've adjusted some of the Prometheus rule In the rules and changed rule Alarm generation frequency in , But in practical application, we occasionally encounter the problem of a large number of alarm information when a node fails . Although these alarm messages are useful , But too much information interferes with troubleshooting .
JVM monitor
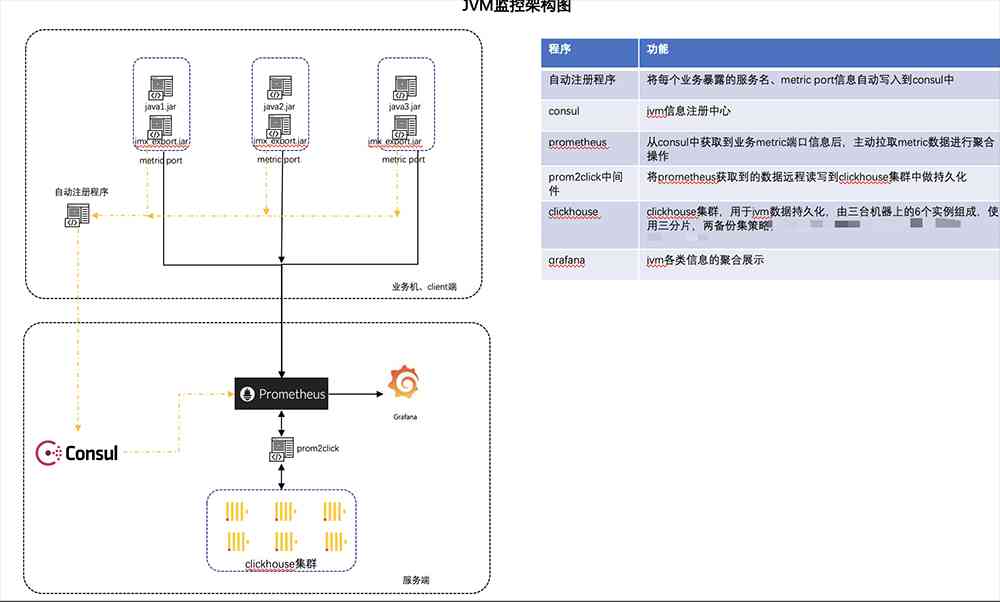
Briefly introduce the architecture in the figure : Now because of the popularity of microservices , There are many services in the back end, and the new back-end services are very fast , stay prometheus.yml Configure services directly IP + JVM Port is not a wise choice . So we choose to use Consul To do the automatic registration service function and through the Python The script will deploy all services on that machine JVM The port address is sent to Consul,Prometheus from Consul Get services JVM Metrics Address to get the service JVM data . In the absence of Kubernetes The cluster before Prometheus Use Docker start-up , Remote storage uses ClickHouse But because of ClickHouse Connect Promehteus Need to use prom2click Do data conversion , One more component, one more maintenance cost, and this component is not fully functional , So in Kubernetes In the cluster Prometheus Remote storage has been changed to InfluxDB.JMX Exporter It's also easy to start the injection service , Here, just put JMX Exporter Of jar Packages and configuration files are placed in the program's start command and can be obtained by specifying the port JVM relevant Metric data . The service startup command is as follows :
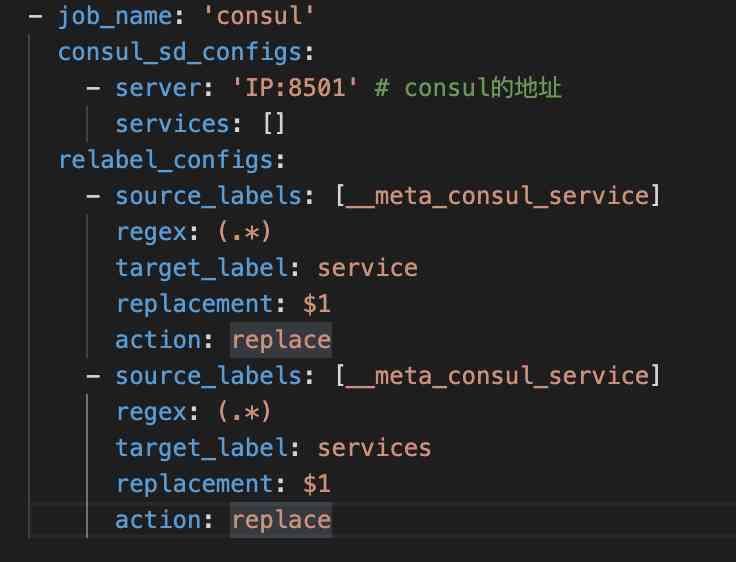
java -javaagent:/data/jmx_prometheus_javaagent-0.11.0.jar=57034:/data/jmx_exporter/jmx_exporter.yml -jar -DLOG_DIR=/ Log path / service name / -Xmx512m -Xms256m service name .jarPrometheus Middle configuration Consul Here's the picture 11, When Prometheus Collect business JVM Metrics After the data, it can be in Grafana Do aggregation exhibition in 、 Alarm and other functions .
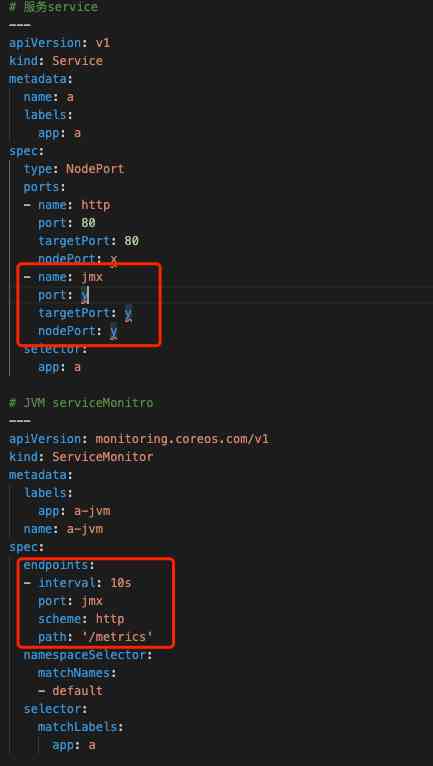
When services migrate to Kubernetes In the cluster , We changed JMX Exporter How to deploy JMX Exporter adopt initContainer Way to share jar Package and configure to the business container , convenient jmx_exporter jar Package upgrades and configuration changes . The configuration is not shown here YAML, and JVM We abandoned the collection with Consul Do automatic registration method and use ServiceMonitor coordination Service To get JVM Metrics data , To configure YAML Here's the picture 12,Grafana It is shown in the figure below 13.
stay Kubernetes Of us JVM There are also some problems with monitoring , For example, we used to deploy programs directly on the business machine , host IP Fixed , When JVM After hanging up, the program will restart automatically , We can do it in Grafana I saw the moment the program hung up JVM state , And the business image on a machine is continuous , And in a cluster, because of Pod IP and Pod The names are changing, which leads to a service Pod After hanging up , stay Grafana Search for previously extinct Pod More trouble , And the graph is not continuous on the timeline . I thought about using StatfulSet Pattern to fix the name , In the end, I thought it was against the stateless principle, so I didn't adopt it , The problem remains to be solved .
Q&A
Q: How to do business monitoring alarm , If the response time of an interface increases , Or call more frequently ?A: Our practice is that the program itself records the interface response time , Exposed as Metric The data is then passed through Prometheus collect , Configure the corresponding rule The rules , When the response time exceeds the set value, the alarm message will be sent to Alertmanager And send it to the operation and maintenance personnel .
Q:kube-state It's easy when the cluster is large OOM, How to solve ?A: We have very few cluster nodes , So far, I haven't come across kube-state-metric OOM The problem of , Since your cluster is large , because kube-state There's a lot of data collected , It's always right to give more memory .
Q: Internal application http How the call is called ? Use it directly service domain name ? There's still an intranet ingress controller? Or something else ?A: We're going to use Eureka To do service registration and discovery , But I would rather the company could use Kubernetes Of servic,Eureka There is a lost call problem .
Q:Kubernetes Do you have any suggestions on how to build a multi tenant log system model ?A: Your multi tenant is differentiated nanespace Words , You can think about namespace Add to the log path or kafka topic in , So we can distinguish .
Q: Have you considered monitoring cross cluster , Cross machine room data aggregation problem ?A: We used it before Prometheus Federal Way , But because we do business across countries There are many restrictions on the Internet , I gave up this method . If your business is in China or a cloud service provider or network conditions allow , We can do something about it .
版权声明
本文为[osc_0hs26yvj]所创,转载请带上原文链接,感谢
边栏推荐
- SHOW PROFILE分析SQL语句性能开销
- 十五年后,重构一个“在线的腾讯”
- Wealth and freedom? Ant financial services suspended listing, valuation or decline after regulation
- JT-day09
- 1486. Array XOR operation
- Gather in Beijing! Openi / O 2020 Qizhi Developer Conference enters countdown
- Method of creating flat panel simulator by Android studio
- 实现商品CRUD操作
- 050_ object-oriented
- Safety (miscellany)
猜你喜欢

基于synchronized锁的深度解析
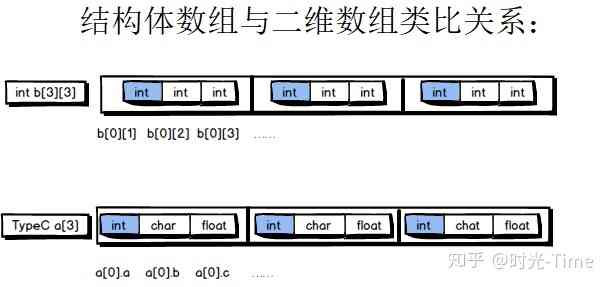
Understanding data structures starts with this article~
Implement crud operation

嘉宾专访|2020 PostgreSQL亚洲大会阿里云数据库专场:樊文凯
SQL语句实现水仙花数求取
![[QT] subclass qthread to realize multithreading](/img/95/085ef9ecf3478a8c6bad4f75716dd8.jpg)
[QT] subclass qthread to realize multithreading
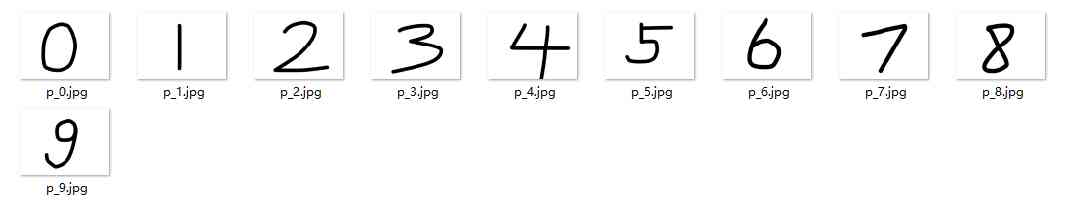
Handwritten digital image recognition convolution neural network
1450. Number of students doing homework at a given time
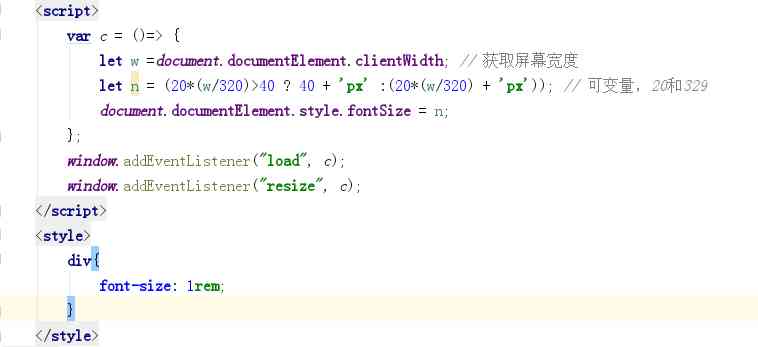
使用rem,做到屏幕缩放时,字体大小随之改变

块级元素和行内元素
随机推荐
AI应届生年薪涨到40万了,你现在转行还来得及!
Elasticsearch原理解析与性能调优
Commodity management system -- implementation of local preservation of new commodities
Understanding data structures starts with this article~
SQL语句实现水仙花数求取
开源 | HMGNN:异构小图神经网络及其在拉新裂变风控场景的应用
An attempt to read or write to protected memory occurred using the CopyMemory API. This usually indicates that other memory is corrupted.
Understanding runloop in OC
For and for... In, for each and map and for of
日志分析工具 - GoAccess
十五年后,重构一个“在线的腾讯”
零基础IM开发入门(四):什么是IM系统的消息时序一致性?
Front end code style practice prettier + eslint + git hook + lint staged
Review of hot spots of last week (11.2-11.8)
JT-day09
理解 OC 中 RunLoop
寻找性能更优秀的动态 Getter 和 Setter 方案
Jsliang job series - 08 - handwritten promise
捕获冒泡?难道浏览器是鱼吗?
典型分布式系统分析:Dynamo