当前位置:网站首页>Mysql26 use of performance analysis tools
Mysql26 use of performance analysis tools
2022-07-06 10:34:00 【Protect our party a Yao】
One . Database server optimization steps
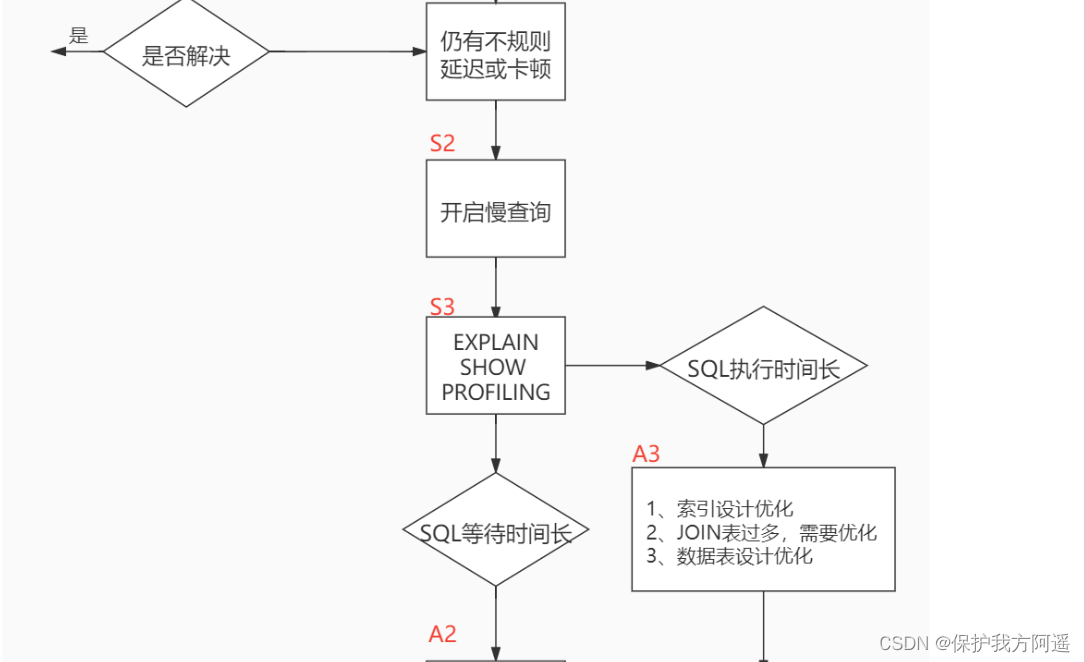
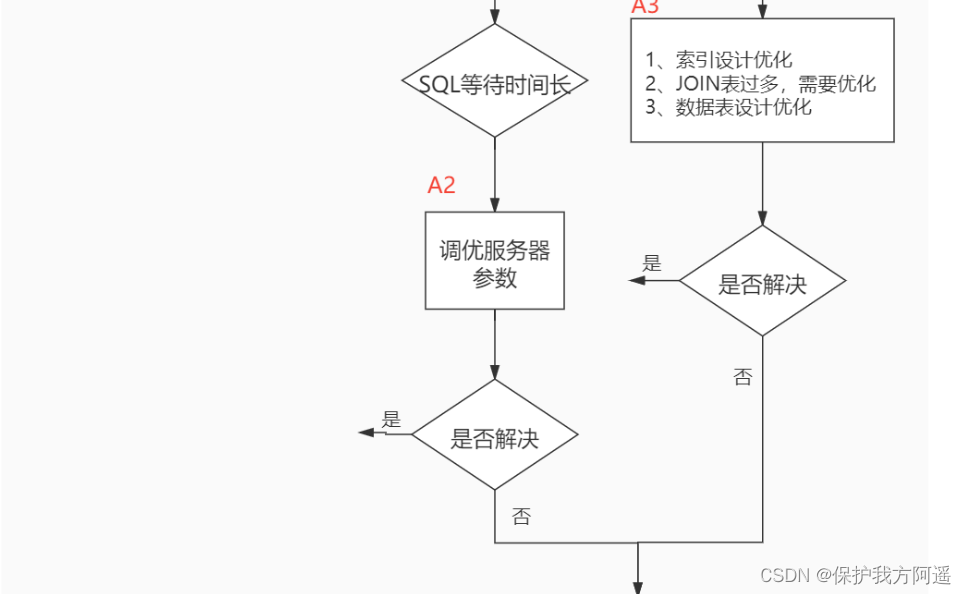
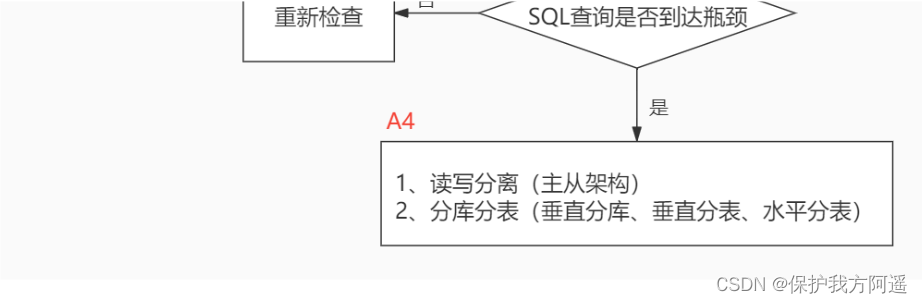
When we encounter database tuning problems , How to think ? Here, the thinking process is organized into the following figure .
The whole process is divided into Observe (Show status) and action (Action) Two parts . Letter S Part of represents observation ( Will use the corresponding analysis tools ), Letter A The representative part is action ( Actions that can be taken by correspondence analysis ).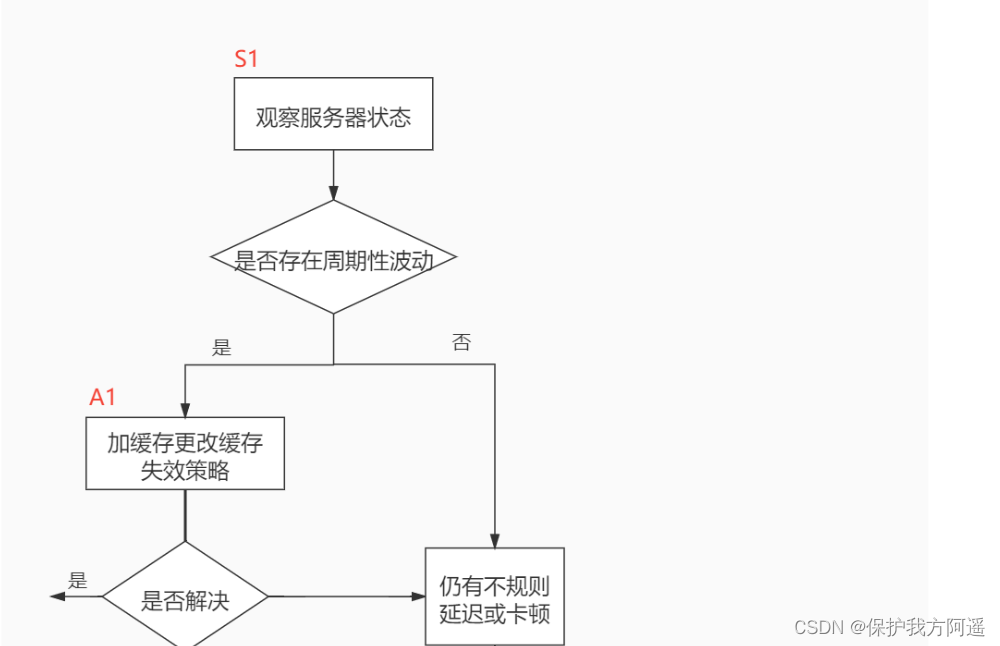
Summary :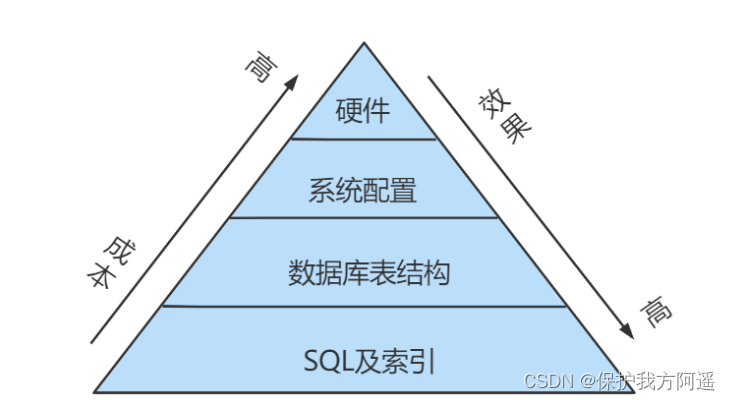
Two . View system performance parameters
stay MySQL in , have access to SHOW STATUS Statement query some MySQL Database server's performance parameter 、 Frequency of execution .
SHOW STATUS The sentence syntax is as follows :
SHOW [GLOBAL|SESSION] STATUS LIKE ' Parameters ';
Some common performance parameters are as follows :
• Connections: Connect MySQL The number of servers .
• Uptime:MySQL The online time of the server .
• Slow_queries: The number of slow queries .
• Innodb_rows_read:Select The number of rows returned by the query .
• Innodb_rows_inserted: perform INSERT The number of rows inserted by the operation .
• Innodb_rows_updated: perform UPDATE Number of rows updated by operation .
• Innodb_rows_deleted: perform DELETE The number of rows deleted by the operation .
• Com_select: Number of query operations .
• Com_insert: The number of insert operations . For batch inserted INSERT operation , Only add up once .
• Com_update: The number of update operations .
• Com_delete: The number of delete operations .
3、 ... and . Statistics SQL The cost of searching :last_query_cost
Still used student_info Table as an example :
If we want to inquire id=900001 The record of , Then look at the query cost , We can search directly on the cluster index :
SELECT student_id, class_id, NAME, create_time FROM student_info
WHERE id = 900001;
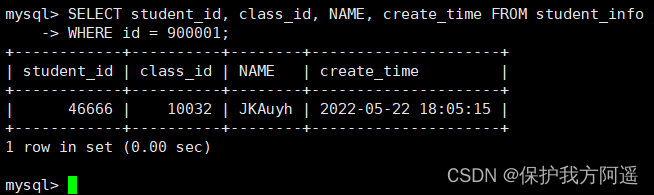
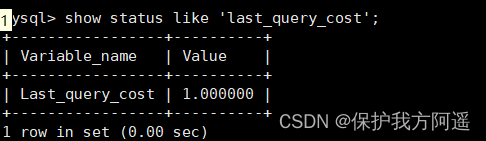
Then look at the cost of the query optimizer , In fact, we only need to retrieve one page :
SHOW STATUS LIKE 'last_query_cost';
If we want to inquire id stay 900001 To 9000100 Student records between ?
SELECT student_id, class_id, NAME, create_time FROM student_info
WHERE id BETWEEN 900001 AND 900100;
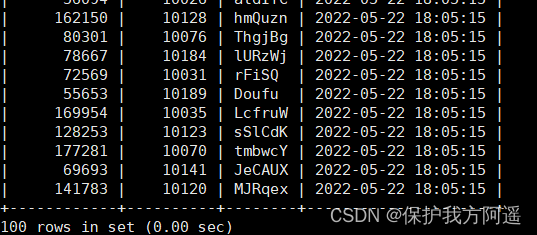
Then look at the cost of the query optimizer , At this time, we probably need to 20 A page query .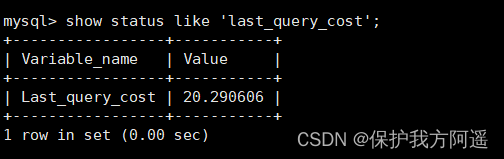
The number of pages you can see is just 20 times , However, the efficiency of query has not changed significantly , Actually these two SQL The query time is basically the same , It is because the sequential reading method is adopted to load the page into the buffer pool at one time , And then look it up . Although the number of pages (last_query_cost) A lot more , But through the mechanism of buffer pool , and Not adding much query time .
Use scenarios : It is very useful for comparing costs , Especially when we have several query methods to choose from .
Four . Location execution is slow SQL: Slow query log
4.1. Enable the slow query log parameter
4.1.1. Turn on slow_query_log
set global slow_query_log='ON';
Check whether the slow query log is enabled , And the location of slow query log files :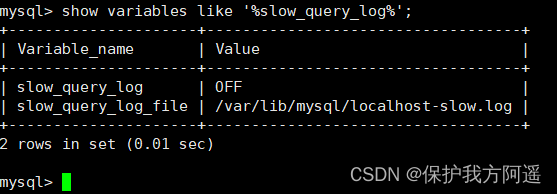
You can see that the slow query analysis has been started , At the same time, the file is saved in /var/lib/mysql/localhost-slow.log In file .
4.1.2. modify long_query_time threshold
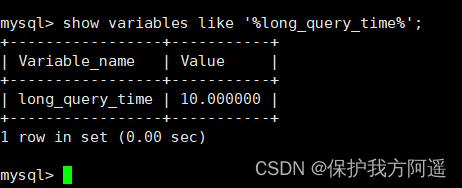
Next, let's look at the time threshold setting of slow query , Use the following command :
show variables like '%long_query_time%';
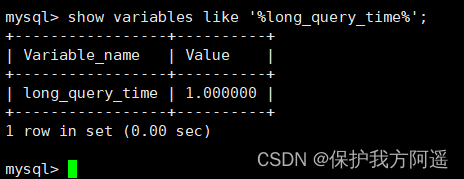
Here, if we want to shorten the time , For example, set to 1 second , You can set it like this :
 Tests found : Set up global The way to the current session Of long_query_time invalid . Valid for newly connected clients .
set global long_query_time = 1;
show global variables like '%long_query_time%';

set long_query_time=1;
show variables like '%long_query_time%'
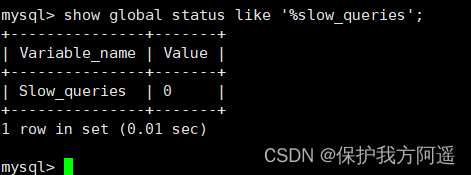
4.2. View the number of slow queries
Query how many slow query records are in the current system
SHOW GLOBAL STATUS LIKE '%Slow_queries%';
4.3. Case presentation
4.3.1. Build table
CREATE TABLE `student` (
`id` INT(11) NOT NULL AUTO_INCREMENT,
`stuno` INT NOT NULL ,
`name` VARCHAR(20) DEFAULT NULL,
`age` INT(3) DEFAULT NULL,
`classId` INT(11) DEFAULT NULL,
PRIMARY KEY (`id`)
) ENGINE=INNODB AUTO_INCREMENT=1 DEFAULT CHARSET=utf8;
4.3.2. Set parameters log_bin_trust_function_creators
Create a function , If it's wrong :
This function has none of DETERMINISTIC......
Command on : Allows you to create function settings :
set global log_bin_trust_function_creators=1; # No addition global Only the current window is valid .
4.3.3. Create a function
Randomly generate strings :
DELIMITER //
CREATE FUNCTION rand_string(n INT)
RETURNS VARCHAR(255) # This function returns a string
BEGIN
DECLARE chars_str VARCHAR(100) DEFAULT
'abcdefghijklmnopqrstuvwxyzABCDEFJHIJKLMNOPQRSTUVWXYZ';
DECLARE return_str VARCHAR(255) DEFAULT '';
DECLARE i INT DEFAULT 0;
WHILE i < n DO
SET return_str =CONCAT(return_str,SUBSTRING(chars_str,FLOOR(1+RAND()*52),1));
SET i = i + 1;
END WHILE;
RETURN return_str;
END //
DELIMITER ;

# test
SELECT rand_string(10);
Random values are generated :
DELIMITER //
CREATE FUNCTION rand_num (from_num INT ,to_num INT) RETURNS INT(11)
BEGIN
DECLARE i INT DEFAULT 0;
SET i = FLOOR(from_num +RAND()*(to_num - from_num+1)) ;
RETURN i;
END //
DELIMITER ;
# test :
SELECT rand_num(10,100);
4.3.4. Create stored procedure
DELIMITER //
CREATE PROCEDURE insert_stu1( START INT , max_num INT )
BEGIN
DECLARE i INT DEFAULT 0;
SET autocommit = 0; # Set up manual commit transactions
REPEAT # loop
SET i = i + 1; # assignment
INSERT INTO student (stuno, NAME ,age ,classId ) VALUES
((START+i),rand_string(6),rand_num(10,100),rand_num(10,1000));
UNTIL i = max_num
END REPEAT;
COMMIT; # Commit transaction
END //
DELIMITER ;
4.3.5. Calling stored procedure
# Call the function just written , 4000000 Bar record , from 100001 The start
CALL insert_stu1(100001,4000000);
4.4. Testing and analysis
4.4.1. test
SELECT * FROM student WHERE stuno = 3455655;
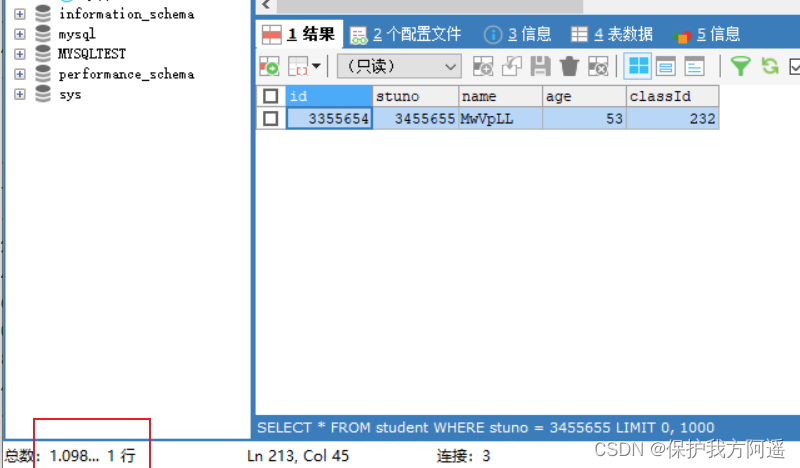
SELECT * FROM student WHERE name = 'oQmLUr';
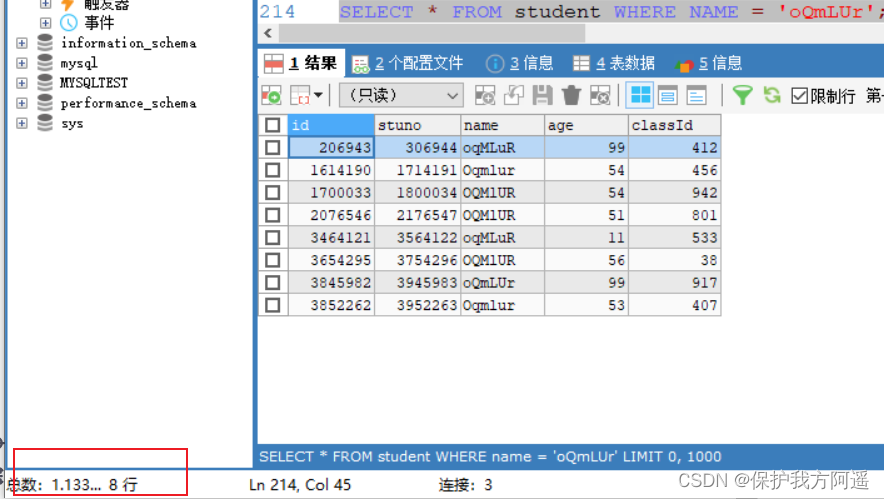
It can be seen from the results above , The inquiry student number is “3455655” The time spent on student information is 1.09 second . The student's name is “oQmLUr” The time spent on student information is 1.13 second . It has reached the order of seconds , It shows that the current query efficiency is relatively low , Now let's analyze the reasons .
4.4.2. analysis
show status like 'slow_queries';
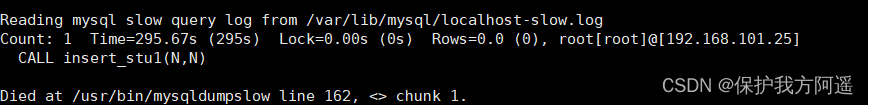
4.5. Slow query log analysis tool :mysqldumpslow
In the production environment , If you want to analyze the log manually , lookup 、 analysis SQL, It's obviously individual work ,MySQL Provides log analysis tools mysqldumpslow .
see mysqldumpslow Help for
mysqldumpslow --help
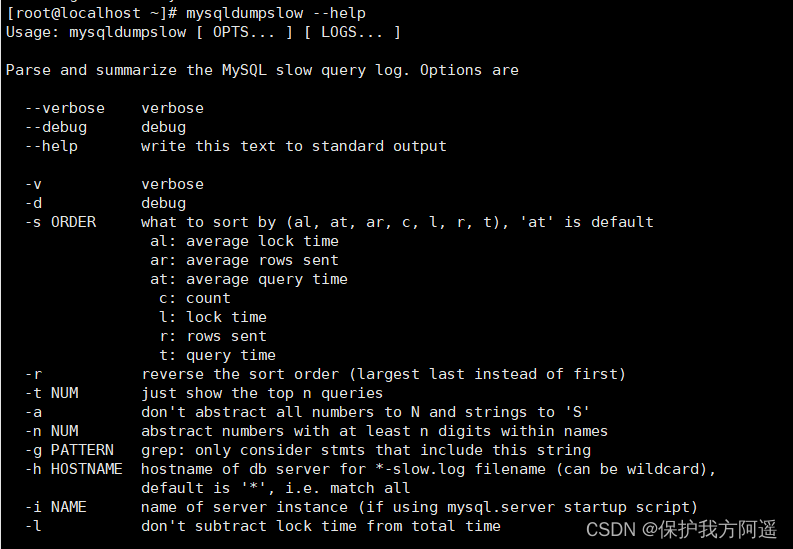 mysqldumpslow The specific parameters of the command are as follows :
- -a: Do not abstract numbers into N, The string is abstracted into S
- -s: Is to show how to sort :
c: Number of visits
l: Lock time
r: Back to the record
t: Query time
al: Average lock time
ar: Average number of returned records
at: Average query time ( Default mode )
ac: Average number of queries - -t: That is, how many pieces of data are returned ;
- -g: With a regular match pattern at the back , Case insensitive ;
give an example : We want to sort by query time , Check the first five SQL sentence , Write it like this :
mysqldumpslow -s t -t 5 /var/lib/mysql/localhost-slow.log
Common references for work :
# Get the most returned recordset 10 individual SQL
mysqldumpslow -s r -t 10 /var/lib/mysql/localhost-slow.log
# The most visited 10 individual SQL
mysqldumpslow -s c -t 10 /var/lib/mysql/localhost-slow.log
# Get the top... In chronological order 10 There are left connected query statements in the bar
mysqldumpslow -s t -t 10 -g "left join" /var/lib/mysql/localhost-slow.log
# It is also recommended to use these commands in conjunction with  |  and more  Use  , Otherwise, the screen may explode
mysqldumpslow -s r -t 10 /var/lib/mysql/localhost-slow.log | more
4.6. Turn off slow query log
MySQL There are two ways for the server to stop the slow query log function :
 The way 1: Permanent way
[mysqld]
slow_query_log=OFF
 perhaps , hold slow_query_log Comment out one item   or   Delete
[mysqld]
#slow_query_log =OFF
 restart MySQL service , Execute the following statement to query the slow log function .
HOW VARIABLES LIKE '%slow%'; # Query the directory where the slow query log is located
SHOW VARIABLES LIKE '%long_query_time%'; # Query timeout
 The way 2: Temporary way
 Use SET Statement . (1) stop it MySQL Slow query log function , Specifically SQL The statement is as follows .
SET GLOBAL slow_query_log=off
 restart MySQL service , Use SHOW Statement query slow query log function information , Specifically SQL The statement is as follows
SHOW VARIABLES LIKE '%slow%';
# as well as
SHOW VARIABLES LIKE '%long_query_time%'
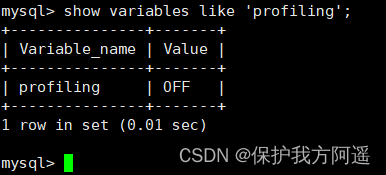
5、 ... and . see SQL Execution cost :SHOW PROFILE
show variables like 'profiling';
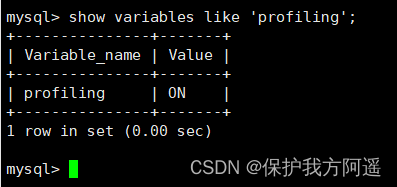
 By setting profiling='ON’ To open show profile:
set profiling = 'ON';
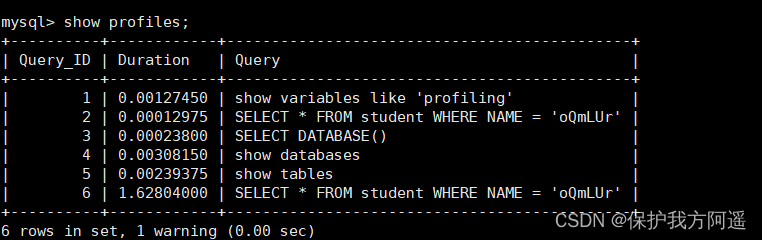
Then execute the relevant query statement . Next, let's look at the current conversation profiles, Use this command :
show profiles;
show profile cpu,block io for query 6;
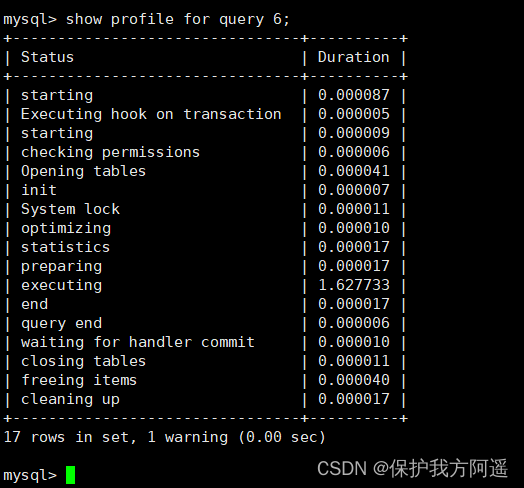 show profile Common query parameters of :
① ALL: Show all overhead information .
② BLOCK IO: Display block IO expenses .
③ CONTEXT SWITCHES: Context switching overhead .
④ CPU: Show CPU Overhead information .
⑤ IPC: Show send and receive overhead information .
⑥ MEMORY: Display memory overhead information .
⑦ PAGE FAULTS: Display page error overhead information .
⑧ SOURCE: Display and Source_function,Source_file,Source_line Related expense information . ⑨ SWAPS: Shows the number of exchanges overhead information .
6、 ... and . Analyze query statements :EXPLAIN
6.1. summary
https://dev.mysql.com/doc/refman/5.7/en/explain-output.html
https://dev.mysql.com/doc/refman/8.0/en/explain-output.html
Version :
- MySQL 5.6.3 Before, I could only EXPLAIN SELECT ;MYSQL 5.6.3 In the future EXPLAIN SELECT,UPDATE,DELETE
- stay 5.7 In previous versions , Want to show partitions Need to use explain partitions command ; Want to show pfiltered Need to use explain extended command . stay 5.7 After version , Default explain Direct display partitions and filtered Information in .
6.2. Basic grammar
EXPLAIN or DESCRIBE The syntax of the statement is as follows :
EXPLAIN SELECT select_options
 perhaps
DESCRIBE SELECT select_options
If we want to see the execution plan of a query , You can add a... Before the specific query statement EXPLAIN , Just like this. :
EXPLAIN SELECT 1;
 EXPLAIN The functions of each column output by the statement are as follows :
| Name | describe |
|---|---|
| id | In a large query statement, each SELECT Each keyword corresponds to a Unique id |
| select_type | SELECT The type of query corresponding to the keyword |
| table | Table name |
| partitions | Matching partition information |
| type | Access methods for single tables |
| possible_keys | Possible indexes |
| key | Index actually used |
| key_len | The actual index length used |
| ref | When using index column equivalent queries , Information about the object matching the index column |
| rows | Estimated number of records to read |
| filtered | The percentage of records remaining after a table is filtered by search criteria |
| Extra | Some extra information |
6.3. Data preparation
6.3.1. Build table
CREATE TABLE s1 (
id INT AUTO_INCREMENT,
key1 VARCHAR(100),
key2 INT,
key3 VARCHAR(100),
key_part1 VARCHAR(100),
key_part2 VARCHAR(100),
key_part3 VARCHAR(100),
common_field VARCHAR(100),
PRIMARY KEY (id),
INDEX idx_key1 (key1),
UNIQUE INDEX idx_key2 (key2),
INDEX idx_key3 (key3),
INDEX idx_key_part(key_part1, key_part2, key_part3)
) ENGINE=INNODB CHARSET=utf8;
CREATE TABLE s2 (
id INT AUTO_INCREMENT,
key1 VARCHAR(100),
key2 INT,
key3 VARCHAR(100),
key_part1 VARCHAR(100),
key_part2 VARCHAR(100),
key_part3 VARCHAR(100),
common_field VARCHAR(100),
PRIMARY KEY (id),
INDEX idx_key1 (key1),
UNIQUE INDEX idx_key2 (key2),
INDEX idx_key3 (key3),
INDEX idx_key_part(key_part1, key_part2, key_part3)
) ENGINE=INNODB CHARSET=utf8;
6.3.2. Set parameters log_bin_trust_function_creators
Create a function , If it's wrong , You need to start the following command : Allows you to create function settings :
set global log_bin_trust_function_creators=1; # No addition global Only the current window is valid .
6.3.3. Create a function
DELIMITER //
CREATE FUNCTION rand_string1(n INT)
RETURNS VARCHAR(255) # This function returns a string
BEGIN
DECLARE chars_str VARCHAR(100) DEFAULT
'abcdefghijklmnopqrstuvwxyzABCDEFJHIJKLMNOPQRSTUVWXYZ';
DECLARE return_str VARCHAR(255) DEFAULT '';
DECLARE i INT DEFAULT 0;
WHILE i < n DO
SET return_str =CONCAT(return_str,SUBSTRING(chars_str,FLOOR(1+RAND()*52),1));
SET i = i + 1;
END WHILE;
RETURN return_str;
END //
DELIMITER ;
6.3.4. Create stored procedure
DELIMITER //
CREATE PROCEDURE insert_s1 (IN min_num INT (10),IN max_num INT (10))
BEGIN
DECLARE i INT DEFAULT 0;
SET autocommit = 0;
REPEAT
SET i = i + 1;
INSERT INTO s1 VALUES(
(min_num + i),
rand_string1(6),
(min_num + 30 * i + 5),
rand_string1(6),
rand_string1(10),
rand_string1(5),
rand_string1(10),
rand_string1(10));
UNTIL i = max_num
END REPEAT;
COMMIT;
END //
DELIMITER ;
To create s2 A stored procedure that inserts data into a table :
DELIMITER //
CREATE PROCEDURE insert_s2 (IN min_num INT (10),IN max_num INT (10))
BEGIN
DECLARE i INT DEFAULT 0;
SET autocommit = 0;
REPEAT
SET i = i + 1;
INSERT INTO s2 VALUES(
(min_num + i),
rand_string1(6),
(min_num + 30 * i + 5),
rand_string1(6),
rand_string1(10),
rand_string1(5),
rand_string1(10),
rand_string1(10));
UNTIL i = max_num
END REPEAT;
COMMIT;
END //
DELIMITER ;
6.3.5. Calling stored procedure
s1 Addition of table data : Join in 1 Ten thousand records :
CALL insert_s1(10001,10000);
s2 Addition of table data : Join in 1 Ten thousand records :
CALL insert_s2(10001,10000);
6.4. EXPLAIN Action of each column
In order to let everyone have a better experience , We adjusted EXPLAIN Order of output columns .
6.4.1. table
No matter how complex our query statement is , inside How many tables are included , In the end, each table needs to be Single table access Of , therefore MySQL Regulations EXPLAIN Each record output by the statement corresponds to the access method of a single table , Of this record table The column represents the table name of the table ( Sometimes it's not a real name , It may be abbreviated as ).
EXPLAIN SELECT id FROM s1;
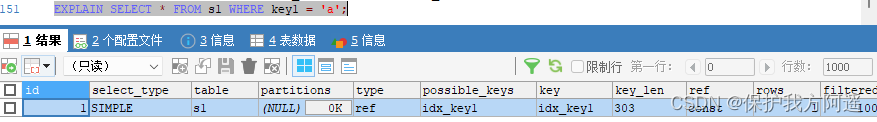
6.4.2. id
The query statements we write are generally based on SELECT Keyword start , There is only one simple query statement SELECT keyword , For example, the following query statement :
SELECT * FROM s1 WHERE key1 = 'a';
There is only one in a slightly more complex join query SELECT keyword , such as :
SELECT * FROM s1 INNER JOIN s2
ON s1.key1 = s2.key1
WHERE s1.common_field = 'a';
EXPLAIN SELECT * FROM s1 WHERE key1 = 'a';
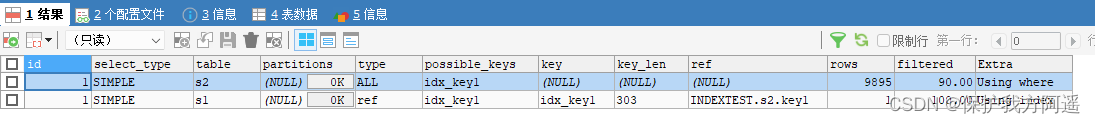
explain SELECT * FROM s1 INNER JOIN s2
ON s1.key1 = s2.key1
WHERE s1.common_field = 'a';
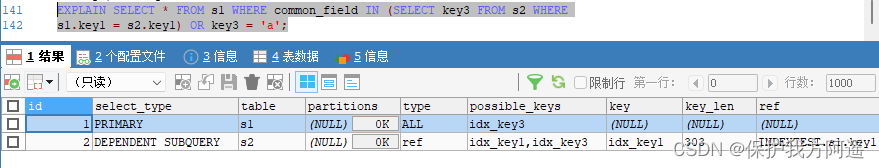
EXPLAIN SELECT * FROM s1 WHERE key1 IN (SELECT key1 FROM s2) OR key3 = 'a';
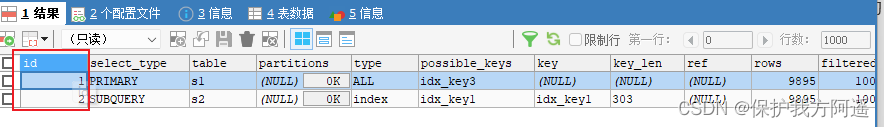
EXPLAIN SELECT * FROM s1 WHERE key1 IN (SELECT key2 FROM s2 WHERE common_field
= 'a');
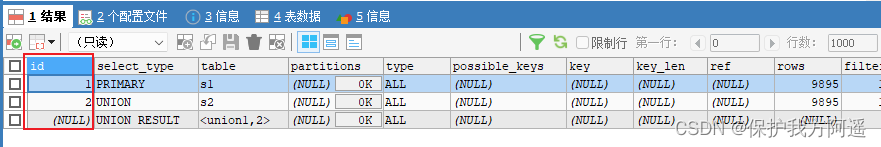
EXPLAIN SELECT * FROM s1 UNION SELECT * FROM s2;
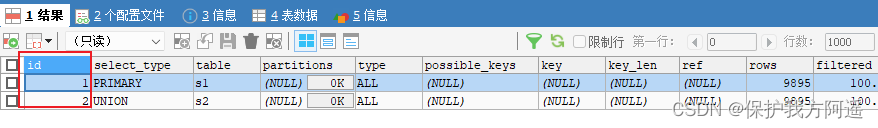
EXPLAIN SELECT * FROM s1 UNION ALL SELECT * FROM s2;
 Summary :
- id If the same , It can be thought of as a group , From top to bottom .
- In all groups ,id The bigger the value is. , The higher the priority , Execute first .
- concerns :id Number, each number , Represents an independent query , One sql The fewer query times, the better .
6.4.3. select_type
| name | describe |
|---|---|
| SIMPLE | Simple SELECT (not using UNION or subqueries) |
| PRIMARY | Outermost SELECT |
| UNION | Second or later SELECT statement in a UNION |
| UNION RESULT | Result of a UNION |
| SUBQUERY | First SELECT in subquery |
| DEPENDENT SUBQUERY | First SELECT in subquery, dependent on outer query |
| DEPENDENT UNION | Second or later SELECT statement in a UNION, dependent on outer query |
| DERIVED | Derived table |
| MATERIALIZED | Materialized subquery |
| UNCACHEABLE SUBQUERY | A subquery for which the result cannot be cached and must be re-evaluated for each row of the outer query |
| UNCACHEABLE UNION | The second or later select in a UNION that belongs to an uncacheable subquery(see UNCACHEABLE SUBQUERY) |
The specific analysis is as follows :
EXPLAIN SELECT * FROM s1;
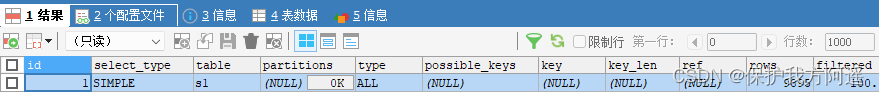
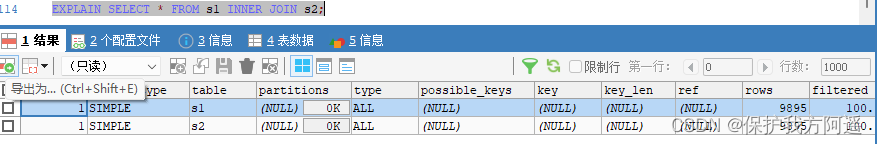
Of course , Join query is also SIMPLE type , such as :
EXPLAIN SELECT * FROM s1 INNER JOIN s2;
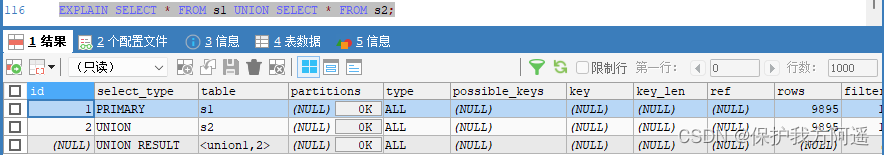
EXPLAIN SELECT * FROM s1 UNION SELECT * FROM s2;
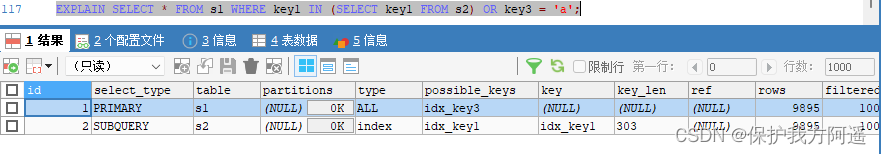
EXPLAIN SELECT * FROM s1 WHERE key1 IN (SELECT key1 FROM s2) OR key3 = 'a';
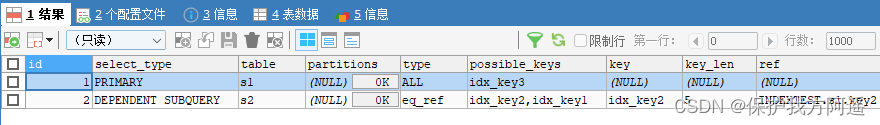
EXPLAIN SELECT * FROM s1 WHERE key1 IN (SELECT key1 FROM s2 WHERE s1.key2 =s2.key2) OR key3 = 'a';
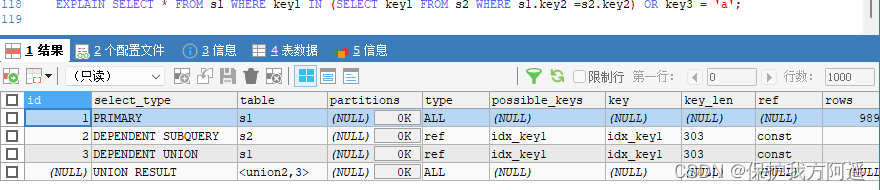
EXPLAIN SELECT * FROM s1 WHERE key1 IN (SELECT key1 FROM s2 WHERE key1 =
'a' UNION SELECT key1 FROM s1 WHERE key1 = 'b');
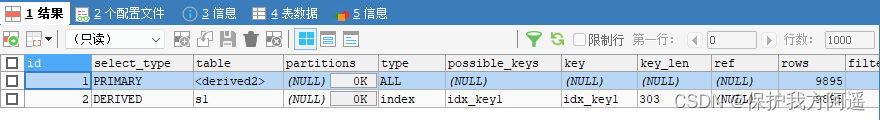
EXPLAIN SELECT * FROM (SELECT key1, count(*) as c FROM s1 GROUP BY key1) AS
derived_s1 where c > 1;
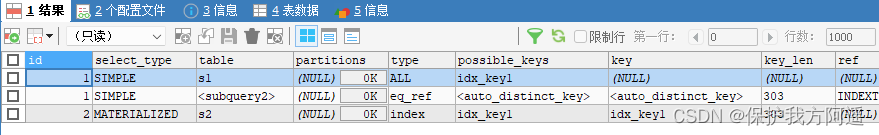
EXPLAIN SELECT * FROM s1 WHERE key1 IN (SELECT key1 FROM s2);
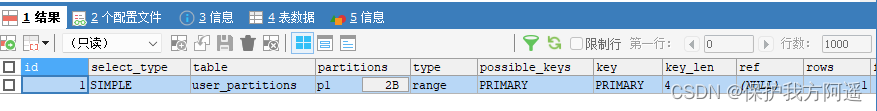
6.4.4. partitions
Create a partition table :
--  Create a partition table ,
--  according to id Partition ,id<100 p0 Partition , other p1 Partition
CREATE TABLE user_partitions (id INT auto_increment,
NAME VARCHAR(12),PRIMARY KEY(id))
PARTITION BY RANGE(id)(
PARTITION p0 VALUES less than(100),
PARTITION p1 VALUES less than MAXVALUE
);
DESC SELECT * FROM user_partitions WHERE id>200;
6.4.5. type
The complete access method is as follows : system , const , eq_ref , ref , fulltext , ref_or_null ,index_merge , unique_subquery , index_subquery , range , index , ALL .
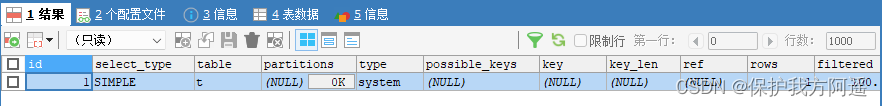
- system
 CREATE TABLE t(i int) Engine=MyISAM;
 INSERT INTO t VALUES(1);
 EXPLAIN SELECT * FROM t;
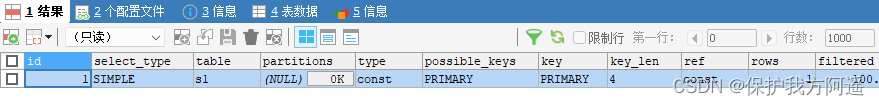
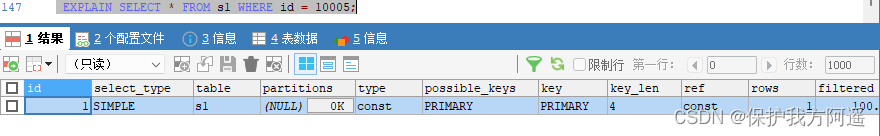
- const
EXPLAIN SELECT * FROM s1 WHERE id = 10005;
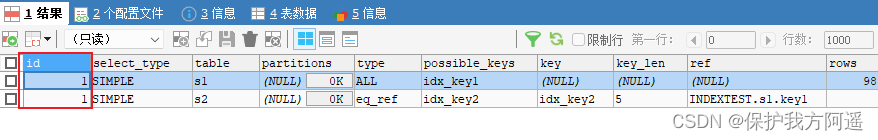
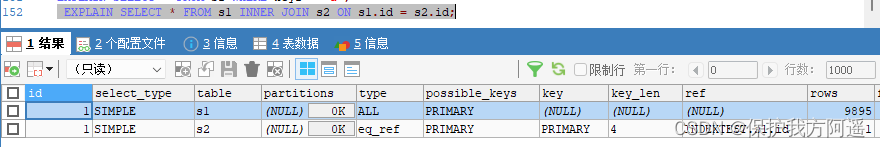
- eq_ref
EXPLAIN SELECT * FROM s1 INNER JOIN s2 ON s1.id = s2.id;
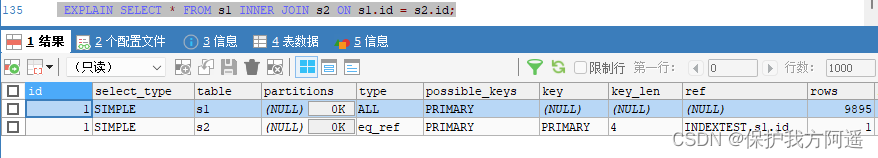 As can be seen from the results of the implementation plan ,MySQL Intend to s2 As a driving table ,s1 As a driven table , Focus on s1 Your access method is eq_ref , Indicates that you are visiting s1 When you watch, you can Through the equivalence matching of the primary key To visit .
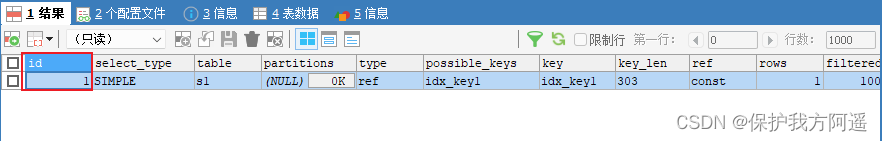
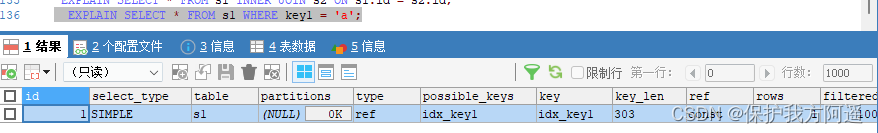
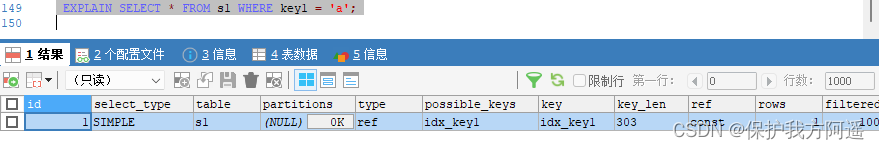
- ref
EXPLAIN SELECT * FROM s1 WHERE key1 = 'a';
- fulltext
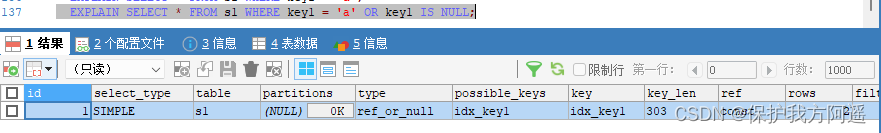
Full-text index - ref_or_null
EXPLAIN SELECT * FROM s1 WHERE key1 = 'a' OR key1 IS NULL;
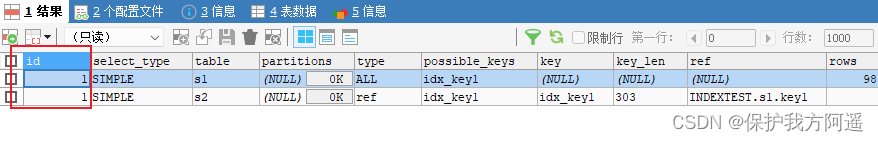
- index_merge
EXPLAIN SELECT * FROM s1 WHERE key1 = 'a' OR key3 = 'a';
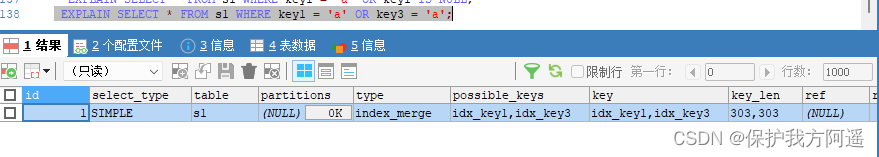 From the implementation of the plan type Is the value of the column index_merge We can see that ,MySQL I plan to use index merging to execute
Yes s1 Table in the query .
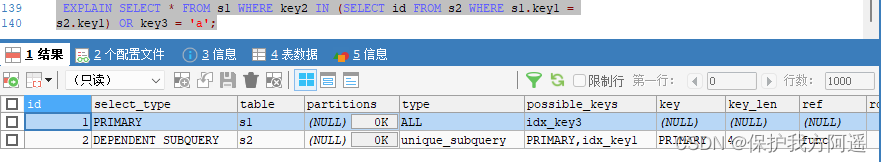
- unique_subquery
EXPLAIN SELECT * FROM s1 WHERE key2 IN (SELECT id FROM s2 where s1.key1 =
s2.key1) OR key3 = 'a';
- index_subquery
EXPLAIN SELECT * FROM s1 WHERE common_field IN (SELECT key3 FROM s2 where
s1.key1 = s2.key1) OR key3 = 'a';
- range
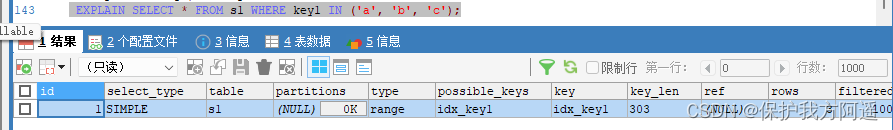
EXPLAIN SELECT * FROM s1 WHERE key1 IN ('a', 'b', 'c');
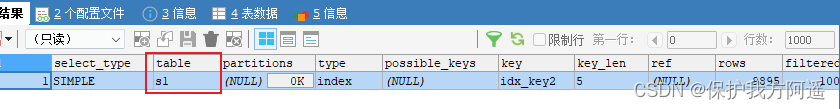
- index
EXPLAIN SELECT key_part2 FROM s1 WHERE key_part3 = 'a';

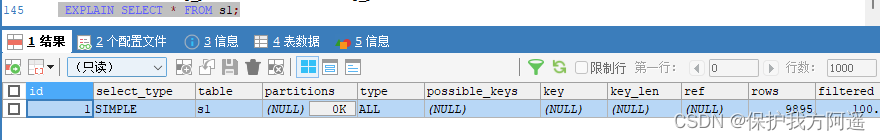
- ALL
EXPLAIN SELECT * FROM s1;
The result value from the best to the worst is : system > const > eq_ref > ref > fulltext > ref_or_null > index_merge >
unique_subquery > index_subquery > range > index > ALL Some of the more important ones are extracted ( See blue in the picture above ).SQL Objectives of performance optimization : At the very least range Level , The requirement is ref Level , It is best to consts Level .( Alibaba development manual requirements )
6.4.6. possible_keys and key
6.4.7. key_len
EXPLAIN SELECT * FROM s1 WHERE id = 10005;
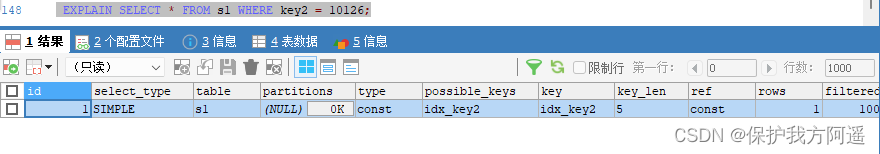
EXPLAIN SELECT * FROM s1 WHERE key2 = 10126;
EXPLAIN SELECT * FROM s1 WHERE key1 = 'a';
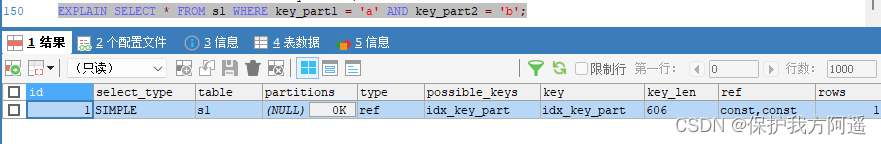
EXPLAIN SELECT * FROM s1 WHERE key_part1 = 'a' AND key_part2 = 'b';
key_len The length formula of :
varchar(10) Variable length field and allow NULL = 10 * ( character set:utf8=3,gbk=2,latin1=1)+1(NULL)+2( Variable length field )
varchar(10) Variable length field and not allowed NULL = 10 * ( character set:utf8=3,gbk=2,latin1=1)+2( Variable length field )
char(10) Fixed field and allow NULL = 10 * ( character set:utf8=3,gbk=2,latin1=1)+1(NULL)
char(10) Fixed field and not allowed NULL = 10 * ( character set:utf8=3,gbk=2,latin1=1)
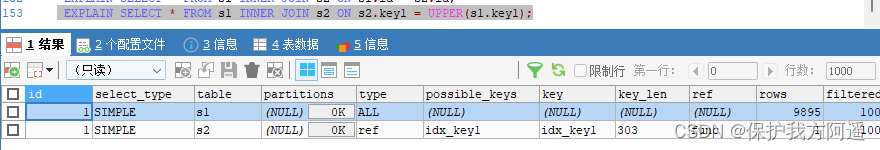
6.4.8. ref
EXPLAIN SELECT * FROM s1 WHERE key1 = 'a';
EXPLAIN SELECT * FROM s1 INNER JOIN s2 ON s1.id = s2.id;
EXPLAIN SELECT * FROM s1 INNER JOIN s2 ON s2.key1 = UPPER(s1.key1);
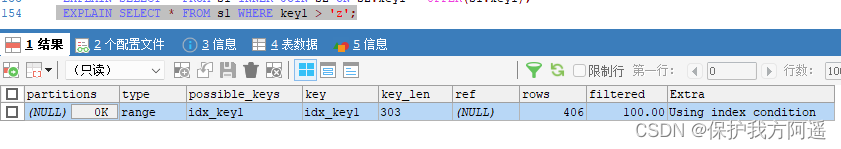
6.4.9. rows
EXPLAIN SELECT * FROM s1 WHERE key1 > 'z';
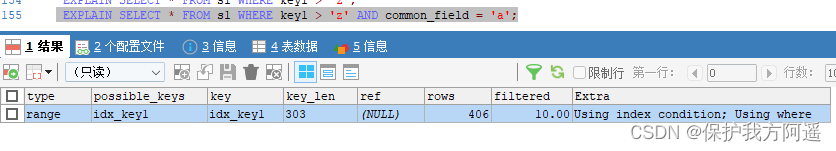
6.4.10. filtered
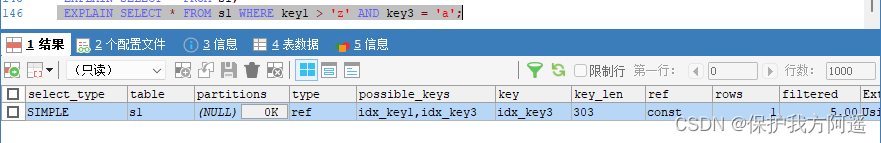
EXPLAIN SELECT * FROM s1 WHERE key1 > 'z' AND common_field = 'a';
6.4.5. Summary
- EXPLAIN Don't think about all kinds of Cache.
- EXPLAIN Can't show MySQL Optimizations done when executing queries .
- EXPLAIN I won't tell you about triggers 、 The impact of stored procedure information or user-defined functions on queries .
- Some of the statistics are estimated , Not exactly .
7、 ... and . EXPLAIN Further use of
7.1. EXPLAIN Four output formats
EXPLAIN You can output four formats : Traditional format , JSON Format , TREE Format as well as Visual output . Users can choose their own format according to their needs .
7.2. Traditional format
The traditional format is simple and clear , The output is a tabular form , Outline query plan .
EXPLAIN SELECT s1.key1, s2.key1 FROM s1 LEFT JOIN s2 ON s1.key1 = s2.key1 WHERE
s2.common_field IS NOT NULL;
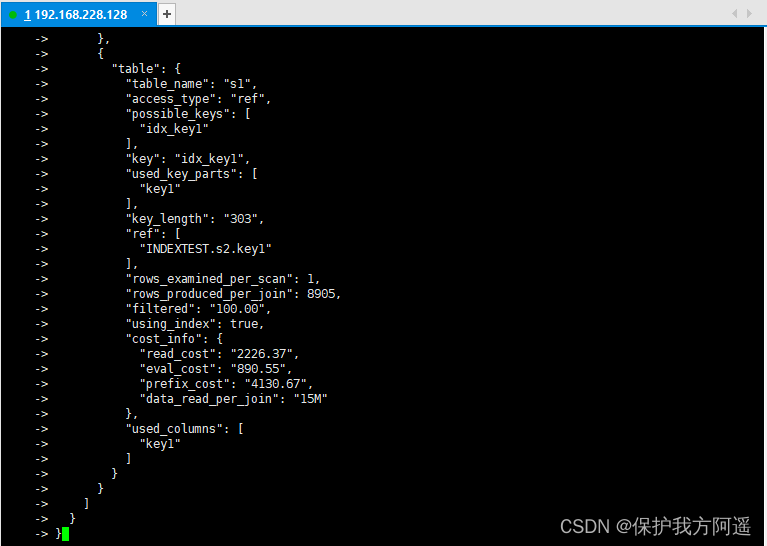
7.3. JSON Format
JSON Format : stay EXPLAIN Add... Between the word and the real query statement FORMAT=JSON .
EXPLAIN FORMAT=JSON SELECT ....
We use # The form followed by notes explains EXPLAIN FORMAT=JSON The output of the statement , But you may have questions “cost_info” The cost inside looks strange , How are they calculated ? First look at s1 Tabular “cost_info” Ministry
branch :
"cost_info": {
"read_cost": "1840.84",
"eval_cost": "193.76",
"prefix_cost": "2034.60",
"data_read_per_join": "1M"
}
read_cost It's made up of the two parts below :
- IO cost
- testing rows × (1 - filter) Bar record CPU cost
 Tips: : rows and filter All of them are the output columns of our previous introduction to the implementation plan , stay JSON Format of the implementation plan ,rows
 amount to rows_examined_per_scan,filtered The name does not change .
- eval_cost This is how it is calculated :
testing rows × filter Cost of records . - prefix_cost It's a separate query s1 Cost of tables , That is to say :read_cost + eval_cost
- data_read_per_join Represents the amount of data to be read in this query .
about s2 Tabular “cost_info” Part of it is like this :
"cost_info": {
"read_cost": "968.80",
"eval_cost": "193.76",
"prefix_cost": "3197.16",
"data_read_per_join": "1M"
}
because s2 A table is a driven table , So it can be read many times , there read_cost and eval_cost It's a visit many times s2 The cumulative value at the end of the table , We are mainly concerned about the prefix_cost The value of represents the estimated cost of the entire join query , It's a single query s1 Tables and multiple queries s2 The sum of the cost after the table , That is to say :
968.80 + 193.76 + 2034.60 = 3197.16
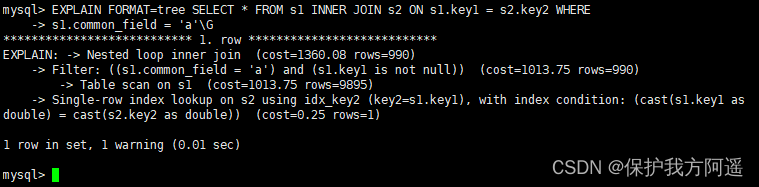
7.4. TREE Format
TREE The format is 8.0.16 New format introduced after version , Mainly based on the query The relationship between the parts and Execution sequence of each part To describe how to query .
EXPLAIN FORMAT=tree SELECT * FROM s1 INNER JOIN s2 ON s1.key1 = s2.key2 WHERE
s1.common_field = 'a'\G
7.5. Visual output
Visual output , Can pass MySQL Workbench Visual view MySQL Implementation plan of . By clicking on Workbench Magnifying glass icon , You can generate a visual query plan .
EXPLAIN SELECT s1.key1, s2.key1 FROM s1 LEFT JOIN s2 ON s1.key1 = s2.key1 WHERE
s2.common_field IS NOT NULL;
SHOW WARNINGS\G;
*************************** 1. row ***************************
Level: Note
Code: 1003
Message: /* select#1 */ select `atguigu`.`s1`.`key1` AS `key1`,`atguigu`.`s2`.`key1`
AS `key1` from `atguigu`.`s1` join `atguigu`.`s2` where ((`atguigu`.`s1`.`key1` =
`atguigu`.`s2`.`key1`) and (`atguigu`.`s2`.`common_field` is not null))
1 row in set (0.00 sec)
8、 ... and . Analyze optimizer execution plan :trace
SET optimizer_trace="enabled=on",end_markers_in_json=on;
set optimizer_trace_max_mem_size=1000000;
After opening , The following statements can be analyzed :
- SELECT
- INSERT
- REPLACE
- UPDATE
- DELETE
- EXPLAIN
- SET
- DECLARE
- CASE
- IF
- RETURN
- CALL
test : The implementation is as follows SQL sentence
select * from student where id < 10;
Last , Inquire about information_schema.optimizer_trace We can know MySQL How to execute SQL Of :
select * from information_schema.optimizer_trace\G
*************************** 1. row ***************************
					  // The first 1 part : Query statement
                            QUERY: select * from student where id < 10
                            // The first 2 part :QUERY The tracking information of the statement corresponding to the field
                            TRACE: {
  "steps": [
    {
      "join_preparation": {  // Preparatory work
        "select#": 1,
        "steps": [
          {
            "expanded_query": "/* select#1 */ select `student`.`id` AS `id`,`student`.`student_no` AS `student_no`,`student`.`student_name` AS `student_name` from `student` where (`student`.`id` < 10)"
          }
        ] /* steps */
      } /* join_preparation */
    },
    {
      "join_optimization": {// To optimize
        "select#": 1,
        "steps": [
          {
            "condition_processing": { // Conditional processing
              "condition": "WHERE",
              "original_condition": "(`student`.`id` < 10)",
              "steps": [
                {
                  "transformation": "equality_propagation",
                  "resulting_condition": "(`student`.`id` < 10)"
                },
                {
                  "transformation": "constant_propagation",
                  "resulting_condition": "(`student`.`id` < 10)"
                },
                {
                  "transformation": "trivial_condition_removal",
                  "resulting_condition": "(`student`.`id` < 10)"
                }
              ] /* steps */
            } /* condition_processing */
          },
          {
            "substitute_generated_columns": {  // Replace the generated column
            } /* substitute_generated_columns */
          },
          {
            "table_dependencies": [  // Table dependencies
              {
                "table": "`student`",
                "row_may_be_null": false,
                "map_bit": 0,
                "depends_on_map_bits": [
                ] /* depends_on_map_bits */
              }
            ] /* table_dependencies */
          },
          {
            "ref_optimizer_key_uses": [  // Use the key
            ] /* ref_optimizer_key_uses */
          },
          {
            "rows_estimation": [  // Line judgment
              {
                "table": "`student`",
                "range_analysis": {
                  "table_scan": {
                    "rows": 1,
                    "cost": 3.2
                  } /* table_scan */,  // Scan table
                  "potential_range_indexes": [  // Potential range index
                    {
                      "index": "PRIMARY",
                      "usable": true,
                      "key_parts": [
                        "id"
                      ] /* key_parts */
                    }
                  ] /* potential_range_indexes */,
                  "setup_range_conditions": [  // Set range conditions
                  ] /* setup_range_conditions */,
                  "group_index_range": {
                    "chosen": false,
                    "cause": "not_group_by_or_distinct"
                  } /* group_index_range */,
                  "skip_scan_range": {
                    "potential_skip_scan_indexes": [
                      {
                        "index": "PRIMARY",
                        "usable": false,
                        "cause": "query_references_nonkey_column"
                      }
                    ] /* potential_skip_scan_indexes */
                  } /* skip_scan_range */,
                  "analyzing_range_alternatives": {  // Analysis range options
                    "range_scan_alternatives": [
                      {
                        "index": "PRIMARY",
                        "ranges": [
                          "id < 10"
                        ] /* ranges */,
                        "index_dives_for_eq_ranges": true,
                        "rowid_ordered": true,
                        "using_mrr": false,
                        "index_only": false,
                        "rows": 1,
                        "cost": 1.11,
                        "chosen": true
                      }
                    ] /* range_scan_alternatives */,
                    "analyzing_roworder_intersect": {
                      "usable": false,
                      "cause": "too_few_roworder_scans"
                    } /* analyzing_roworder_intersect */
                  } /* analyzing_range_alternatives */,
                  "chosen_range_access_summary": {  // Select the scope to access the summary
                    "range_access_plan": {
                      "type": "range_scan",
                      "index": "PRIMARY",
                      "rows": 1,
                      "ranges": [
                        "id < 10"
                      ] /* ranges */
                    } /* range_access_plan */,
                    "rows_for_plan": 1,
                    "cost_for_plan": 1.11,
                    "chosen": true
                  } /* chosen_range_access_summary */
                } /* range_analysis */
              }
            ] /* rows_estimation */
          },
          {
            "considered_execution_plans": [  // Consider implementation plan
              {
                "plan_prefix": [
                ] /* plan_prefix */,
                "table": "`student`",
                "best_access_path": {  // Best access path
                  "considered_access_paths": [
                    {
                      "rows_to_scan": 1,
                      "access_type": "range",
                      "range_details": {
                        "used_index": "PRIMARY"
                      } /* range_details */,
                      "resulting_rows": 1,
                      "cost": 1.21,
                      "chosen": true
                    }
                  ] /* considered_access_paths */
                } /* best_access_path */,
                "condition_filtering_pct": 100,  // Row filter percentage
                "rows_for_plan": 1,
                "cost_for_plan": 1.21,
                "chosen": true
              }
            ] /* considered_execution_plans */
          },
          {
            "attaching_conditions_to_tables": {  // Attach the condition to the table
              "original_condition": "(`student`.`id` < 10)",
              "attached_conditions_computation": [
              ] /* attached_conditions_computation */,
              "attached_conditions_summary": [  // Summary of additional conditions
                {
                  "table": "`student`",
                  "attached": "(`student`.`id` < 10)"
                }
              ] /* attached_conditions_summary */
            } /* attaching_conditions_to_tables */
          },
          {
            "finalizing_table_conditions": [
              {
                "table": "`student`",
                "original_table_condition": "(`student`.`id` < 10)",
                "final_table_condition   ": "(`student`.`id` < 10)"
              }
            ] /* finalizing_table_conditions */
          },
          {
            "refine_plan": [  // Streamline plans
              {
                "table": "`student`"
              }
            ] /* refine_plan */
          }
        ] /* steps */
      } /* join_optimization */
    },
    {
      "join_execution": {  // perform
        "select#": 1,
        "steps": [
        ] /* steps */
      } /* join_execution */
    }
  ] /* steps */
}
// The first 3 part : When the tracking information is too long , The number of bytes of truncated trace information .
MISSING_BYTES_BEYOND_MAX_MEM_SIZE: 0  // Missing bytes exceeding maximum capacity
// The first 4 part : Whether the user executing the trace statement has permission to view the object . When you don't have permission , The column information is 1 And TRACE Field is empty , Generally in
 Call with SQL SECURITY DEFINER In the case of stored procedures , This problem will arise .
          INSUFFICIENT_PRIVILEGES: 0  // Missing permissions
1 row in set (0.00 sec)

mysql>
Nine . MySQL Monitor analysis view -sys schema
9.1. Sys schema View summary
- Host related : With host_summary start , It mainly summarizes IO Delayed information .
- Innodb relevant : With innodb start , Sum up innodb buffer Information and transaction waiting innodb Lock information .
- I/o relevant : With io start , Summed up waiting I/O、I/O Usage .
- Memory usage : With memory start , From host 、 Threads 、 Show the memory usage from the perspective of events .
- Connection and session information :processlist and session Related view , Summarize the conversation information .
- Table related : With schema_table The first view , Shows the statistics of the table .
- Index information : The usage of the index is counted , Including redundant indexes and unused indexes .
- Statement related : With statement start , Includes performing a full table scan 、 Use a temporary watch 、 Statement information such as sorting .
- User correlation : With user The first view , Statistics of the files used by users I/O、 Execute statement Statistics .
- Wait for information about the incident : With wait start , Show the delay of waiting Events .
9.2. Sys schema View summary
9.2.1. The index case
#1.  Query redundant index
select * from sys.schema_redundant_indexes;
#2.  Query unused indexes
select * from sys.schema_unused_indexes;
#3.  Query index usage
select index_name,rows_selected,rows_inserted,rows_updated,rows_deleted
from sys.schema_index_statistics where table_schema='dbname' ;
9.2.2. Table related
# 1.  The number of visits to the query table
select table_schema,table_name,sum(io_read_requests+io_write_requests) as io from
sys.schema_table_statistics group by table_schema,table_name order by io desc;
# 2.  Query occupancy bufferpool More tables
select object_schema,object_name,allocated,data
from sys.innodb_buffer_stats_by_table order by allocated limit 10;
# 3.  Check the full table scanning of the table
select * from sys.statements_with_full_table_scans where db='dbname';
9.2.3. Statement related
#1.  monitor SQL Frequency of execution
select db,exec_count,query from sys.statement_analysis
order by exec_count desc;
#2.  The monitoring uses sorted SQL
select db,exec_count,first_seen,last_seen,query
from sys.statements_with_sorting limit 1;
#3.  Monitor the use of temporary tables or disk temporary tables SQL
select db,exec_count,tmp_tables,tmp_disk_tables,query
from sys.statement_analysis where tmp_tables>0 or tmp_disk_tables >0
order by (tmp_tables+tmp_disk_tables) desc;
9.2.4. IO relevant
#1.  View consumed disks IO The file of
select file,avg_read,avg_write,avg_read+avg_write as avg_io
from sys.io_global_by_file_by_bytes order by avg_read limit 10;
9.2.5. Innodb relevant
#1.  Row lock blocking
select * from sys.innodb_lock_waits;
边栏推荐
- 【C语言】深度剖析数据存储的底层原理
- 第一篇博客
- [Julia] exit notes - Serial
- MySQL35-主从复制
- MySQL23-存储引擎
- 15 medical registration system_ [appointment registration]
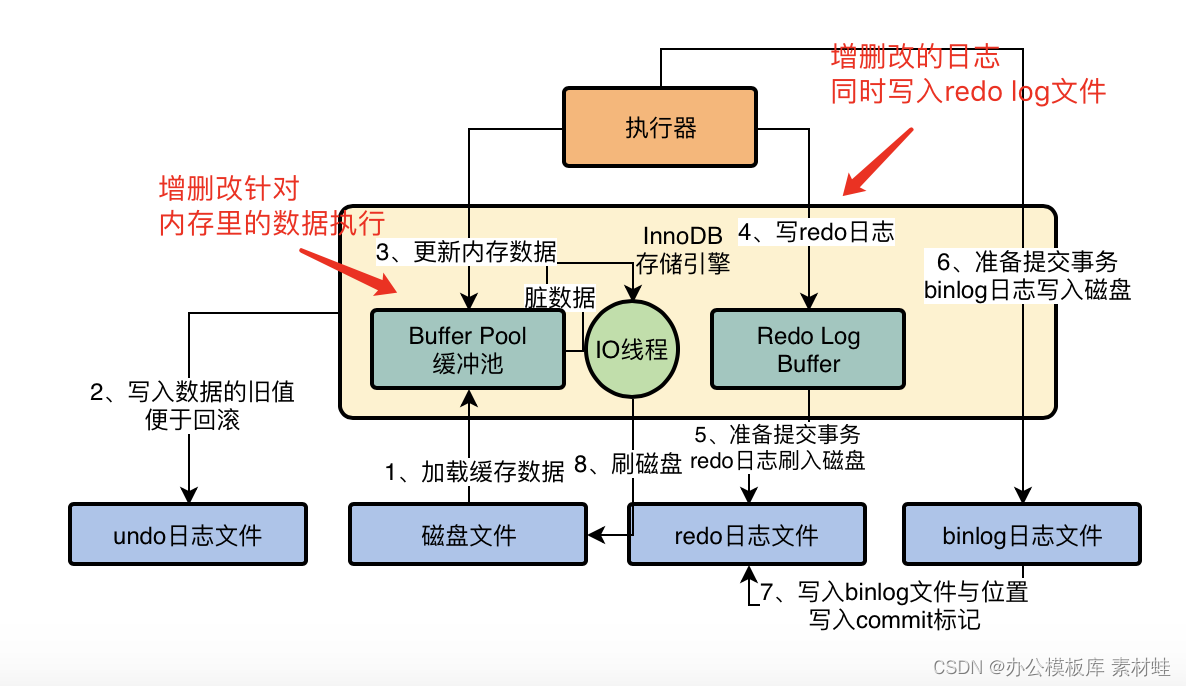
- The underlying logical architecture of MySQL
- [unity] simulate jelly effect (with collision) -- tutorial on using jellysprites plug-in
- MySQL Real Time Optimization Master 04 discute de ce qu'est binlog en mettant à jour le processus d'exécution des déclarations dans le moteur de stockage InnoDB.
- Mysql30 transaction Basics
猜你喜欢
![14 medical registration system_ [Alibaba cloud OSS, user authentication and patient]](/img/c4/81f00c8b7037b5fb4c5df4d2aa7571.png)
14 medical registration system_ [Alibaba cloud OSS, user authentication and patient]
MySQL real battle optimization expert 11 starts with the addition, deletion and modification of data. Review the status of buffer pool in the database
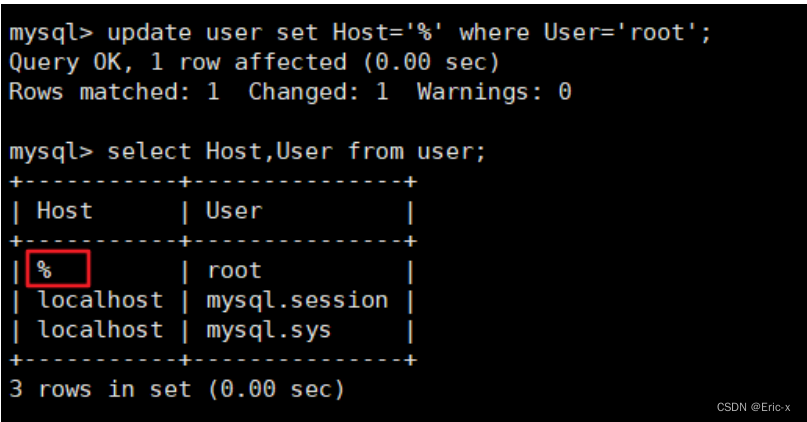
解决在window中远程连接Linux下的MySQL
MySQL29-数据库其它调优策略
MySQL36-数据库备份与恢复
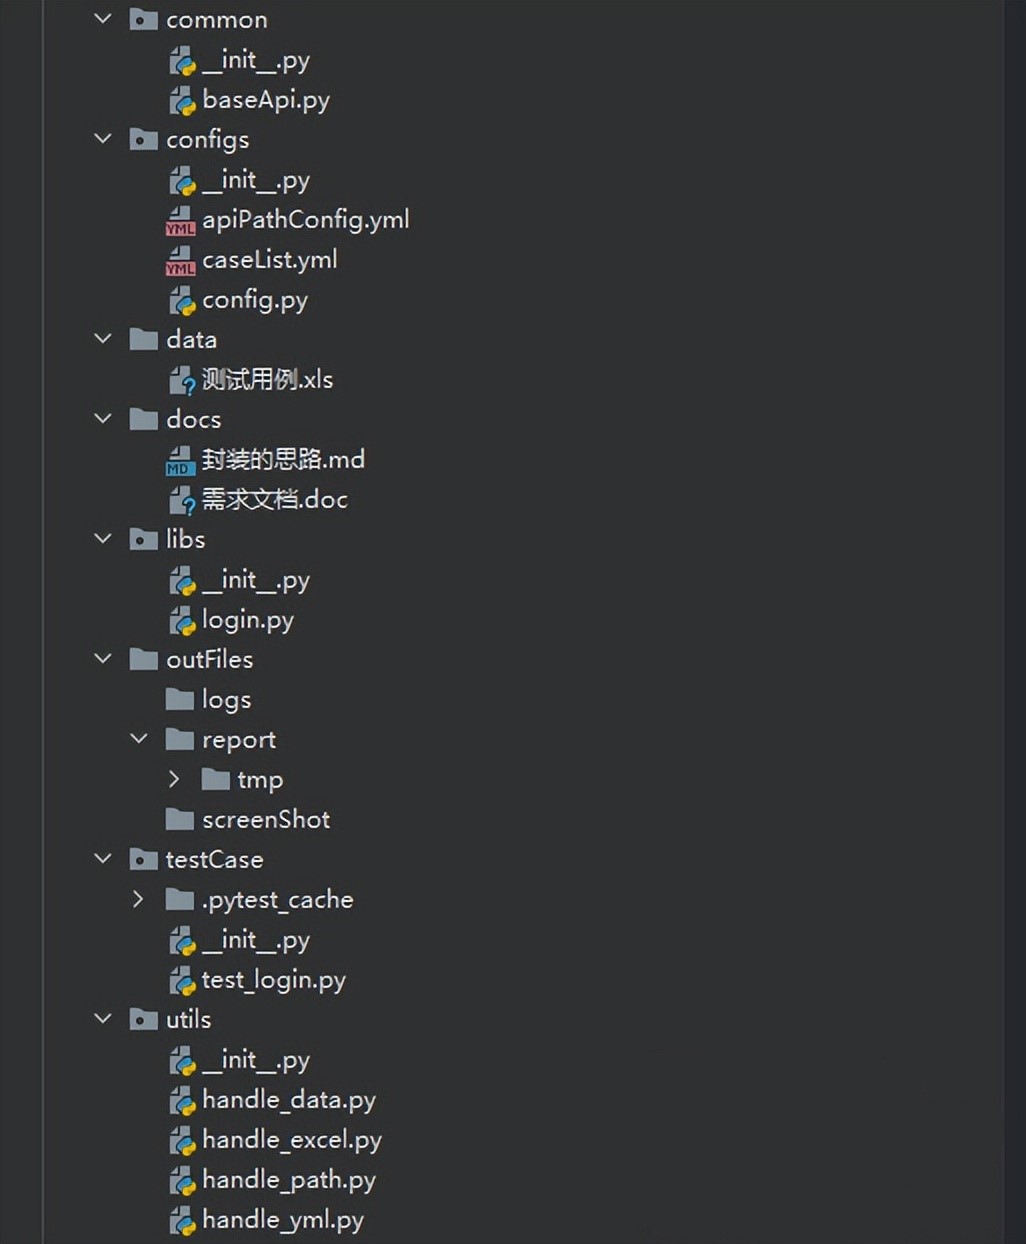
如何搭建接口自动化测试框架?
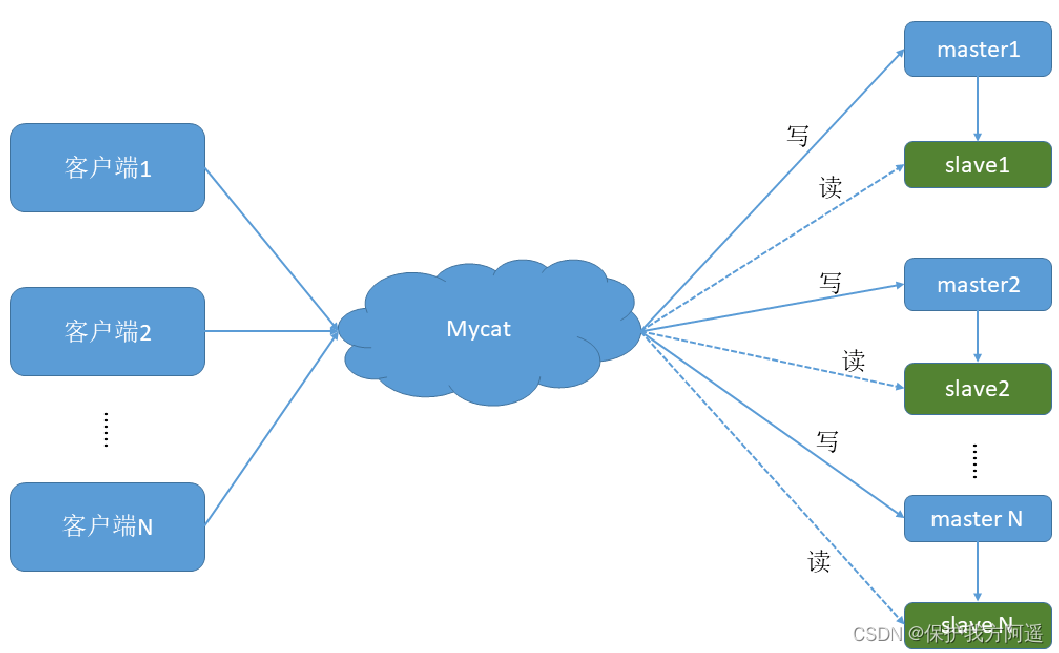
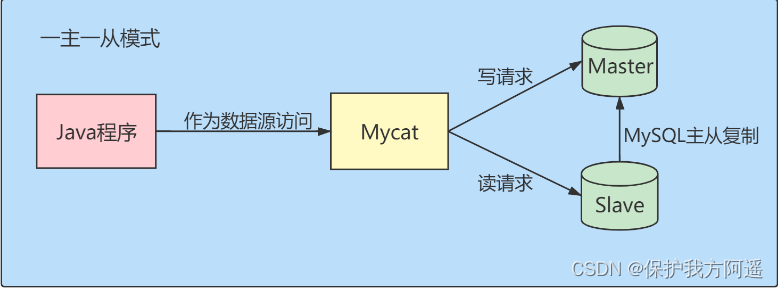
数据库中间件_Mycat总结

What is the current situation of the game industry in the Internet world?
![[after reading the series of must know] one of how to realize app automation without programming (preparation)](/img/eb/e789d88f10787c302f9457ca7ca2cc.jpg)
[after reading the series of must know] one of how to realize app automation without programming (preparation)
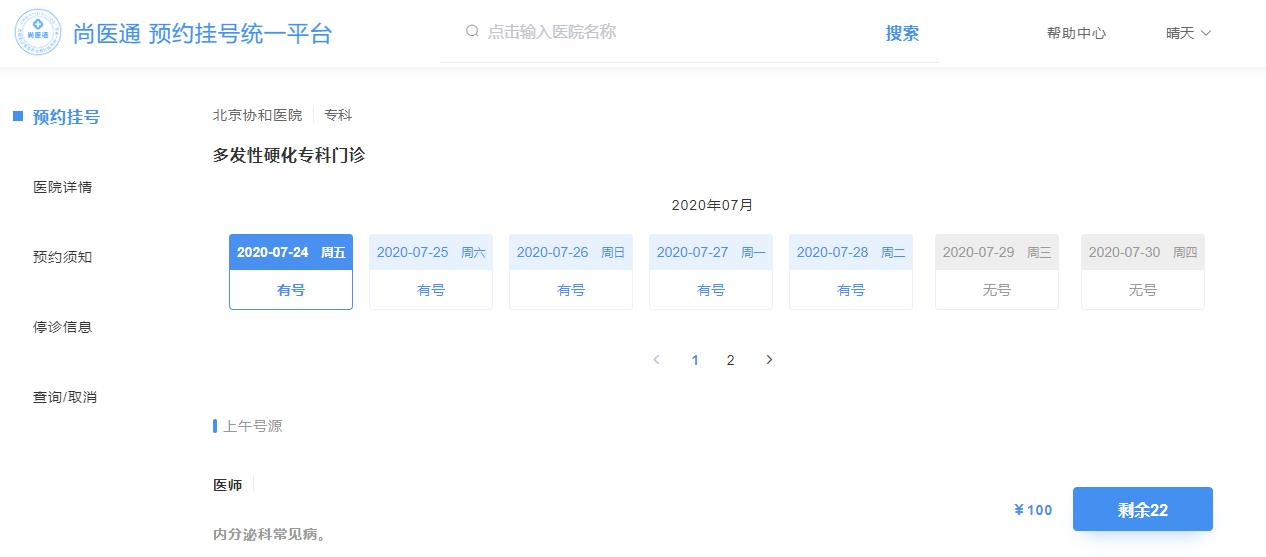
15 医疗挂号系统_【预约挂号】
随机推荐
MySQL combat optimization expert 06 production experience: how does the production environment database of Internet companies conduct performance testing?
Cmooc Internet + education
MySQL實戰優化高手04 借著更新語句在InnoDB存儲引擎中的執行流程,聊聊binlog是什麼?
Mysql30 transaction Basics
MNIST implementation using pytoch in jupyter notebook
Solution to the problem of cross domain inaccessibility of Chrome browser
Technology | diverse substrate formats
Introduction tutorial of typescript (dark horse programmer of station B)
MySQL实战优化高手07 生产经验:如何对生产环境中的数据库进行360度无死角压测?
MySQL30-事务基础知识
Solve the problem of remote connection to MySQL under Linux in Windows
Transactions have four characteristics?
Mysql35 master slave replication
14 医疗挂号系统_【阿里云OSS、用户认证与就诊人】
MySQL34-其他数据库日志
UEditor国际化配置,支持中英文切换
A necessary soft skill for Software Test Engineers: structured thinking
在jupyter NoteBook使用Pytorch进行MNIST实现
Set shell script execution error to exit automatically
Texttext data enhancement method data argument