当前位置:网站首页>Numpy -- epidemic data analysis case
Numpy -- epidemic data analysis case
2022-07-07 15:50:00 【madkeyboard】
List of articles
- Preparation
- Data analysis
- obtain 2020 year 2 month 3 All the data of the day
- **2020 year 1 month 24 How many cumulative confirmed cases were there before September ?**
- ** from 1 month 25 The day is coming 7 month 22 Japan , How many confirmed cases have increased in total ?**
- ** The ratio of newly diagnosed number to newly recovered number every day ? The average ratio , What are the standard deviations ?**
Preparation
Download data files , Read data packets from data files for storage .
Data file address :https://mofanpy.com/static/files/covid19_day_wise.csv
with open("covid19_day_wise.csv", "r", encoding="utf-8") as f:
    data = f.readlines() #  Open the file and read the data

covid = {
     #  Define an object storage date 、 Data and title
    "date": [], #  date
    "data": [], #  data
    "header": [h for h in data[0].strip().split(",") [1:]] #  title
}
for row in data[1:]: #  Store data in groups
    split_row = row.strip().split(",")
    covid["date"].append(split_row[0])
    covid["data"].append([float(n) for n in split_row[1:]])
Data analysis
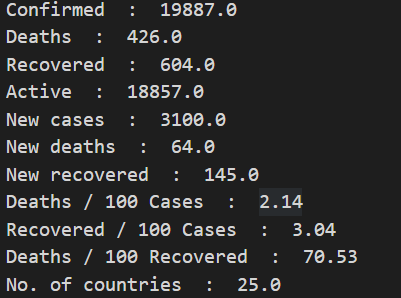
obtain 2020 year 2 month 3 All the data of the day
target = covid["date"].index("2020-02-03") #  Find the subscript of the target date
data = np.array(covid["data"])
for header, number in zip(covid["header"],data[target]):
  print(header," : ",number)
2020 year 1 month 24 How many cumulative confirmed cases were there before September ?
target = covid["date"].index("2020-01-24") #  Find the subscript of the target date
confirm_idx = covid["header"].index("Confirmed") #  Get the subscript of the diagnosis Title
data = np.array(covid["data"])
print("2020  year  1  month  24  The cumulative confirmed cases before September were  %d  individual " % data[target,confirm_idx]) #  Note here that the statistical data does not include 1 month 14

# 2020  year  1  month  24  The cumulative confirmed cases before September were  941  individual
from 1 month 25 The day is coming 7 month 22 Japan , How many confirmed cases have increased in total ?
target_idx1 = covid["date"].index("2020-01-25")
target_idx2 = covid["date"].index("2020-07-22")
new_cases_idx = covid['header'].index("New cases")

data = np.array(covid["data"])
new_cases = data[target_idx1 + 1: target_idx2 + 1,new_cases_idx]

print(" Total growth :",new_cases.sum())

#  Total growth : 15247309.0
The ratio of newly diagnosed number to newly recovered number every day ? The average ratio , What are the standard deviations ?
new_cases_idx = covid['header'].index("New cases")
new_recovered_idx = covid['header'].index("New recovered")

data = np.array(covid["data"])

not_zero_mask = data[:, new_recovered_idx] != 0 #  The divisor filtered out is 0, return false
ratio = data[not_zero_mask,new_cases_idx] / data[not_zero_mask,new_recovered_idx] #  Get the new confirmation number and the new recovery number respectively , Then divide them in turn

print(" The proportion :",ratio[:5]) #  front 5 Group proportion
print(" The average ratio :",ratio.mean(),"\n Standard deviation :",ratio.std())

'''  The proportion : [ 49.5 47.83333333 164.33333333 52.61538462 89.88888889]  The average ratio : 7.049556348053241  Standard deviation : 19.094025710450307 '''
边栏推荐
- Webgl texture
- 使用cpolar建立一个商业网站(2)
- Three. JS introductory learning notes 11:three JS group composite object
- 2. Basic knowledge of golang
- Three. JS introductory learning notes 13: animation learning
- LeetCode2_ Add two numbers
- numpy---基础学习笔记
- 【數字IC驗證快速入門】26、SystemVerilog項目實踐之AHB-SRAMC(6)(APB協議基本要點)
- Clang compile link ffmpeg FAQ
- Three. JS introductory learning notes 0: illustration of how webgl and threejs work
猜你喜欢

Use of SVN

Mesh merging under ue4/ue5 runtime
一大波开源小抄来袭

Getting started with webgl (4)
【微信小程序】Chapter(5):微信小程序基础API接口
JS array foreach source code parsing
Ue4/ue5 multi thread development attachment plug-in download address

Zhongang Mining: Fluorite continues to lead the growth of new energy market
Keil5 does not support online simulation of STM32 F0 series
从 1.5 开始搭建一个微服务框架链路追踪 traceId
随机推荐
20th anniversary of agile: a failed uprising
Oracle control file loss recovery archive mode method
Syntaxhighlight highlights the right scroll bar
航运船公司人工智能AI产品成熟化标准化规模应用,全球港航人工智能/集装箱人工智能领军者CIMC中集飞瞳,打造国际航运智能化标杆
What is Base64?
nodejs package. JSON version number ^ and~
无线传感器网络--ZigBee和6LoWPAN
[quick start of Digital IC Verification] 25. AHB sramc of SystemVerilog project practice (5) (AHB key review, key points refining)
How to build your own super signature system (yunxiaoduo)?
Getting started with webgl (3)
【数字IC验证快速入门】29、SystemVerilog项目实践之AHB-SRAMC(9)(AHB-SRAMC SVTB Overview)
C Alibaba cloud OSS file upload, download and other operations (unity is available)
Introduction of mongod management database method
[quick start of Digital IC Verification] 22. Ahb-sramc of SystemVerilog project practice (2) (Introduction to AMBA bus)
Align individual elements to the right under flex layout
Nacos conformance protocol cp/ap/jraft/distro protocol
Streaming end, server end, player end
How to understand that binary complement represents negative numbers
Gd32 F3 pin mapping problem SW interface cannot be burned
Jacobo code coverage