当前位置:网站首页>Leetcode209 长度最小的子数组
Leetcode209 长度最小的子数组
2022-07-02 09:42:00 【魑魅魍魉114】
给定一个含有 n 个正整数的数组和一个正整数 target 。
找出该数组中满足其和 ≥ target 的长度最小的 连续子数组 [numsl, numsl+1, ..., numsr-1, numsr] ,并返回其长度。如果不存在符合条件的子数组,返回 0 。
滑动窗口:
定义两个指针 start 和end 分别表示子数组(滑动窗口窗口)的开始位置和结束位置,维护变量 sum 存储子数组中的元素和nums[start] 到nums[end] 的元素和。
初始状态下,start 和end 都指向下标 0,sum 的值为 0。
每一轮迭代,将 nums[end] 加到sum,如果sum≥s,则更新子数组的最小长度(此时子数组的长度是 end−start+1),然后将nums[start] 从sum 中减去并将start 右移,直到 sum<s,在此过程中同样更新子数组的最小长度。在每一轮迭代的最后,将end 右移。
public int minSubArrayLen(int target, int[] nums) {
    int start = 0;
    int len = Integer.MAX_VALUE;
    int sum = 0;
    for(int end = 0; end < nums.length; end++){
        sum += nums[right];
        while(sum >= target){
            len = Math.min(len,end-start+1);
            sum -= nums[start++];
            }
        }
    return len == Integer.MAX_VALUE ? 0 : len;
}边栏推荐
- A sharp tool for exposing data inconsistencies -- a real-time verification system
- HOW TO CREATE AN INTERACTIVE CORRELATION MATRIX HEATMAP IN R
- BEAUTIFUL GGPLOT VENN DIAGRAM WITH R
- ESP32音频框架 ESP-ADF 添加按键外设流程代码跟踪
- Take you ten days to easily finish the finale of go micro services (distributed transactions)
- Larvel modify table fields
- excel表格中选中单元格出现十字带阴影的选中效果
- 求16以内正整数的阶乘,也就是n的阶层(0=<n<=16)。输入1111退出。
- Industry analysis
- ESP32存储配网信息+LED显示配网状态+按键清除配网信息(附源码)
猜你喜欢

6方面带你认识LED软膜屏 LED软膜屏尺寸|价格|安装|应用

Seriation in R: How to Optimally Order Objects in a Data Matrice

还不会安装WSL 2?看这一篇文章就够了
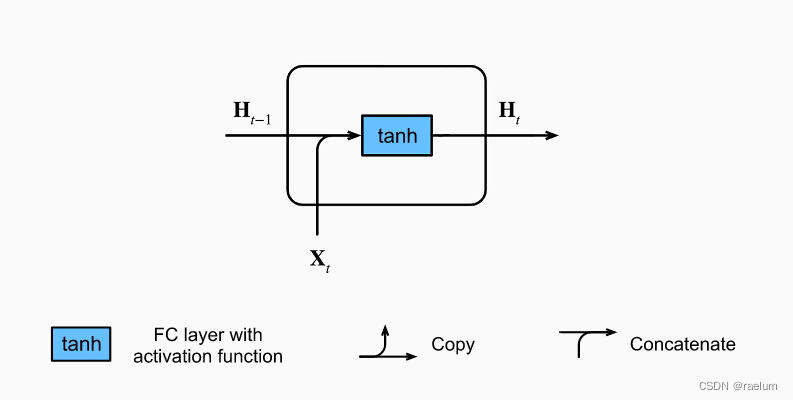
自然语言处理系列(三)——LSTM

数据分析 - matplotlib示例代码
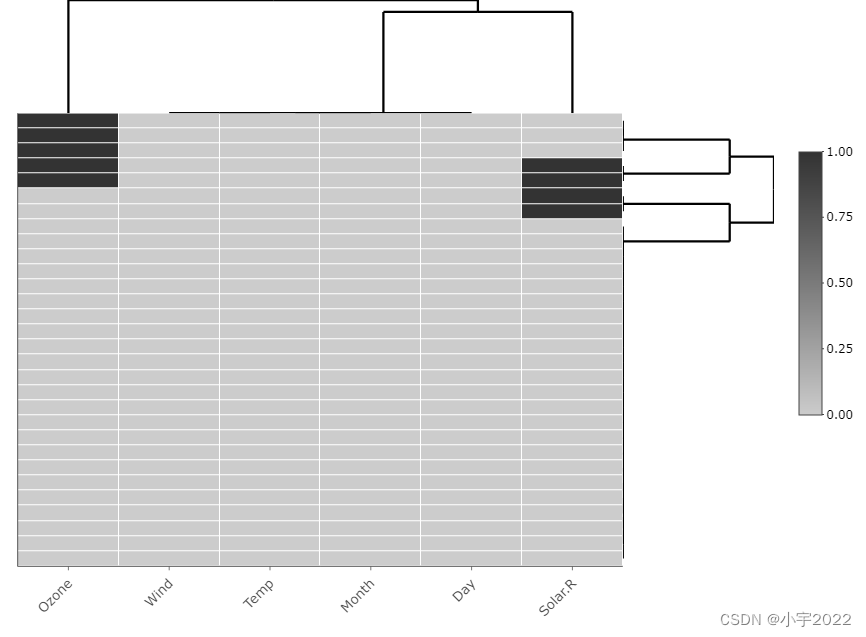
How to Visualize Missing Data in R using a Heatmap

PyTorch nn.RNN 参数全解析
Pytorch builds LSTM to realize clothing classification (fashionmnist)
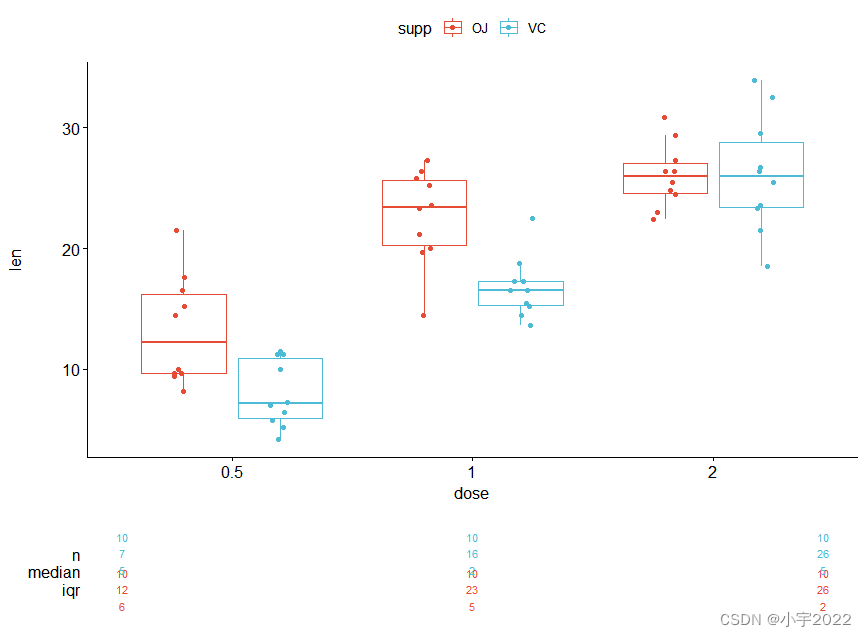
How to Create a Nice Box and Whisker Plot in R

Lekao: contents of the provisions on the responsibility of units for fire safety in the fire protection law
随机推荐
[multithreading] the main thread waits for the sub thread to finish executing, and records the way to execute and obtain the execution result (with annotated code and no pit)
Yygh-10-wechat payment
GGHIGHLIGHT: EASY WAY TO HIGHLIGHT A GGPLOT IN R
Easyexcel and Lombok annotations and commonly used swagger annotations
数据分析 - matplotlib示例代码
Data analysis - Matplotlib sample code
Pytorch builds LSTM to realize clothing classification (fashionmnist)
Fabric.js 3个api设置画布宽高
Implementation of address book (file version)
b格高且好看的代码片段分享图片生成
GGPLOT: HOW TO DISPLAY THE LAST VALUE OF EACH LINE AS LABEL
PgSQL string is converted to array and associated with other tables, which are displayed in the original order after matching and splicing
BEAUTIFUL GGPLOT VENN DIAGRAM WITH R
HOW TO CREATE A BEAUTIFUL INTERACTIVE HEATMAP IN R
Pyqt5+opencv project practice: microcirculator pictures, video recording and manual comparison software (with source code)
Log4j2
【C语言】十进制数转换成二进制数
Develop scalable contracts based on hardhat and openzeppelin (I)
HOW TO ADD P-VALUES TO GGPLOT FACETS
The position of the first underline selected by the vant tabs component is abnormal