当前位置:网站首页>Logistic regression: the most basic neural network
Logistic regression: the most basic neural network
2022-07-05 07:34:00 【sukhoi27smk】
One 、 What is? logictic regression
The picture below is Andrew Ng One provided with logistic regression Schematic diagram of algorithm structure for identifying master and child pictures :

「 On the left 」 Of 「x0 To x12287「 It's input (input), We call it 」 features (feather)」, Often use 「 Column vector x(i)「 To express ( there i On behalf of the i Training samples , Next, when only one sample is discussed , Just omit this mark for the time being , So as not to faint -_-|||), In picture recognition , The feature is usually the pixel value of the picture , Putting all the pixel values in a sequence is the input feature , Each feature has its own 」 The weight (weight)」, It's on the line in the figure 「w0 To w12287」, Usually, we also combine the left and right weights into one 「 Column vector W」.
「 The middle circle 」, We can call it a neuron , It receives input from the left and multiplies it by the corresponding weight , Plus an offset term b( A real number ), So the total input finally received is :
But this is not the final output , Just like neurons , There will be one. 「 Activation function (activation function)「 To process the input , To decide whether to output or how much .Logistic Regression The activation function of is 」sigmoid function 」, Be situated between 0 and 1 Between , The slope in the middle is relatively large , The slope on both sides is very small and tends to zero in the distance . Long like this ( Remember function expressions ):

We use it to represent the output of this neuron ,σ() The function represents sigmoid, Then we can see :
This can be seen as a prediction made by our small model according to the input , In the case corresponding to the initial figure , It is to predict whether the picture is a cat according to the pixels of the picture . With the corresponding , Every sample x Each has its own real label , The representative picture is a cat , It means not a cat . We hope that the output of the model can be as close to the real label as possible , such , This model can be used to predict whether a new picture is a cat . therefore , Our task is to find a group W,b, So that our model can be based on the given , Predict correctly . Here, , We can argue that , As long as the calculated value is greater than 0.5, that y' It's closer to 1, So it can be predicted that “ It's a cat. ”, whereas “ It's not a cat ”.
That's all Logistic Regression The basic structure of .
Two 、 How to learn W and b
In fact, I mentioned earlier , We 「 Need to learn W and b It can make the predicted value of the model y' With real labels y As close as possible to , That is to say y' and y Try to narrow the gap 」. therefore , We can define one 「 Loss function (Loss function)」, To measure and y The gap between :
actually , This is the cross entropy loss function ,Cross-entropy loss. Cross entropy measures the difference between two different distributions , ad locum , That is to measure the gap between our predicted distribution and the official distribution .
How to explain that this formula is suitable as a loss function ? Let's see :
When y=1 when ,, To make L Minimum , The maximum , be =1;
When y=0 when ,, To make L Minimum , Minimum , be =0.
such , Then we know that it meets our expectations for the loss function , Therefore, it is suitable as a loss function .
We know ,x Represents a set of inputs , It is equivalent to the characteristics of a sample . But when we train a model, there will be many training samples , That is, there are many x, There will be x(1),x(2),...,x(m) common m Samples (m Column vectors ), They can be written as a X matrix :
Correspondingly, we also have m A label ,:
There will also be calculated by our model m individual :
The loss function we wrote earlier , Calculate the loss of only one sample . But we need to consider the loss of all training samples , Then the total loss can be calculated in this way :
With the total loss function , Our learning task can be expressed in one sentence :
“ seek w and b, Minimize the loss function ”
To minimize the ... Easier said than done , Fortunately, we have computers , It can help us do a lot of repeated operations , So in neural networks , We usually use 「 Gradient descent method (Gradient Decent)」:

This method is more popular , First, find a random point on the curve , Then calculate the slope of the point , Also known as gradient , Then follow the gradient one step down , After reaching a new point , Repeat the above steps , Until we reach the lowest point ( Or reach a certain condition we meet ). Such as , Yes w Make a gradient descent , Is to repeat the steps ( Repeat once is called a 「 iteration 」):
among := representative “ Update with the following values ”,α representative 「 Learning rate (learning rate)」,dJ/dw Namely J Yes w Finding partial derivatives .
Back to our Logistic Regression problem , Is to initialize (initializing) A group of W and b, And give a learning rate , Specified to 「 The number of iterations 」( Is how many steps you want the dot to go down ), Then, in each iteration, find w and b Gradient of , And update the w and b. The final W and b Is what we learned W and b, hold W and b Put it into our model , It's the model we learned , It can be used to predict !
It should be noted that , The loss we use here is the loss of all training samples . actually , It will be too slow to update with the loss of all samples , But use a sample to update , The error will be very big . therefore , We often choose 「 Batches of a certain size 」(batch), And then calculate a batch Loss within , Then update the parameters .
To sum up :
Logistic Regression Model :, Remember that the activation function used is sigmoid function .
Loss function : Measure the difference between the predicted value and the real value , The smaller the better. .
We usually calculate the total loss of a batch of samples , Then use the gradient descent method to update .
「 The steps of training the model 」:
initialization W and b
Appoint learning rate And the number of iterations
Every iteration , Based on the current W and b Calculate the corresponding gradient (J Yes W,b Partial derivative of ), And then update W and b
End of the iteration , Learning W and b, Bring in the model to predict , Test the accuracy of training set test set separately , To evaluate the model
It's so clear (▰˘◡˘▰)
边栏推荐
- Typecho adds Baidu collection (automatic API submission plug-in and crawler protocol)
- Ue5 hot update - remote server automatic download and version detection (simplehotupdate)
- I can't stand the common annotations of idea anymore
- Leetcode solution - number of islands
- 2022.06.27_ One question per day
- 目标检测系列——Faster R-CNN原理详解
- 公安基础知识--fb
- Close of office 365 reading
- "Source code interpretation" famous programmer TJ's only library
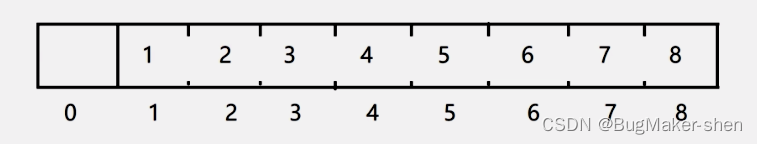
- The mutual realization of C L stack and queue in I
猜你喜欢
Rough notes of C language (1)
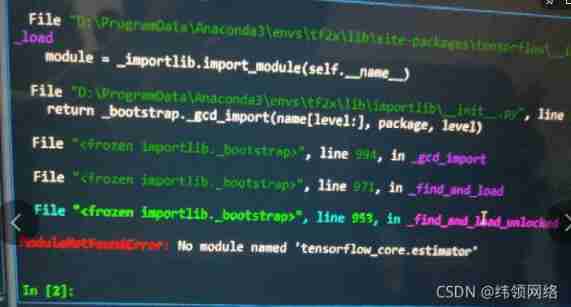
Solve tensorfow GPU modulenotfounderror: no module named 'tensorflow_ core. estimator‘
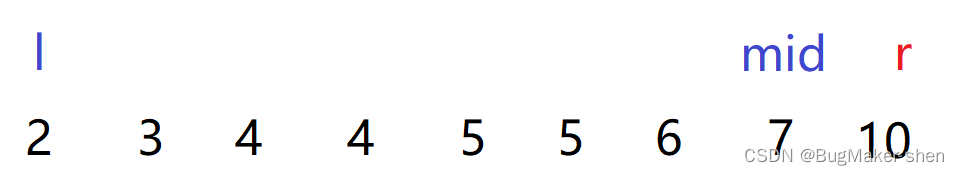
611. Number of effective triangles

Pagoda create multiple sites with one server
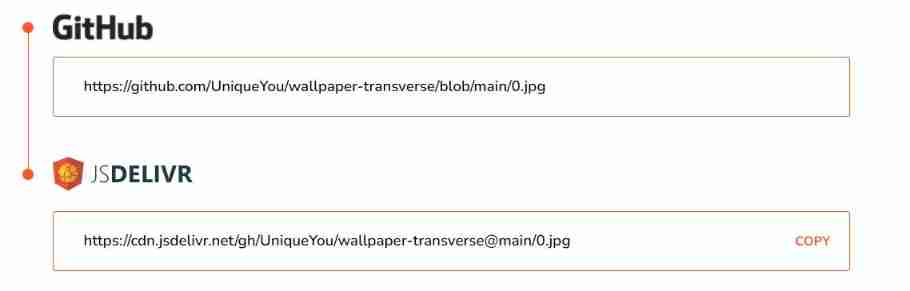
Build your own random wallpaper API for free
并查集理论讲解和代码实现
Ugnx12.0 initialization crash, initialization error (-15)

Oracle-触发器和程序包
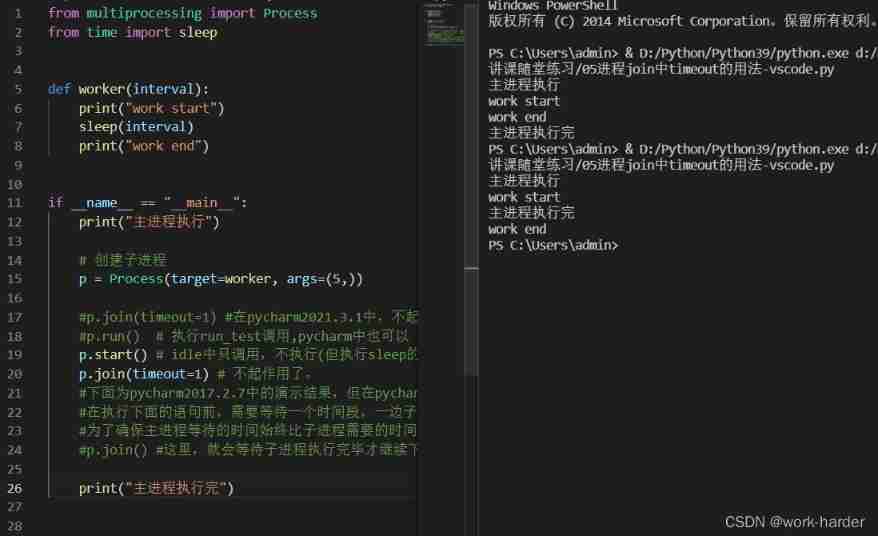
Differences between pycharm and idle and process -- join() in vs Code
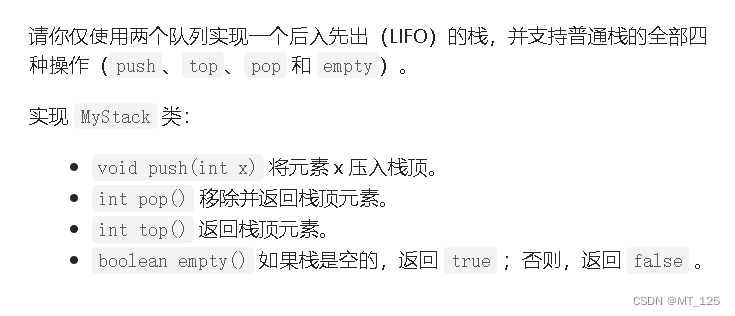
I 用c l 栈与队列的相互实现
随机推荐
HDU1232 畅通工程(并查集)
Database SQL practice 4. Find the last of employees in all assigned departments_ Name and first_ name
Today, share the wonderful and beautiful theme of idea + website address
The problem of configuring opencv in qt5.13.2 is solved in detail
Miracast技术详解(一):Wi-Fi Display
How to modify the file path of Jupiter notebook under miniconda
CADD course learning (5) -- Construction of chemosynthesis structure with known target (ChemDraw)
Web page Chinese display (print, etc.) GBK error, solution, software
Readme, self study record
(tool use) how to make the system automatically match and associate to database fields by importing MySQL from idea and writing SQL statements
Idea common settings
[node] differences among NPM, yarn and pnpm
Professional knowledge of public security -- teacher bilitong
The SQL implementation has multiple records with the same ID, and the latest one is taken
Daily Practice:Codeforces Round #794 (Div. 2)(A~D)
玩转gRPC—深入概念与原理
Apple animation optimization
Shadowless cloud desktop - online computer
Let me teach you how to develop a graphic editor
Apple system shortcut key usage