当前位置:网站首页>skimage学习(3)——Gamma 和 log对比度调整、直方图均衡、为灰度图像着色
skimage学习(3)——Gamma 和 log对比度调整、直方图均衡、为灰度图像着色
2022-07-07 15:32:00 【原知】
1、Gamma 和 log对比度调整
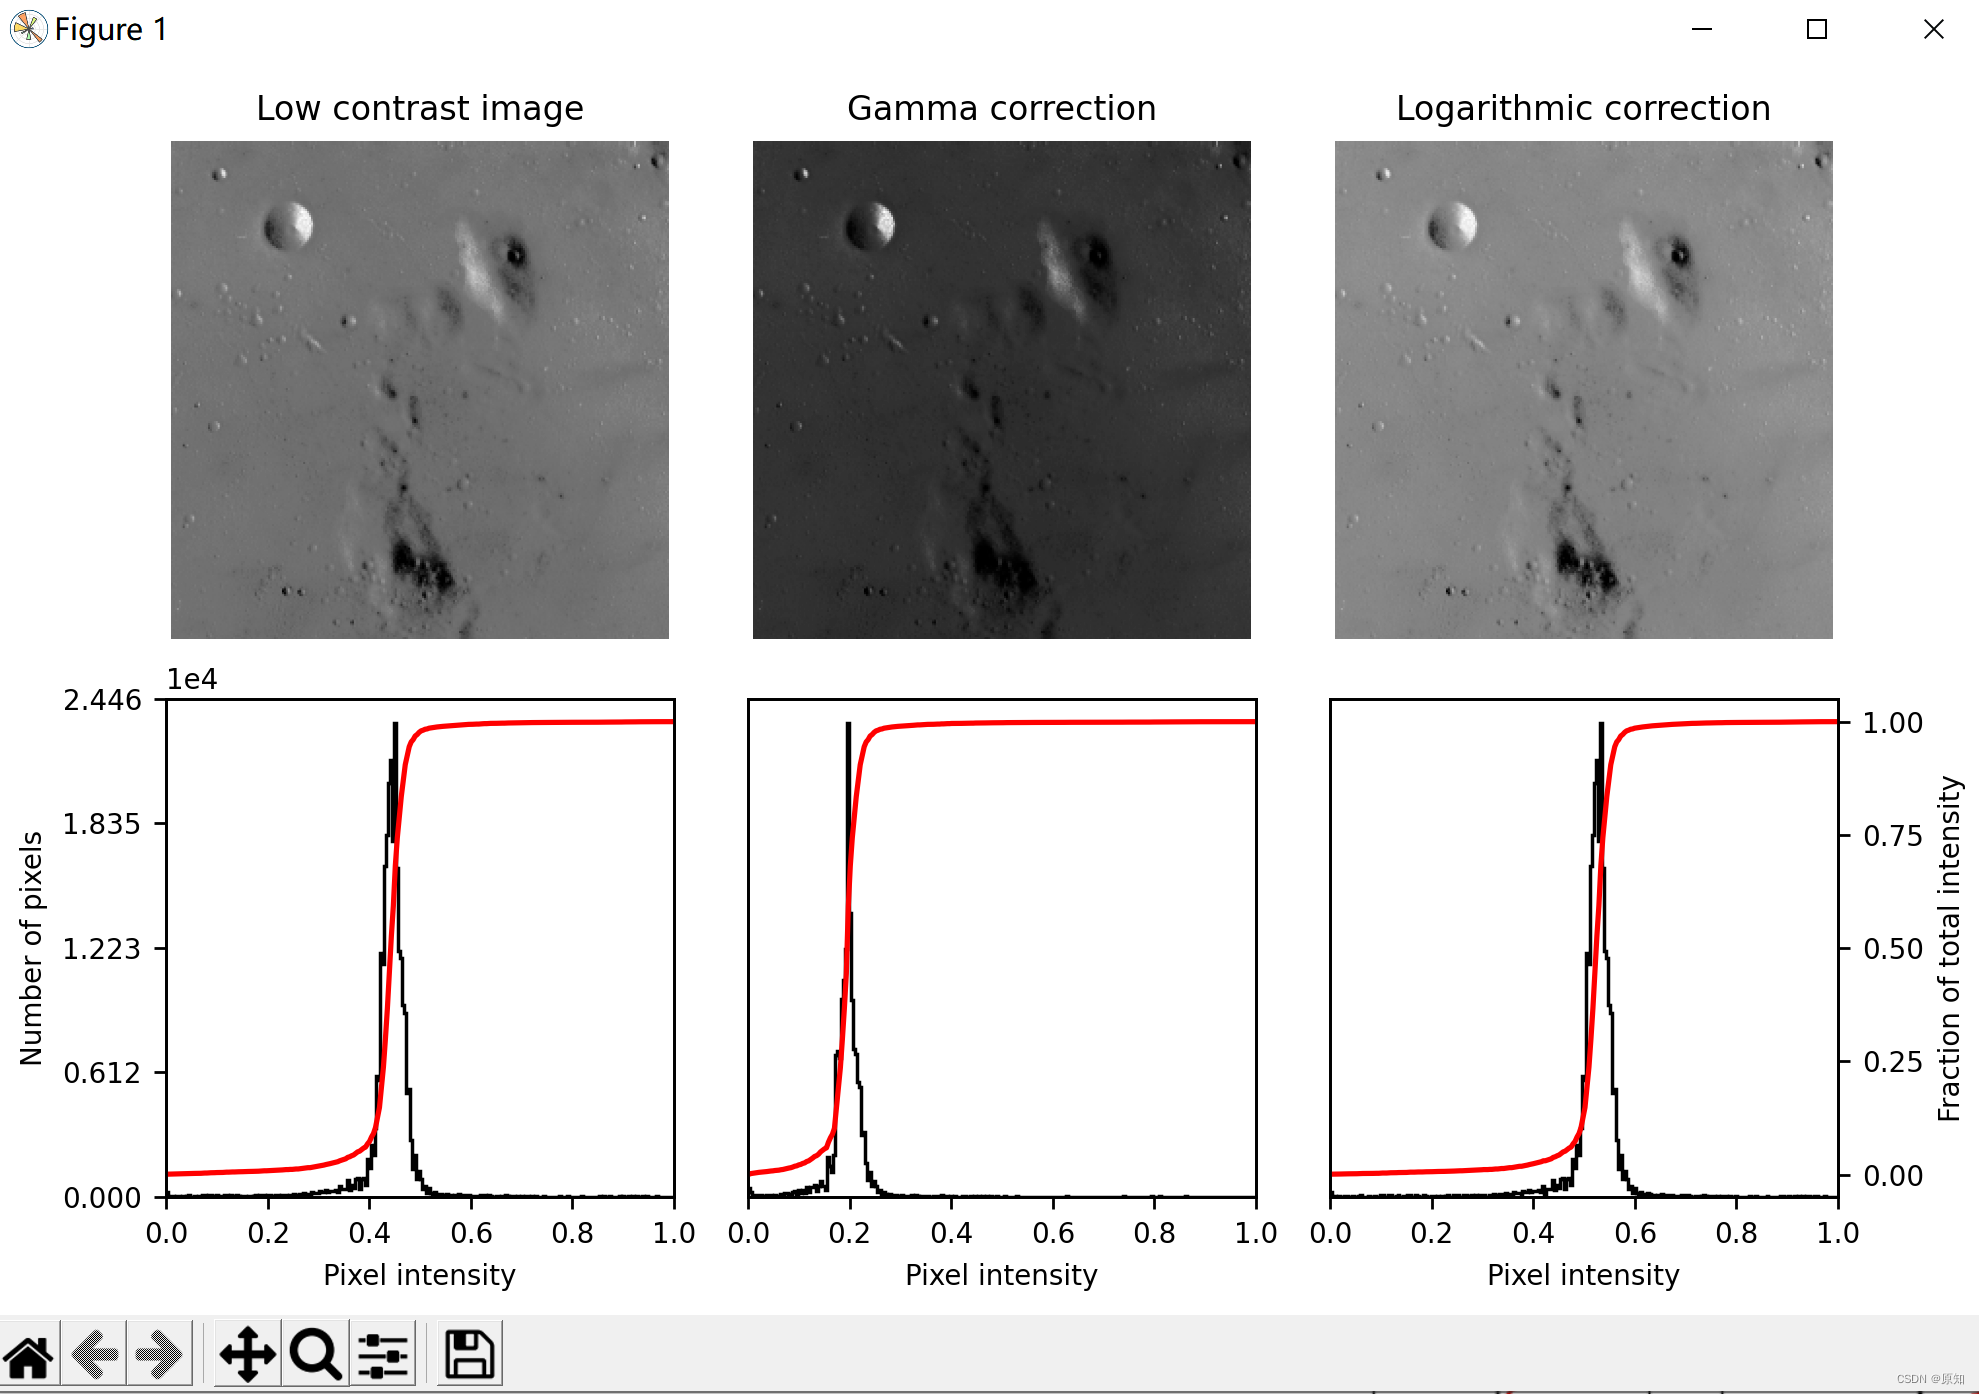
本示例通过对输入图像进行伽马和对数校正来调整图像对比度。
import matplotlib
import matplotlib.pyplot as plt
import numpy as np

from skimage import data, img_as_float
from skimage import exposure

matplotlib.rcParams['font.size'] = 8


def plot_img_and_hist(image, axes, bins=256):
    #绘制图像及其直方图和累积直方图。
    image = img_as_float(image)#转换为浮点型
    ax_img, ax_hist = axes # axes为2行3列图块,第一行为ax_img ,第二行为ax_hist
    ax_cdf = ax_hist.twinx() #twinx()函数表示共享x轴 twiny()表示共享y轴 共享表示的就是第二行所有坐标系的x轴使用同一刻度线

    # Display image
    ax_img.imshow(image, cmap=plt.cm.gray)
    ax_img.set_axis_off()
    ''' Cmap是MATLAB里面用来设定和获取当前色图的函数,可以设置如下色图: hot 从黑平滑过度到红、橙色和黄色的背景色,然后到白色。 cool 包含青绿色和品红色的阴影色。从青绿色平滑变化到品红色。 gray 返回线性灰度色图。 bone 具有较高的蓝色成分的灰度色图。该色图用于对灰度图添加电子的视图。 white 全白的单色色图。 spring 包含品红和黄的阴影颜色。 summer 包含绿和黄的阴影颜色。 autumn 从红色平滑变化到橙色,然后到黄色。 winter 包含蓝和绿的阴影色。 '''
    # Display histogram
    ax_hist.hist(image.ravel(), bins=bins, histtype='step', color='black')
    # bins 为直方图的柱数 image.ravel() 将矩阵拉伸成一维数组
    # histtype: 直方图类型,‘bar’, ‘barstacked’, ‘step’, ‘stepfilled’
    ax_hist.ticklabel_format(axis='y', style='scientific', scilimits=(0, 0))
    # 设置y轴
    # sytle: sci或scientific 科学计数法 plain:自然数
    # sclimits (m, n) 轴的值范围 10的m次方 to 10的n次方 (0,0)表示无限制
    ax_hist.set_xlabel('Pixel intensity')##设置 x轴标签:像素强度
    ax_hist.set_xlim(0, 1)#设置x轴范围0到1
    ax_hist.set_yticks([])
    # set_xticks 与 set_yticks 方法可以显示地设置标号的位置
    # ax.set_xticks([0.25, 0.5, 0.75])
    # ax.set_xticklabels(['a', 'b', 'c'], fontsize=18)

    # Display cumulative distribution
    # 返回给定图像的累积分布函数(cdf) mg_cdf:数组累积分布函数的值。bin_centers:数组中心。
    img_cdf, bins = exposure.cumulative_distribution(image, bins)
    ax_cdf.plot(bins, img_cdf, 'r')
    ax_cdf.set_yticks([])

    return ax_img, ax_hist, ax_cdf


# Load an example image
img = data.moon()

# Gamma
gamma_corrected = exposure.adjust_gamma(img, 2)
''' 图像亮度与对比度的调整,是放在skimage包的exposure模块里面 gamma调整 原理:I=Ig 对原图像的像素,进行幂运算,得到新的像素值。公式中的g就是gamma值。 如果gamma>1, 新图像比原图像暗 如果gamma<1,新图像比原图像亮 函数格式为:skimage.exposure.adjust_gamma(image, gamma=1) gamma参数默认为1,原像不发生变化 。 伽马变换对于图像对比度偏低,并且整体亮度值偏高(对于于相机过曝)情况下的图像增强效果明显。 '''

# 对数
logarithmic_corrected = exposure.adjust_log(img, 1)
''' log 函数的表达式: y=alog(1+x), a 是一个放大系数,x 同样是输入的像素值,取值范围为 [0−1], y 是输出的像素值。 对数变换对于整体对比度偏低并且灰度值偏低的图像增强效果较好。 '''

# 显示结果
fig = plt.figure(figsize=(8, 5))
axes = np.zeros((2, 3), dtype=np.object)#axes两行三列值为0
axes[0, 0] = plt.subplot(2, 3, 1)
axes[0, 1] = plt.subplot(2, 3, 2, sharex=axes[0, 0], sharey=axes[0, 0])
axes[0, 2] = plt.subplot(2, 3, 3, sharex=axes[0, 0], sharey=axes[0, 0])
axes[1, 0] = plt.subplot(2, 3, 4)
axes[1, 1] = plt.subplot(2, 3, 5)
axes[1, 2] = plt.subplot(2, 3, 6)

ax_img, ax_hist, ax_cdf = plot_img_and_hist(img, axes[:, 0])#画布的第一列
ax_img.set_title('Low contrast image')#低对比度图像

y_min, y_max = ax_hist.get_ylim()
ax_hist.set_ylabel('Number of pixels')#像素的数量
ax_hist.set_yticks(np.linspace(0, y_max, 5))#y轴5等分,标记等分数值

ax_img, ax_hist, ax_cdf = plot_img_and_hist(gamma_corrected, axes[:, 1])
ax_img.set_title('Gamma correction')#伽马修正

ax_img, ax_hist, ax_cdf = plot_img_and_hist(logarithmic_corrected, axes[:, 2])
ax_img.set_title('Logarithmic correction')#对数修正

ax_cdf.set_ylabel('Fraction of total intensity')#总强度百分数
ax_cdf.set_yticks(np.linspace(0, 1, 5))#设置y轴标签

# prevent overlap of y-axis labels
fig.tight_layout()
plt.show()
2、直方图均衡
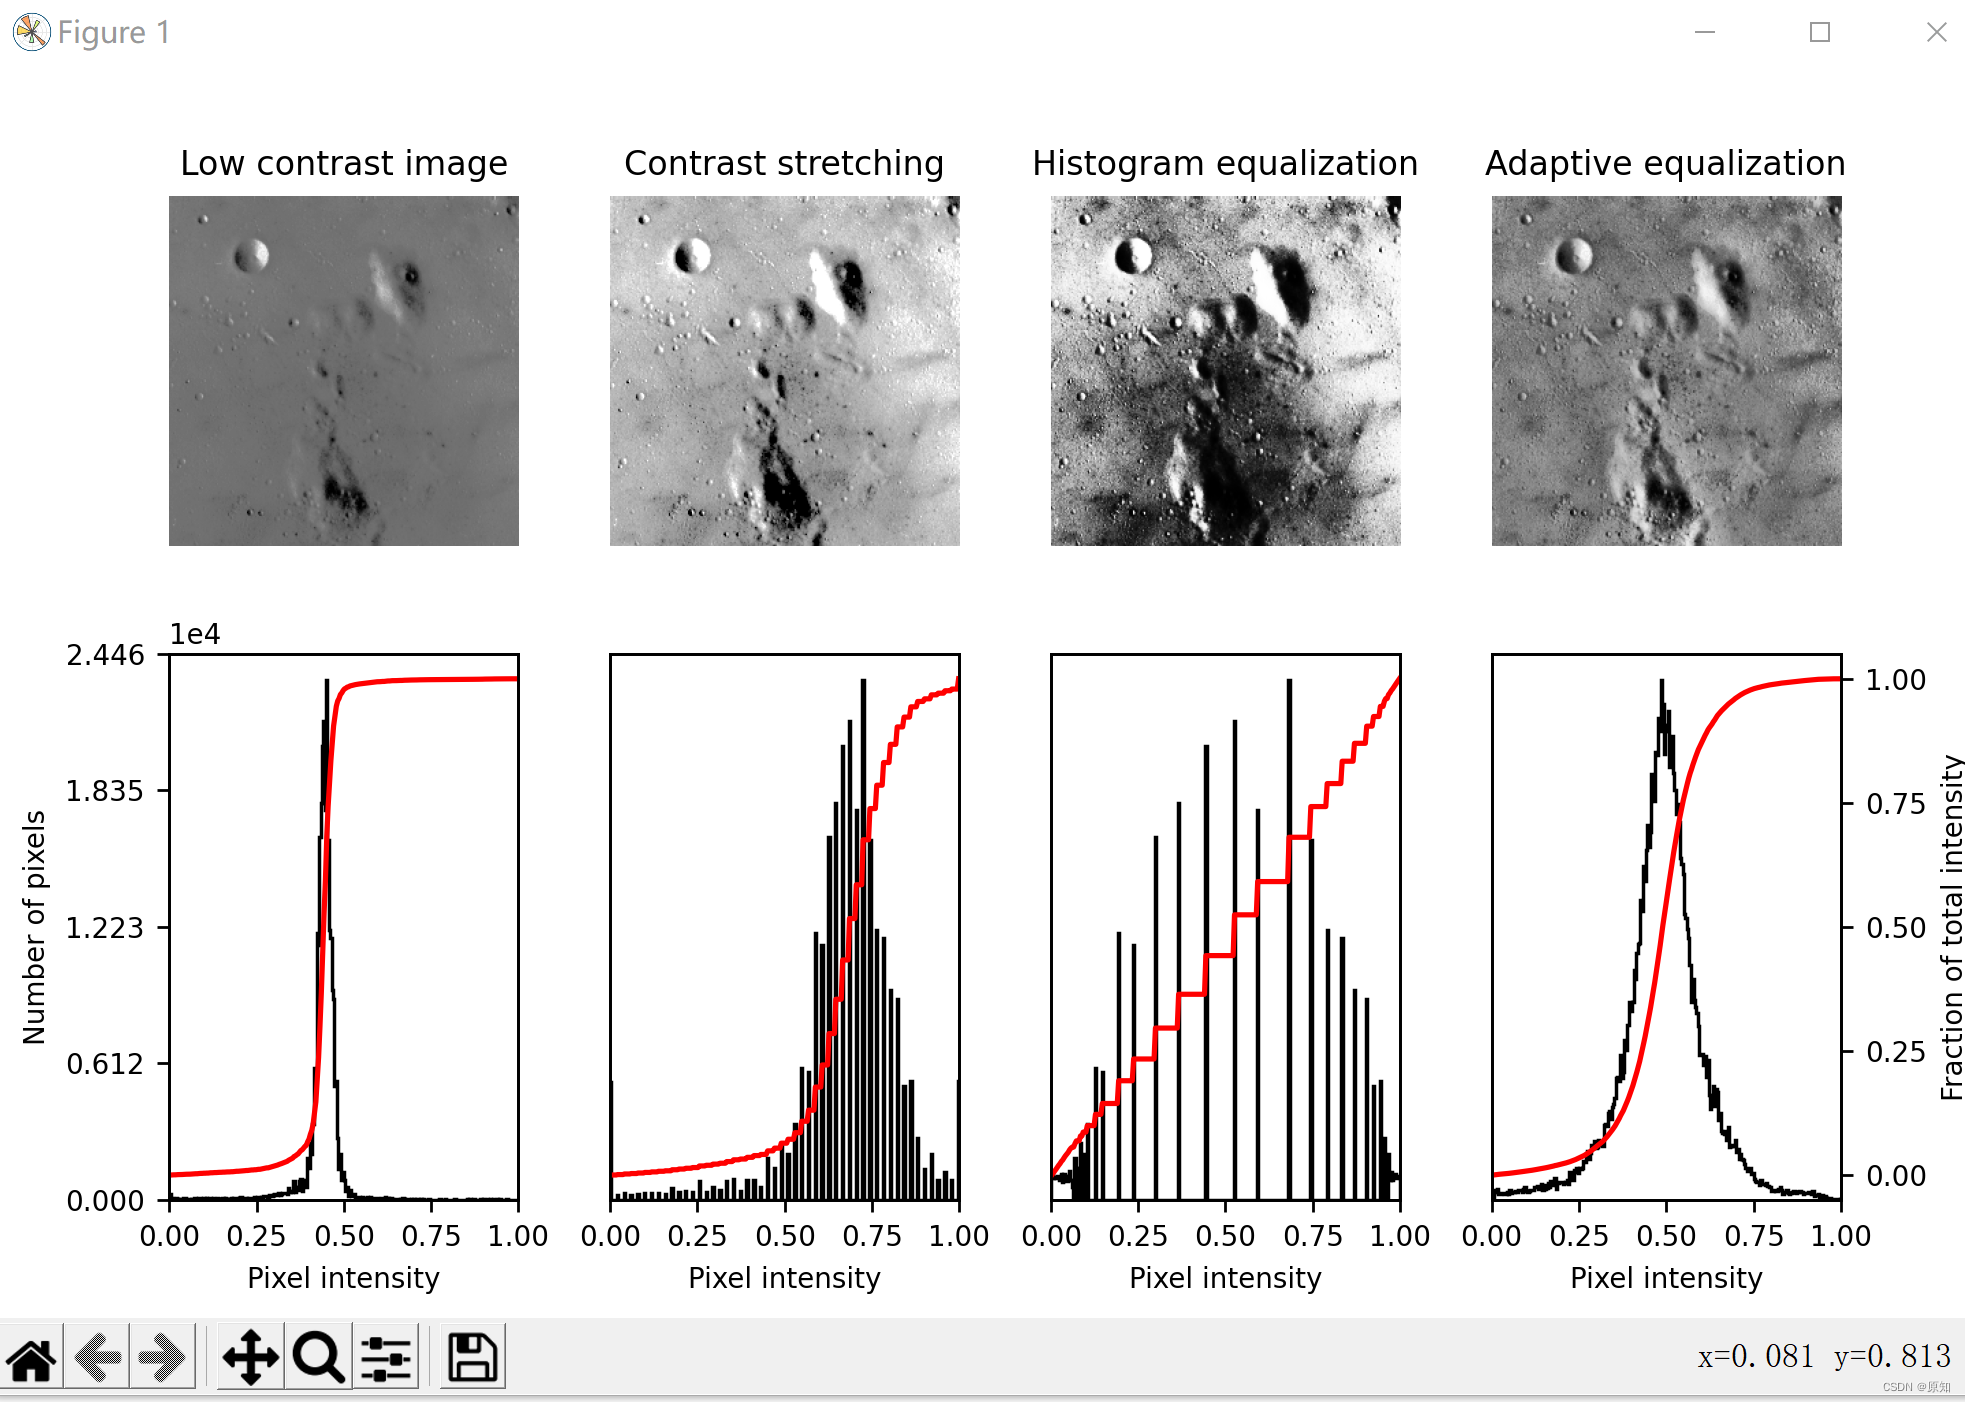
此示例使用称为直方图均衡的方法增强了低对比度的图像,该方法 在图像1中“展开最频繁的强度值” 。均衡后的图像具有大致线性的累积分布函数。
虽然直方图均衡具有不需要参数的优点,但有时会产生看起来不自然的图像。另一种方法是 对比度拉伸,其中图像被重新缩放以包括落在第 2 和第 98 个百分位数内的所有强度。
import matplotlib
import matplotlib.pyplot as plt
import numpy as np

from skimage import data, img_as_float
from skimage import exposure


matplotlib.rcParams['font.size'] = 8


def plot_img_and_hist(image, axes, bins=256):
    """绘制图像及其直方图和累积直方图。 """
    image = img_as_float(image)
    ax_img, ax_hist = axes
    ax_cdf = ax_hist.twinx()

    # 展示图片
    ax_img.imshow(image, cmap=plt.cm.gray)
    ax_img.set_axis_off()

    # 显示柱状图
    ax_hist.hist(image.ravel(), bins=bins, histtype='step', color='black')
    ax_hist.ticklabel_format(axis='y', style='scientific', scilimits=(0, 0))
    ax_hist.set_xlabel('Pixel intensity')
    ax_hist.set_xlim(0, 1)
    ax_hist.set_yticks([])

    # 显示累积分布
    img_cdf, bins = exposure.cumulative_distribution(image, bins)
    ax_cdf.plot(bins, img_cdf, 'r')
    ax_cdf.set_yticks([])

    return ax_img, ax_hist, ax_cdf


# 加载一个示例图片
img = data.moon()

# 对比度拉伸,对比度拉伸是图像增强的一种方法,也属于灰度变换操作
p2, p98 = np.percentile(img, (2, 98))#要计算的(2,98)数序列。计算沿指定轴的数据的第q个百分位数
img_rescale = exposure.rescale_intensity(img, in_range=(p2, p98))#原始像素值不想被拉伸,只是等比例缩小
''' numpy.percentile:https://www.cjavapy.com/article/1087/ exposure.rescale_intensity:https://blog.csdn.net/PresleyR/article/details/116200390 '''

# 均衡
img_eq = exposure.equalize_hist(img)

# 自适应均衡
img_adapteq = exposure.equalize_adapthist(img, clip_limit=0.03)

# 显示结果
fig = plt.figure(figsize=(8, 5))
axes = np.zeros((2, 4), dtype=np.object)
axes[0, 0] = fig.add_subplot(2, 4, 1)
for i in range(1, 4):
    axes[0, i] = fig.add_subplot(2, 4, 1+i, sharex=axes[0,0], sharey=axes[0,0])
for i in range(0, 4):
    axes[1, i] = fig.add_subplot(2, 4, 5+i)

ax_img, ax_hist, ax_cdf = plot_img_and_hist(img, axes[:, 0])
ax_img.set_title('Low contrast image')

y_min, y_max = ax_hist.get_ylim()
ax_hist.set_ylabel('Number of pixels')
ax_hist.set_yticks(np.linspace(0, y_max, 5))

ax_img, ax_hist, ax_cdf = plot_img_and_hist(img_rescale, axes[:, 1])
ax_img.set_title('Contrast stretching')#对比度拉伸

ax_img, ax_hist, ax_cdf = plot_img_and_hist(img_eq, axes[:, 2])
ax_img.set_title('Histogram equalization')#直方图均衡化

ax_img, ax_hist, ax_cdf = plot_img_and_hist(img_adapteq, axes[:, 3])
ax_img.set_title('Adaptive equalization')#自适应均衡

ax_cdf.set_ylabel('Fraction of total intensity')#总强度的分数
ax_cdf.set_yticks(np.linspace(0, 1, 5))

# 防止y轴标签重叠
fig.tight_layout()
plt.show()
3、为灰度图像着色
用某种颜色人为地给图像着色是很有用的,既可以突出图像的特定区域,也可以使灰度图像生动起来。
这个例子通过缩放RGB值和在HSV颜色空间中调整颜色来演示图像着色。
在2D中,彩色图像通常用2D数组的RGB-3层表示,这3层表示图像的ed、(G) green和(B)lue通道。
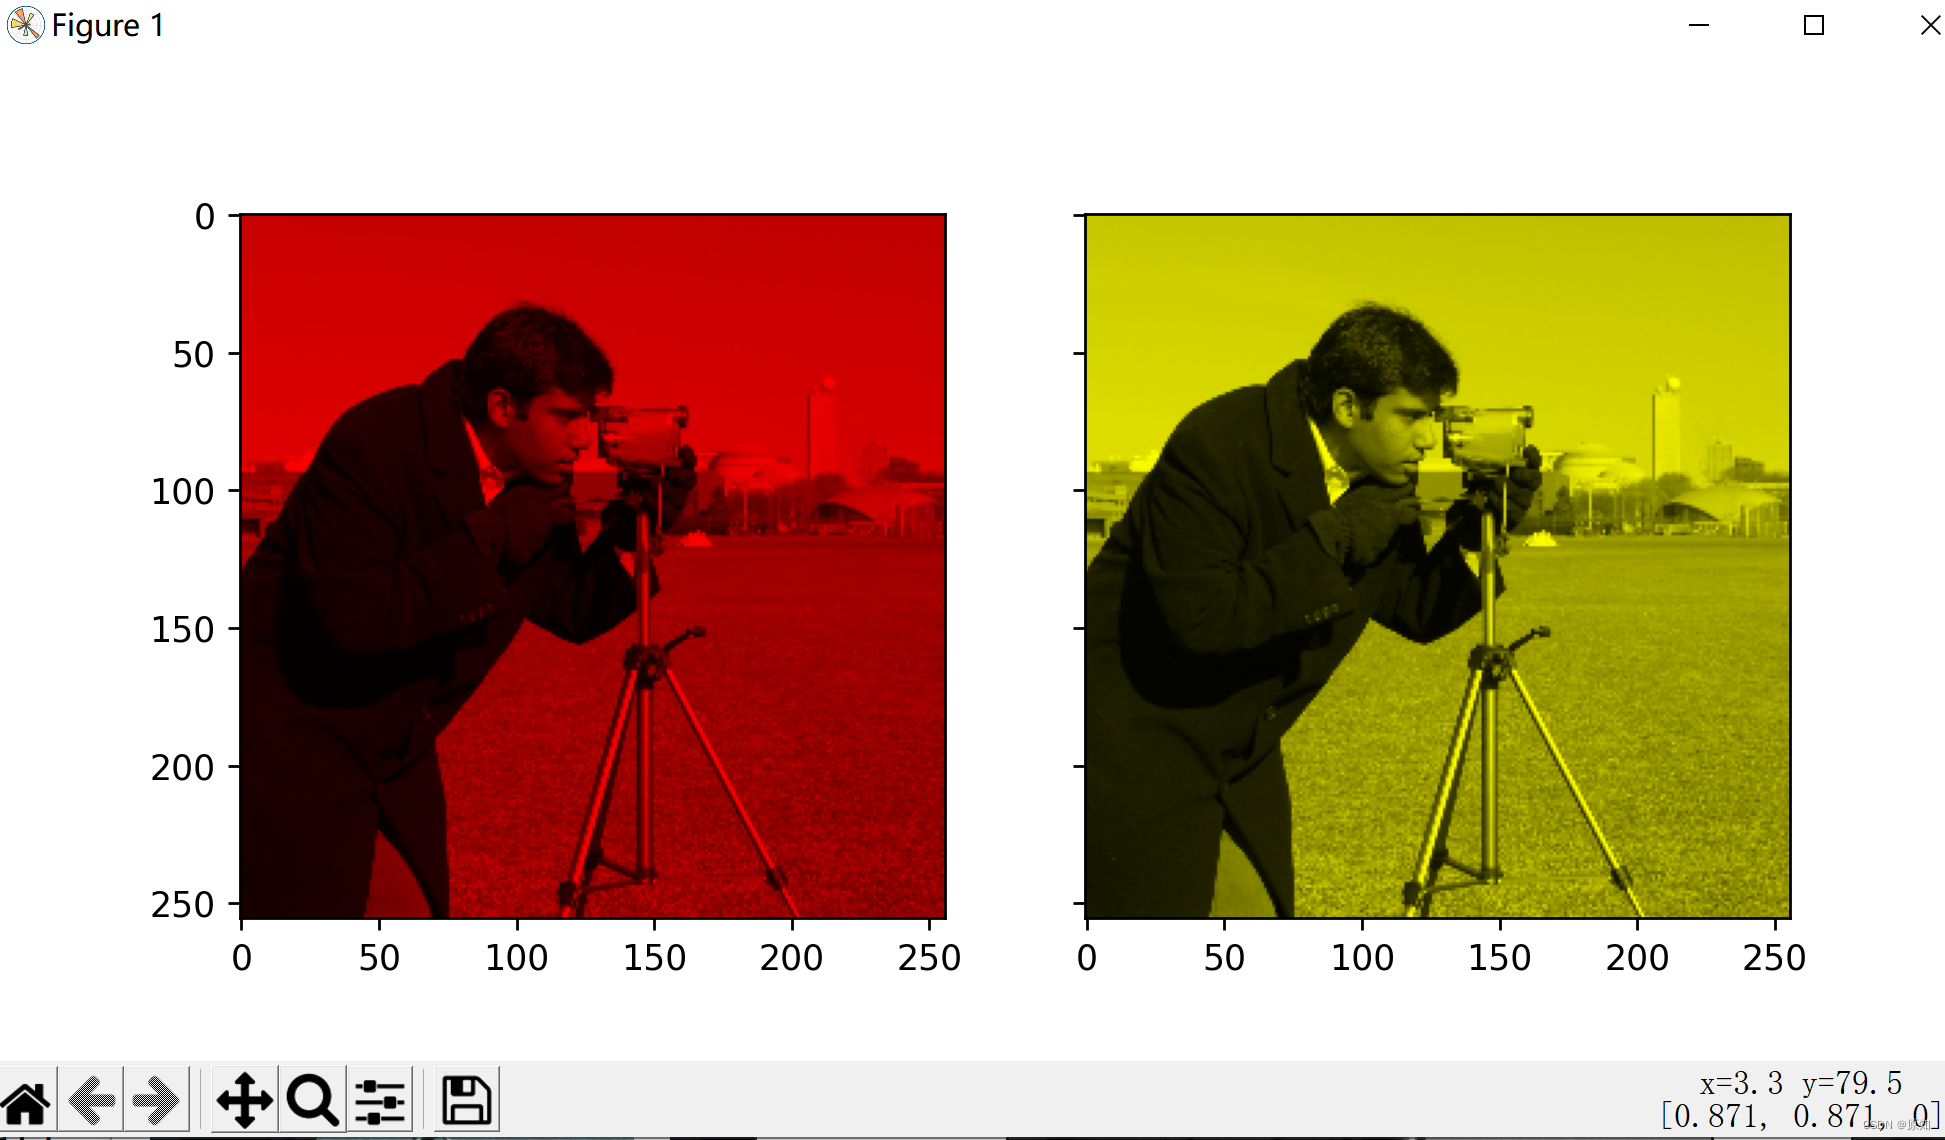
获得着色图像的最简单方法是将每个RGB通道设置为通过每个通道的不同乘数缩放的灰度图像。
''' 例如,将绿色和蓝色通道乘以0只会留下红色通道并产生明亮的红色图像。 同样,将蓝色通道归零,只留下红色和绿色通道,它们结合起来就形成黄色通道。 '''
import matplotlib.pyplot as plt
from skimage import data
from skimage import color
from skimage import img_as_float

grayscale_image = img_as_float(data.camera()[::2, ::2])#浮点型灰度图
image = color.gray2rgb(grayscale_image)#创建灰度图像的RGB表示。

red_multiplier = [1, 0, 0]
yellow_multiplier = [1, 1, 0]

fig, (ax1, ax2) = plt.subplots(ncols=2, figsize=(8, 4),
                               sharex=True, sharey=True)
ax1.imshow(red_multiplier * image)#将绿色和蓝色通道乘以0只会留下红色通道并产生明亮的红色图像
ax2.imshow(yellow_multiplier * image)#将蓝色通道归零,只留下红色和绿色通道,它们结合起来就形成黄色通道

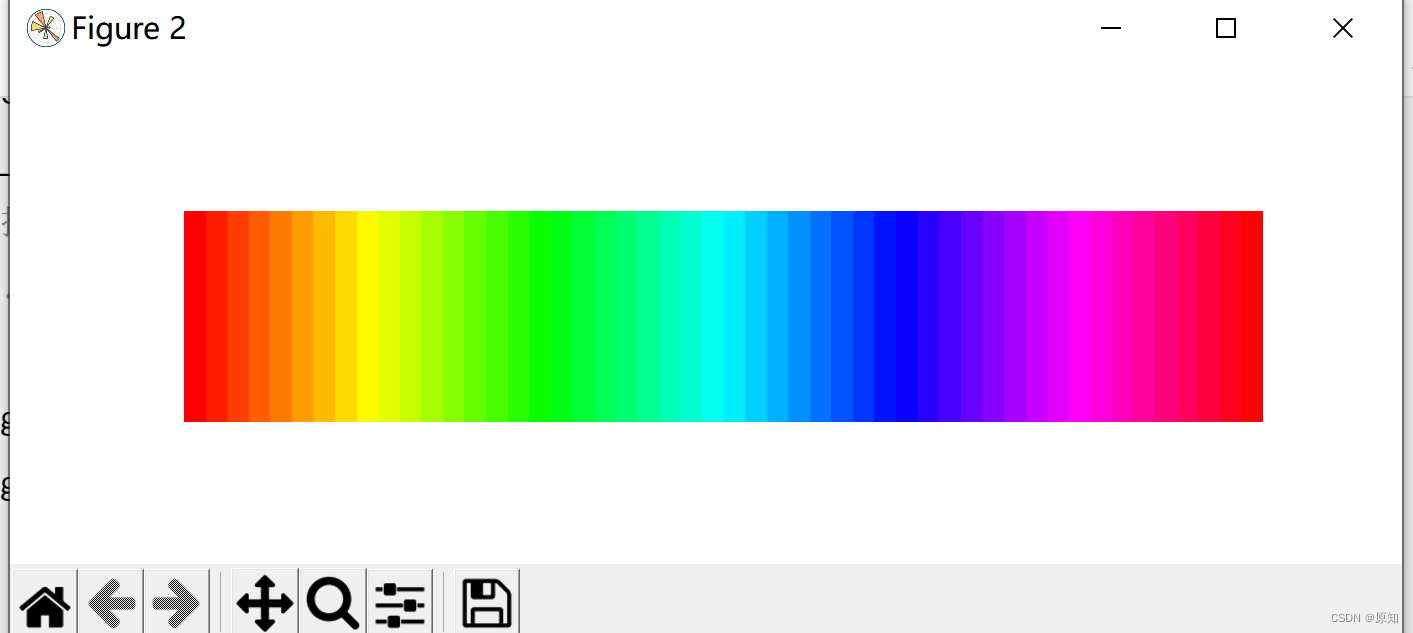
''' 在许多情况下,处理RGB值可能并不理想。正因为如此,有许多其他颜色空间可以用来表示彩色图像。 一个流行的颜色空间叫做HSV,它代表色相(~颜色)、饱和度(~色彩度)和值(~亮度)。 例如,一种颜色(色调)可能是绿色,但它的饱和度是绿色的强度——橄榄色在低端,霓虹灯在高端。 在某些实现中,HSV中的色调从0到360,因为色调环绕在一个圆圈中。 然而,在scikit-image中,色调是从0到1的浮动值,因此色调、饱和度和值共享相同的尺度。 下面,我们在色调中绘制了一个线性梯度,饱和度和值一路上升: '''
import numpy as np

hue_gradient = np.linspace(0, 1)#再0、1之间生成长度为50的数组
hsv = np.ones(shape=(1, len(hue_gradient), 3), dtype=float)#返回长为1,宽为50,高为3的数组
hsv[:, :, 0] = hue_gradient

all_hues = color.hsv2rgb(hsv)#创建灰度图像的RGB表示

fig, ax = plt.subplots(figsize=(5, 2))
# 设置图像范围,使色调从0到1,图像是一个很好的长宽比。
ax.imshow(all_hues, extent=(0 - 0.5 / len(hue_gradient),
                            1 + 0.5 / len(hue_gradient), 0, 0.2))
ax.set_axis_off()

''' 创建一个小实用函数来获取 RGB 图像,并且: 1. 将 RGB 图像转换为 HSV 2. 设置色调和饱和度 3. 将 HSV 图像转换回 RGB '''
def colorize(image, hue, saturation=1):
    """ 将给定色调的颜色添加到RGB图像中。 默认情况下,饱和度设置为1,以便颜色弹出! """
    hsv = color.rgb2hsv(image)
    hsv[:, :, 1] = saturation#饱和度(S)
    hsv[:, :, 0] = hue#色调(H)
    return color.hsv2rgb(hsv)

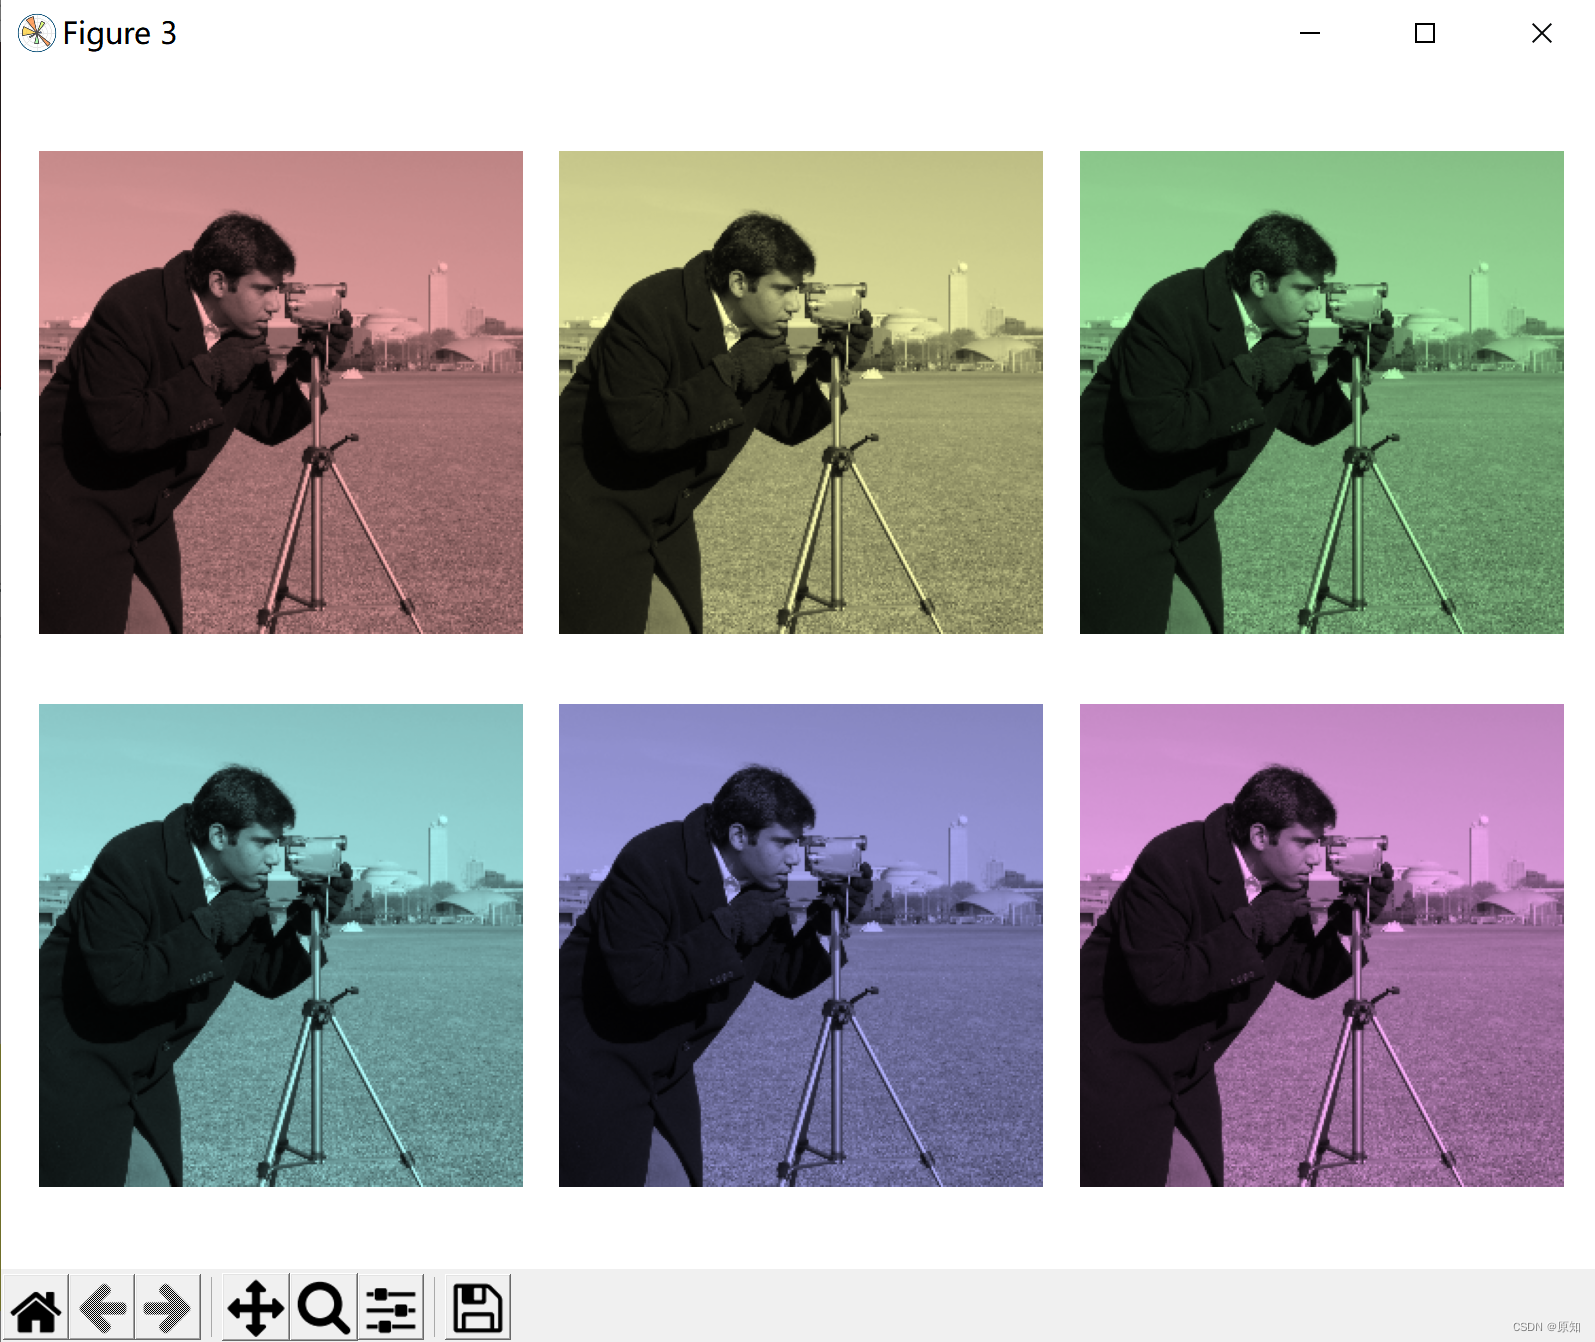
''' 请注意,我们需要提高饱和度;饱和度为零的图像是灰度的,所以我们需要一个非零值才能真正看到我们设置的颜色。 使用上面的函数,我们绘制了六个具有线性渐变色调和非零饱和度的图像: '''
hue_rotations = np.linspace(0, 1, 7)#返回长度为6,在0、1之间均分的数组

fig, axes = plt.subplots(nrows=2, ncols=3, sharex=True, sharey=True)

for ax, hue in zip(axes.flat, hue_rotations):
    # Turn down the saturation to give it that vintage look.
    tinted_image = colorize(image, hue, saturation=0.3)#饱和度为0.3,hue=hue_rotations
    ax.imshow(tinted_image, vmin=0, vmax=1)
    ax.set_axis_off()
fig.tight_layout()

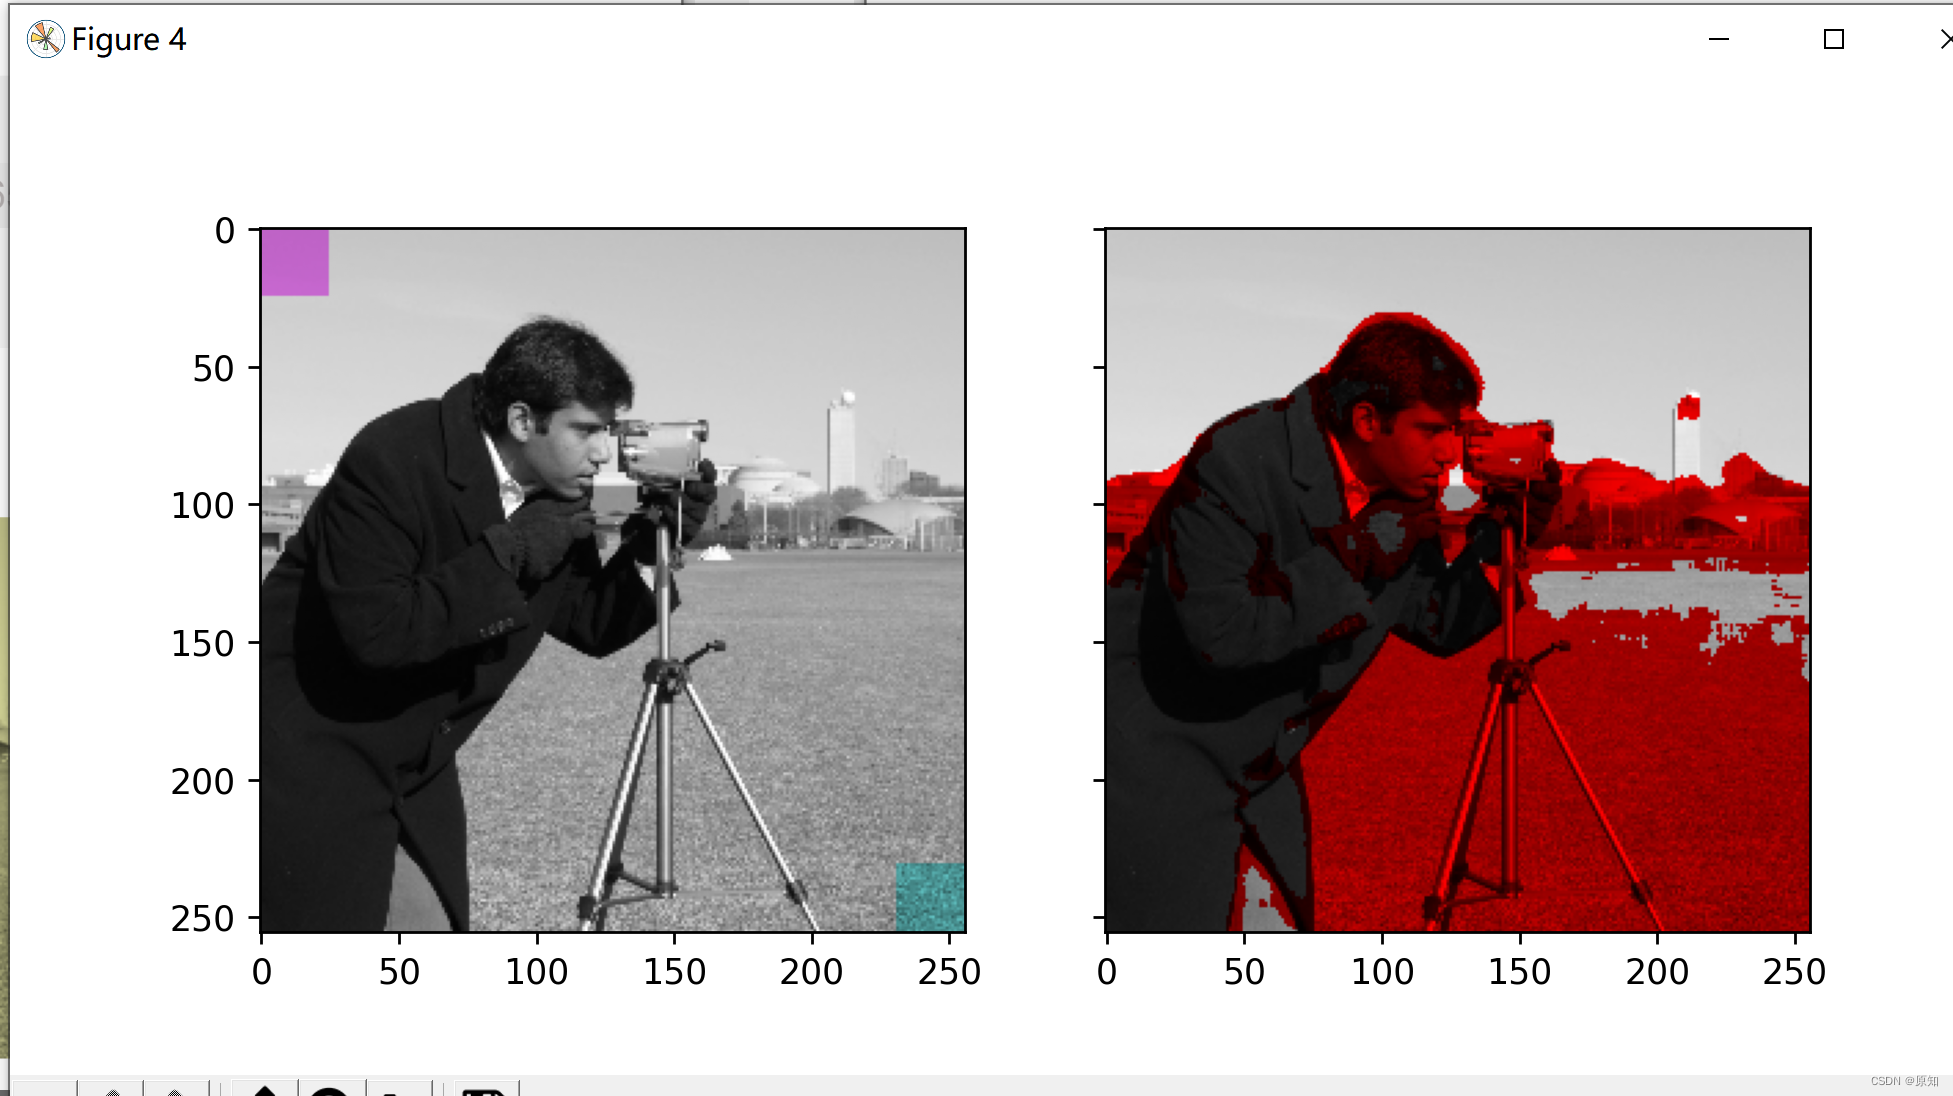
''' 将此着色效果与 numpy 切片和精美索引相结合,以选择性地为您的图像着色。 在下面的示例中,我们使用切片设置一些矩形的色调,并缩放通过阈值处理找到的一些像素的 RGB 值。 在实践中,您可能希望根据分割结果或斑点检测方法定义一个着色区域。 '''
from skimage.filters import rank

# 在前两个维度上定义为切片的正方形区域。
top_left = (slice(25),) * 2#slice()函数实现切片对象,x轴和y轴
bottom_right = (slice(-25, None),) * 2
print("top_left:",top_left)
print("bottom_right:",bottom_right)
#top_left: (slice(None, 25, None), slice(None, 25, None))
#bottom_right: (slice(-25, None, None), slice(-25, None, None))
sliced_image = image.copy()
sliced_image[top_left] = colorize(image[top_left], 0.82, saturation=0.5)#切片染色
sliced_image[bottom_right] = colorize(image[bottom_right], 0.5, saturation=0.5)

# 创建一个蒙版选择区域与有趣的纹理。
noisy = rank.entropy(grayscale_image, np.ones((9, 9)))
''' skimage.filters.rank.entropy(image,footprint,out = None,mask = None,shift_x = False,shift_y = False,shift_z = False) 熵使用以 2 为底的对数计算,即滤波器返回对局部灰度分布进行编码所需的最小位数 参数: 1、image([P,] M, N) ndarray (uint8, uint16) 输入图像。 2、footprint:ndarray 邻域表示为 1 和 0 的 ndarray。 3、out ([P,] M, N) 数组(与输入相同的 dtype) 如果没有,则分配一个新数组。 4、mask:ndarray(整数或浮点数),可选 定义包含在本地邻域中的图像的 (>0) 区域的掩码数组。如果没有,则使用完整的图像(默认)。 5、shift_x, shift_y, shift_z int 添加到封装中心点的偏移量。Shift 受限于封装尺寸(中心必须在给定封装内)。 返回值: out ([P,] M, N) ndarray (float) 输出图像。 '''
textured_regions = noisy > 4.25#筛选,和text_3的用法相似
''' 注意在这里使用colorize有点困难,因为使用rgb2hsv 期望一个RGB图像(高度x宽度x通道),但变址的索引返回 一组RGB像素(# pixels x channel)。 '''
masked_image = image.copy()
masked_image[textured_regions, :] *= red_multiplier
#我猜,这边的意思应该是按照一定的规律把灰度图像的部分范围制红
fig, (ax1, ax2) = plt.subplots(ncols=2, nrows=1, figsize=(8, 4),
                               sharex=True, sharey=True)
ax1.imshow(sliced_image)
ax2.imshow(masked_image)

plt.show()
边栏推荐
- 正在准备面试,分享面经
- 记录Servlet学习时的一次乱码
- 最新Android高级面试题汇总,Android面试题及答案
- PHP has its own filtering and escape functions
- 掌握这套精编Android高级面试题解析,oppoAndroid面试题
- Three. JS series (2): API structure diagram-2
- 如何快速检查钢网开口面积比是否符合 IPC7525
- Binary search tree (basic operation)
- Master this promotion path and share interview materials
- AutoLISP series (1): function function 1
猜你喜欢
随机推荐
QT视频传输
[designmode] facade patterns
射线与OBB相交检测
如何选择合适的自动化测试工具?
如何快速检查钢网开口面积比是否符合 IPC7525
二叉搜索树(基操篇)
Personal notes of graphics (3)
Inner monologue of accidental promotion
As an Android Developer programmer, Android advanced interview
Laravel5.1 Routing - routing packets
What is the difference between IP address and physical address
The team of East China Normal University proposed the systematic molecular implementation of convolutional neural network with DNA regulation circuit
Temperature sensor chip used in temperature detector
[medical segmentation] attention Unet
面试题 01.02. 判定是否互为字符重排-辅助数组算法
Usage of config in laravel
全网“追杀”钟薛高
LeetCode 1186. 删除一次得到子数组最大和 每日一题
字节跳动Android金三银四解析,android面试题app
A tour of gRPC:03 - proto序列化/反序列化
