当前位置:网站首页>Learn kernel 3: use GDB to track the kernel call chain
Learn kernel 3: use GDB to track the kernel call chain
2022-07-04 14:18:00 【Longchizi】
Catalog
3、 ... and Build a simulation environment
One Introduction
Pass the previous two , We make use of QEMU Built on ARM Platform Linux Debug system . Now? , We can study some problems based on this .
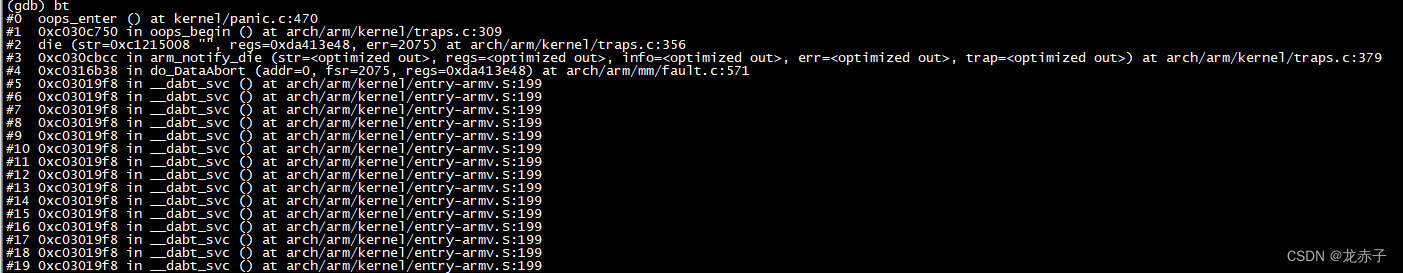
Most commonly used , I think it must be a function call . For example, how a function is called . The other is , When a problem or phenomenon arises , Which functions are called . here , We use the kernel Oops For example , Let's take a look at the exception , How the kernel invokes processing .
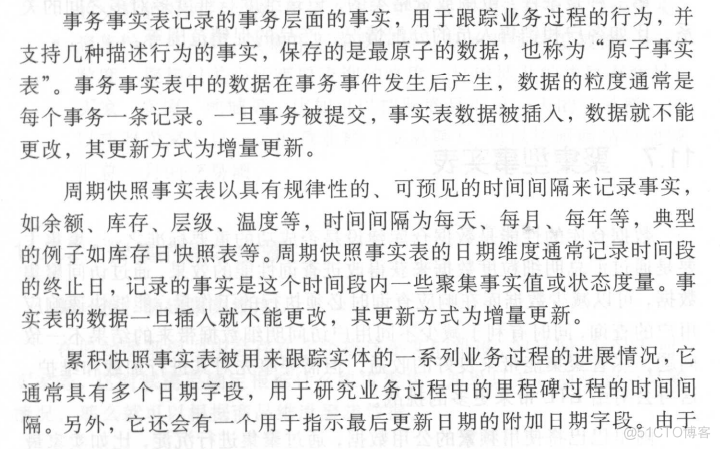
To analyze function calls , The key is to understand the stack structure . Through stack backtracking , You can sort out the function call hierarchy . In the kernel , If you want to know the call stack of a function , You can also use WARN_ON macro , Compared with the BUG_ON,WARN Will not stop execution , I just want to see a certain processing flow , Don't want to take so much trouble to build the environment ( For example, there is a real machine environment ), Like lazy classmates , You can directly add , Similar to printing .
Of course , If we often deal with such problems , To improve efficiency , It is suggested to use other efficient means to solve . This article uses GDB Methods .
Two Why choose Oops
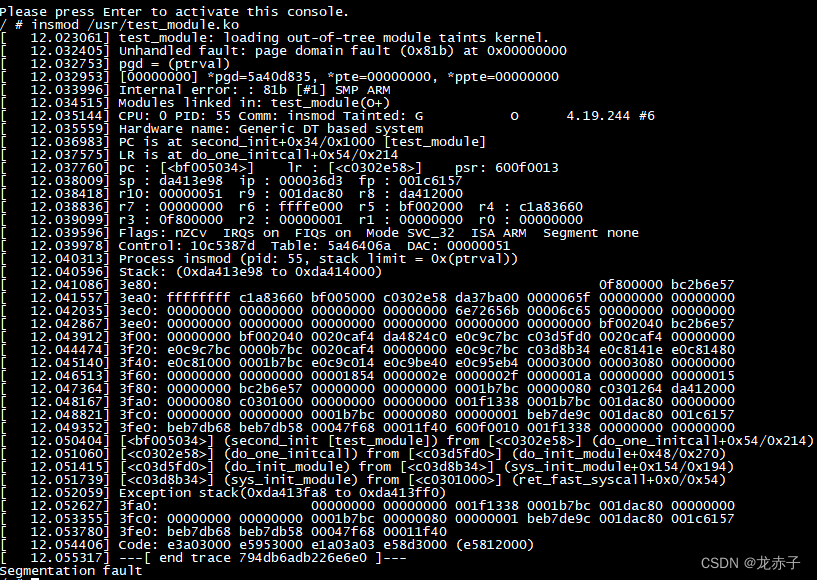
because Oops Typical , It's also tricky . When we encounter Oops when , It indicates that there is a problem somewhere in the kernel . such as , Typical null pointer access . analysis Oops, You need to know something about the stack .Oops Will show when the exception occurs , The field environment of the kernel , Developers need to use these on-site information , Where is the analysis , What causes the problem .
however , On site information , It doesn't seem very friendly . There are many abbreviated characters , There are many registers , There are also many hexadecimal data , wait . If you can't analyze the problem according to the stack , Then these registers and memory data , It is an important reference for further analysis .
however , Premise is , You need to know what these messages mean . The easiest way to get this information , Just watch it appear Oops when , What does the kernel do , You will know what the printed information is . today , We study another debugging method through one debugging method .
3、 ... and Build a simulation environment
For an unfamiliar kernel , Or developers who are not very familiar with the kernel , Want to locate Oops The processing code of , It's not easy . The easiest way to get this done , Is to build a simulation environment , Active trigger Oops, Then add breakpoints , Trace kernel processing , So as to clarify the whole context .
As mentioned earlier , Trigger Oops A common problem of , Is the kernel null pointer . We can execute at some point in the kernel , Add null pointer access code , Then set the breakpoint , You can track the whole process .
however , Today's method , Do not use the method of modifying the kernel , Instead, write a module ko, Then trigger the problem .
We write a very simple module , stay init In the method , Trigger null pointer access .
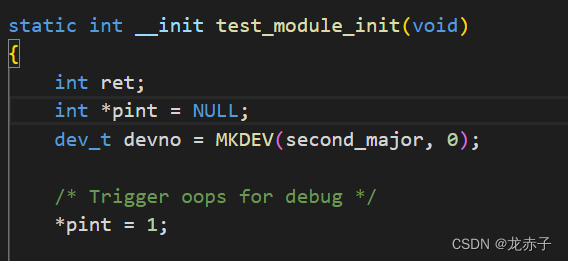
To write makefile
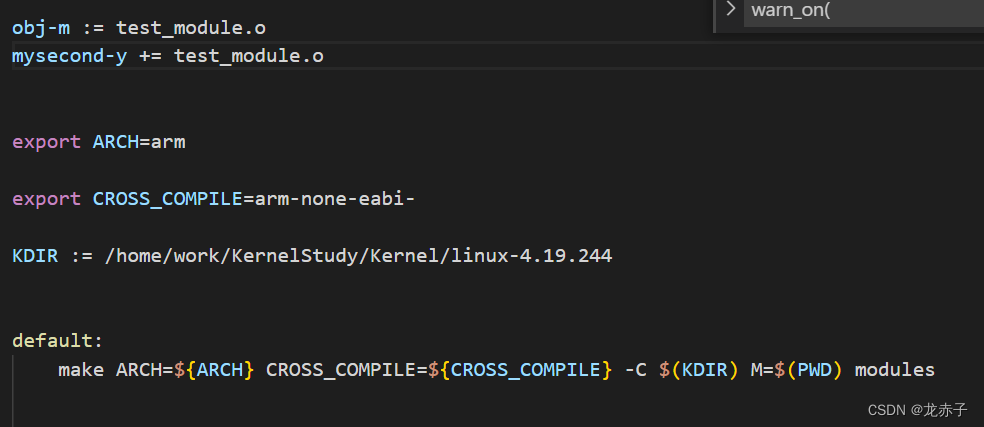
make
Behind us insmod test_module.ko To observe the phenomenon .
stay insmod Before , We need to copy the module to the root file system , Then repack the root file system
![]()
For details, please refer to Series II .
Four Trigger problem
Now? , We can run the system .
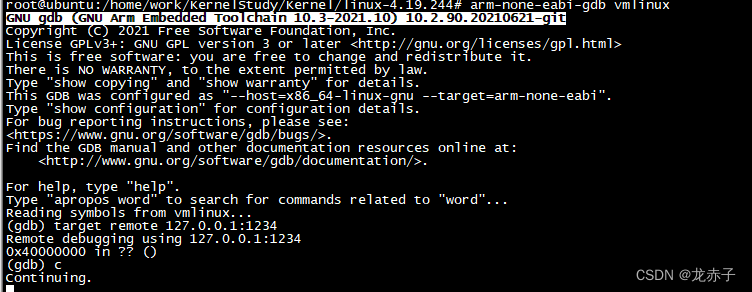
Different from the previous direct startup , in order to gdb debugging , We need to use -s -S Parameters , This allows the kernel to be gdb Mount on .
qemu-system-arm -nographic -s -S -m 512M -M virt -kernel /home/work/KernelStudy/Kernel/linux-4.19.244/arch/arm/boot/zImage -append "rdinit=/linuxrc root=/dev/ram console=ttyAMA0 loglevel=8" -initrd /home/work/KernelStudy/rootfs/rootfs.img after ,gdb Connect
After system startup , Load module , appear Oops, Here's the picture
5、 ... and debugging
Now? , With the means of recurrence , We can debug it .
Be careful , The kernel needs to be configured CONFIG_DEBUG_KERNEL=y, Only in this way can debug symbol information be generated
Because we are loading from user space ko Trigger drive , Setting breakpoints is a little more complicated . however , We can see , There is do_init_module, We can systematize again , load ko Before , Set the breakpoint to this function , You can stop . It's still a little difficult to jump from this place to the problem point , Because we have to go through exception handling .
Of course , If you have a little knowledge of the kernel , You can know that such problems are basically trace In the processing , You can also search the string of the above problem log in the kernel code , Find the associated file , It's like a function , You can stop the test verification . We still look at it in this way .
further , stay __die You can track the output process of the whole log information in one step . For example, the output of the following register
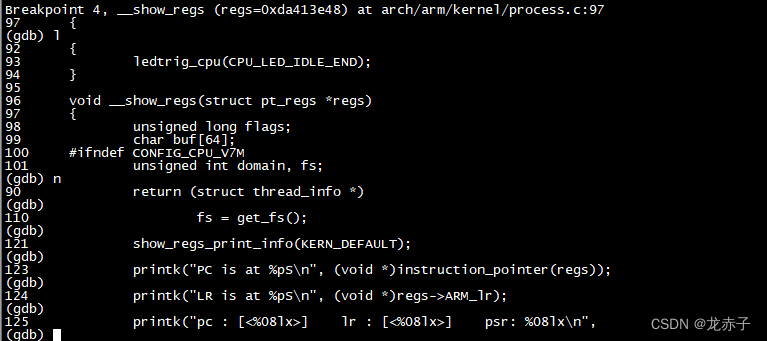
The corresponding output to the terminal is
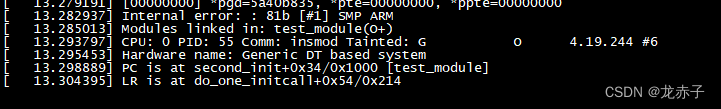
The later ones are no longer displayed .
Here's a way , Code to help developers quickly locate problem points . By debugging , Look at the code , It works better .
边栏推荐
- 1200. Minimum absolute difference
- R语言使用lattice包中的bwplot函数可视化箱图(box plot)、par.settings参数自定义主题模式
- 吃透Chisel语言.04.Chisel基础(一)——信号类型和常量
- 吃透Chisel语言.12.Chisel项目构建、运行和测试(四)——Chisel测试之ChiselTest
- Learning projects are self-made, and growth opportunities are self created
- Can mortgage with housing exclude compulsory execution
- TestSuite and testrunner in unittest
- Assertion of unittest framework
- markdown 语法之字体标红
- 软件测试之测试评估
猜你喜欢
学内核之三:使用GDB跟踪内核调用链
gin集成支付宝支付
数据仓库面试问题准备
![递增的三元子序列[贪心训练]](/img/92/7efd1883c21c0e804ffccfb2231602.png)
递增的三元子序列[贪心训练]
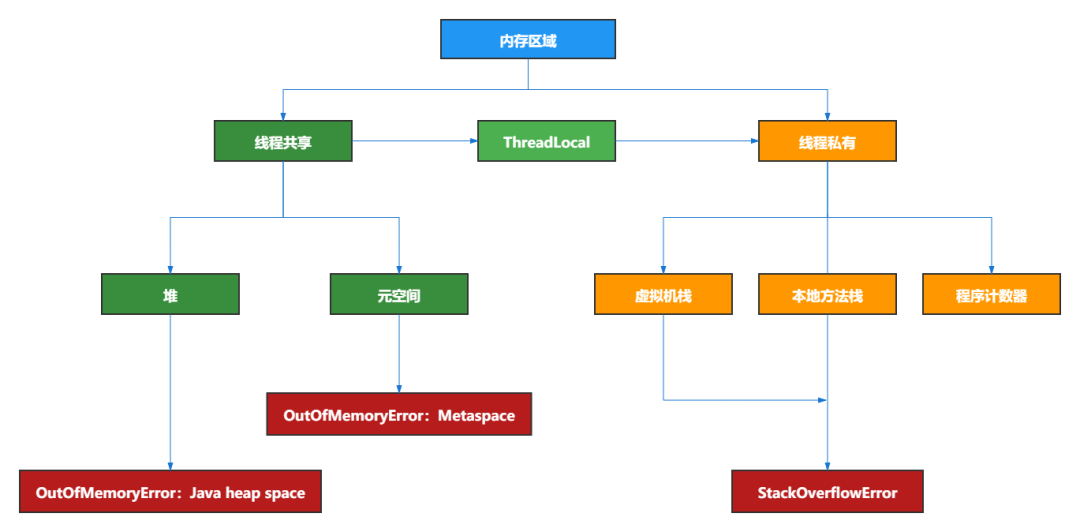
JVM memory layout detailed, illustrated, well written!
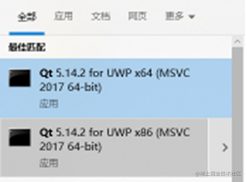
Qt如何实现打包,实现EXE分享
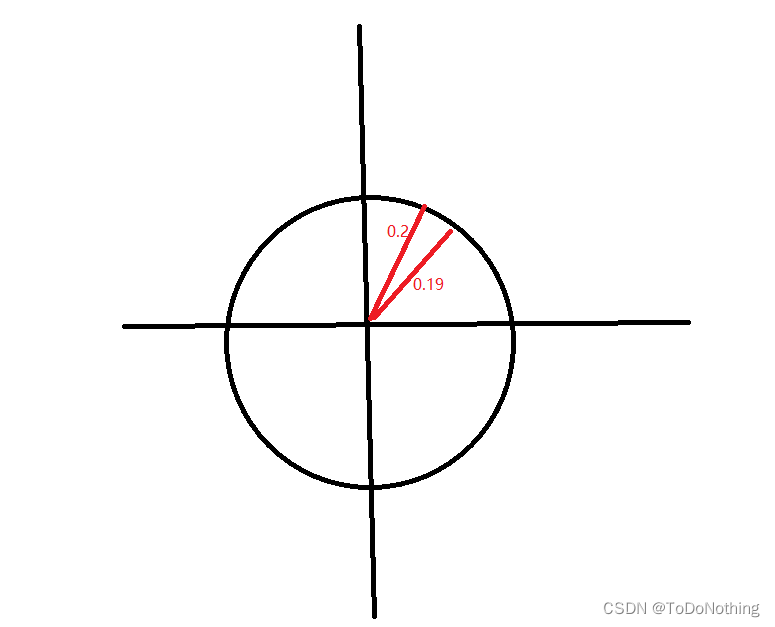
Unity Shader学习(三)试着绘制一个圆

按照功能对Boost库进行分类
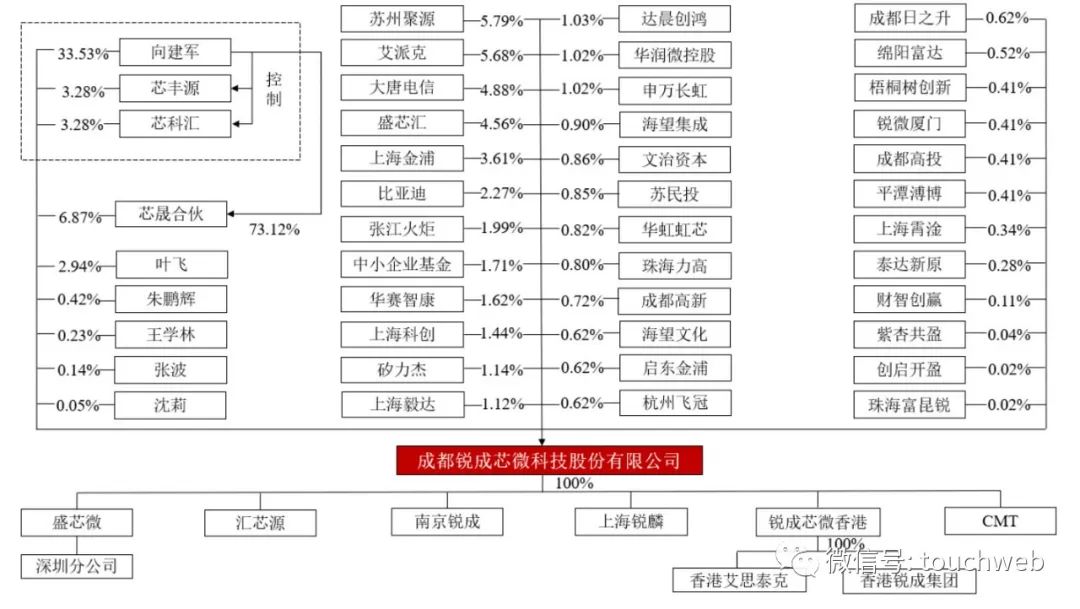
Ruichengxin micro sprint technology innovation board: annual revenue of 367million, proposed to raise 1.3 billion, Datang Telecom is a shareholder
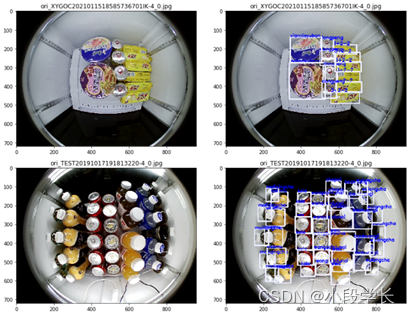
Product identification of intelligent retail cabinet based on paddlex
随机推荐
按照功能对Boost库进行分类
The font of markdown grammar is marked in red
Haobo medical sprint technology innovation board: annual revenue of 260million Yonggang and Shen Zhiqun are the actual controllers
Fs4059c is a 5V input boost charging 12.6v1.2a. Inputting a small current to three lithium battery charging chips will not pull it dead. The temperature is 60 ° and 1000-1100ma is recommended
Unity Shader学习(三)试着绘制一个圆
1200. Minimum absolute difference
xshell/bash/zsh 等终端鼠标滚轮乱码问题(转)
markdown 语法之字体标红
Ws2811 m is a special circuit for three channel LED drive and control, and the development of color light strip scheme
[antd step pit] antd form cooperates with input Form The height occupied by item is incorrect
海外游戏代投需要注意的
【C 题集】of Ⅶ
TestSuite and testrunner in unittest
Code hoof collection of wonderful secret place
基于51单片机的超声波测距仪
为什么图片传输要使用base64编码
安装Mysql
sql优化之查询优化器
Hardware Basics - diode Basics
学内核之三:使用GDB跟踪内核调用链