当前位置:网站首页>Matplotlib绘制三维图形
Matplotlib绘制三维图形
2022-07-07 15:38:00 【En^_^Joy】
用Matplotlib画三维图
画三维图需要mplot3d模块,在创建任意一个普通坐标轴的过程中加入projection='3d'关键字,从而创建三维坐标轴
import matplotlib.pyplot as plt
from mpl_toolkits import mplot3d
import numpy as np

fig = plt.figure()
ax = plt.axes(projection='3d')

# 画图代码

# 显示图片
plt.show()
后序代码将这些代码省略了,将后面的代码套入画图代码里面即可
三维数据点与线
用ax.plot3D与ax.scatter3D来创建三维坐标的线图与散点图,三维函数的参数与二维函数的参数基本相同
# 三维线的数据
zline = np.linspace(0, 15, 1000)
xline = np.sin(zline)
yline = np.cos(zline)
ax.plot3D(xline, yline, zline, 'gray')

# 三维散点的数据
zdata = 15*np.random.random(100)
xdata = np.sin(zdata)+0.1*np.random.randn(100)
ydata = np.cos(zdata)+0.1*np.random.randn(100)
ax.scatter3D(xdata, ydata, zdata, c=zdata, cmap='Greens')
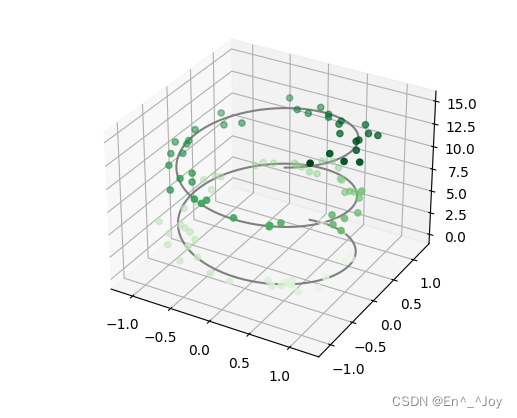
默认情况,散点会自动改变透明度,以在平面上呈现出立体感
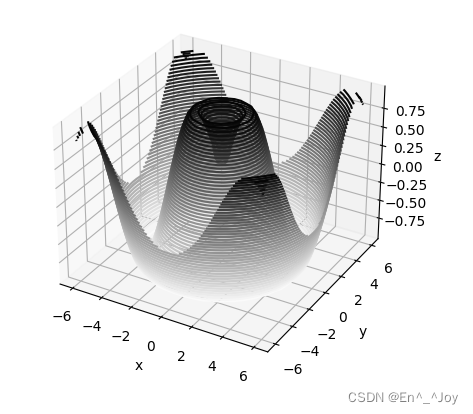
三维等高线图
ax.contour3D要求所有数据都是二维网格数据的格式,由函数计算z轴数值
def f(x, y):
    return np.sin(np.sqrt(x**2 + y**2))

x = np.linspace(-6, 6, 30)
y = np.linspace(-6, 6, 30)

X, Y = np.meshgrid(x, y)
Z = f(X, Y)

ax.contour3D(X, Y, Z, 50, cmap='binary')
ax.set_xlabel('x')
ax.set_ylabel('y')
ax.set_zlabel('z')
view_init可以调整观察角度和方位角,在这个例子中,将俯仰角调整为60度,方位角调整为35度,在上面的代码基础上加上下面这行代码:
ax.view_init(60, 35)
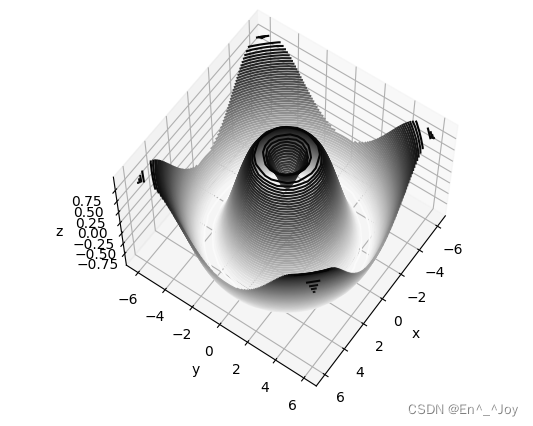
也可以在图中点击拖拽图形装换角度
线框图和曲面图
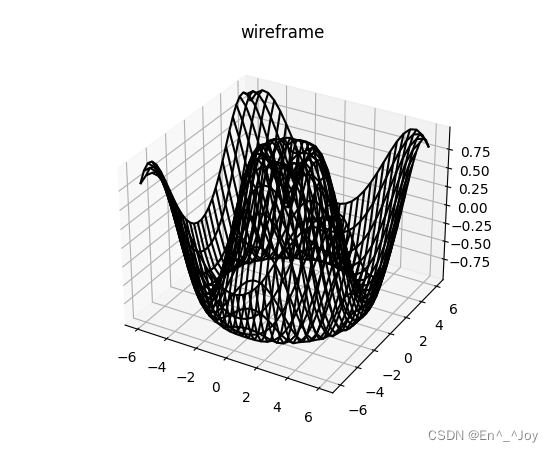
ax.plot_wireframe绘制线框图
def f(x, y):
    return np.sin(np.sqrt(x**2 + y**2))

x = np.linspace(-6, 6, 30)
y = np.linspace(-6, 6, 30)

X, Y = np.meshgrid(x, y)
Z = f(X, Y)

ax.plot_wireframe(X, Y, Z, color='black')
ax.set_title('wireframe')
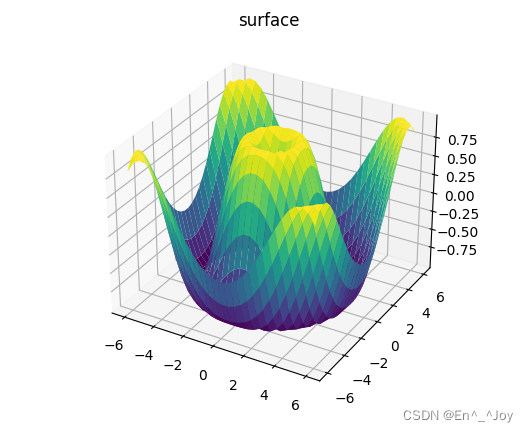
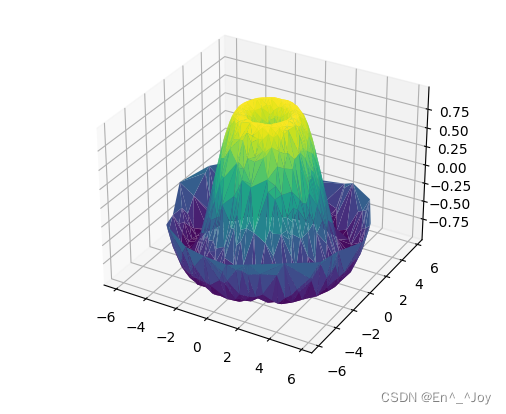
ax.plot_surface绘制曲面图
def f(x, y):
    return np.sin(np.sqrt(x**2 + y**2))

x = np.linspace(-6, 6, 30)
y = np.linspace(-6, 6, 30)

X, Y = np.meshgrid(x, y)
Z = f(X, Y)

ax.plot_surface(X, Y, Z, rstride=1, cstride=1, cmap='viridis', edgecolor='none')
ax.set_title('surface')
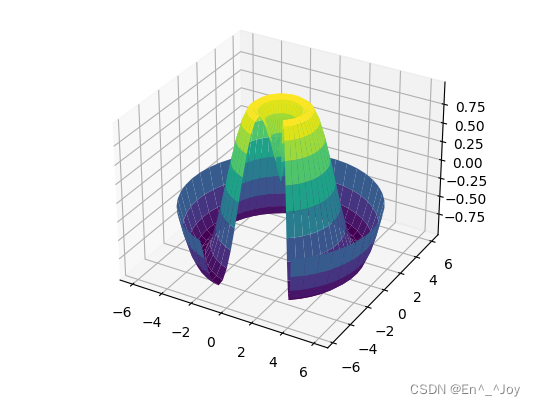
画曲面图的二维数据可以是直角坐标系数据,也可以是极坐标数据,下面是极坐标数据创建的图
def f(x, y):
    return np.sin(np.sqrt(x**2 + y**2))

r = np.linspace(0, 6, 20)
theta = np.linspace(-0.9*np.pi, 0.8*np.pi, 40)
r, theta = np.meshgrid(r, theta)

X = r * np.sin(theta)
Y = r * np.cos(theta)
Z = f(X, Y)

ax.plot_surface(X, Y, Z, rstride=1, cstride=1, cmap='viridis', edgecolor='none')
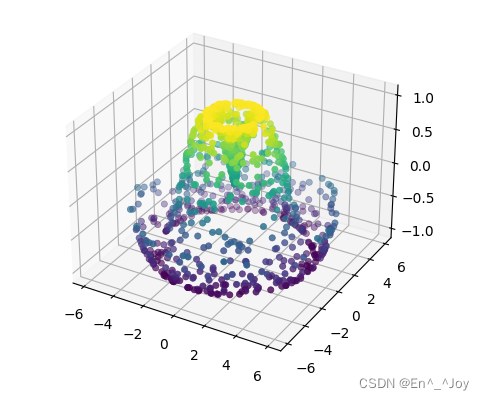
曲面三角剖分
上面哪些要求均匀采样的网格数据显得太过严谨,不容易实现,如果没有笛卡尔或极坐标网格的均匀绘图,可以使用三角剖分图形
ax.scatter绘制三维采样的曲面图
def f(x, y):
    return np.sin(np.sqrt(x**2 + y**2))

r = 6*np.random.random(1000)
theta = 2*np.pi*np.random.random(1000)

X = np.ravel(r * np.sin(theta))
Y = np.ravel(r * np.cos(theta))
Z = f(X, Y)

ax.scatter(X, Y, Z, c=Z, cmap='viridis', linewidth=0.5)
这图还有很多地方需要修补,可以由ax.plot_trisurf函数来完成,它首先找到一组所有点都连接起来的三角形,然后用这三角形创建曲面
def f(x, y):
    return np.sin(np.sqrt(x**2 + y**2))

r = 6*np.random.random(1000)
theta = 2*np.pi*np.random.random(1000)

X = np.ravel(r * np.sin(theta))
Y = np.ravel(r * np.cos(theta))
Z = f(X, Y)

ax.plot_trisurf(X, Y, Z, cmap='viridis', edgecolor='none')
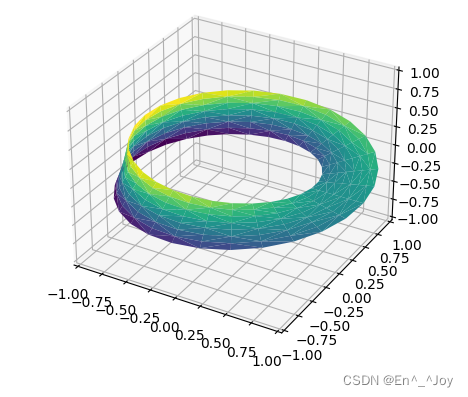
可以用该方法画莫比乌斯带
theta = np.linspace(0, 2*np.pi, 30)
w = np.linspace(-0.25, 0.25, 8)
w, theta = np.meshgrid(w, theta)

phi = 0.5*theta

# x-y平面内的半径
r = 1+w*np.cos(phi)

x = np.ravel(r*np.cos(theta))
y = np.ravel(r*np.sin(theta))
z = np.ravel(w*np.sin(phi))

# 用基本参数化方法定义三角剖分
from matplotlib.tri import Triangulation
tri = Triangulation(np.ravel(w), np.ravel(theta))

ax.plot_trisurf(x, y, z, triangles=tri.triangles, cmap='viridis', linewidths=0.2)

ax.set_xlim(-1,1)
ax.set_ylim(-1,1)
ax.set_zlim(-1,1)
边栏推荐
- SlashData开发者工具榜首等你而定!!!
- Jenkins发布uniapp开发的H5遇到的问题
- LeetCode 1774. The dessert cost closest to the target price is one question per day
- AI来搞财富分配比人更公平?来自DeepMind的多人博弈游戏研究
- Seaborn数据可视化
- LeetCode 1696. Jumping game VI daily question
- QT 图片背景色像素处理法
- LeetCode 1043. 分隔数组以得到最大和 每日一题
- Flask build API service SQL configuration file
- Localstorage and sessionstorage
猜你喜欢
Nerf: the ultimate replacement for deepfake?
Shallow understanding Net core routing
Skimage learning (3) -- gamma and log contrast adjustment, histogram equalization, coloring gray images
掌握这套精编Android高级面试题解析,oppoAndroid面试题
《产品经理必读:五种经典的创新思维模型》的读后感
How to add aplayer music player in blog
【图像传感器】相关双采样CDS

应用在温度检测仪中的温度传感芯片

Sator launched Web3 game "satorspace" and launched hoobi
Temperature sensor chip used in temperature detector
随机推荐
Master this promotion path and share interview materials
编程模式-表驱动编程
LeetCode 1981. 最小化目标值与所选元素的差 每日一题
PLC:自动纠正数据集噪声,来洗洗数据集吧 | ICLR 2021 Spotlight
【黄啊码】为什么我建议您选择go,而不选择php?
掌握这套精编Android高级面试题解析,oppoAndroid面试题
Shallow understanding Net core routing
Pycharm IDE下载
typescript ts基础知识之tsconfig.json配置选项
LeetCode-SQL第一天
Skimage learning (3) -- adapt the gray filter to RGB images, separate colors by immunohistochemical staining, and filter the maximum value of the region
LeetCode 1031. Maximum sum of two non overlapping subarrays
掌握这个提升路径,面试资料分享
Flask build API service SQL configuration file
【Seaborn】组合图表:PairPlot和JointPlot
智慧物流平台:让海外仓更聪明
LeetCode 213. 打家劫舍 II 每日一题
Arduino 控制的双足机器人
Sator launched Web3 game "satorspace" and launched hoobi
Notes on installing MySQL in centos7