当前位置:网站首页>Day 2 document
Day 2 document
2022-07-05 06:19:00 【SyncStudy】
Day 2 document
influxdata
https://www.influxdata.com/

Result Shuffle
based on the rand()
done
Lesson
- step by step updates
Update the domain on one sec based manner
import datetime

import dash
from dash import dcc, html
import plotly
from dash.dependencies import Input, Output
import datetime
import random
import dash_table

import pandas as pd

total_power_df = pd.DataFrame(columns=["Total Power"], index=pd.DatetimeIndex([]))
def random_data_df():
    total_power_df.loc[datetime.datetime.now()] = random.randint(0, 200)
    return total_power_df


# pip install pyorbital
from pyorbital.orbital import Orbital
satellite = Orbital('TERRA')

external_stylesheets = ['https://codepen.io/chriddyp/pen/bWLwgP.css']

app = dash.Dash(__name__, external_stylesheets=external_stylesheets)
app.layout = html.Div(
    html.Div([
        html.H4('TERRA Satellite Live Feed'),
        html.Div(id='live-update-text'),
        dcc.Graph(id='live-update-graph'),
        dash_table.DataTable(total_power_df.to_dict('records'), [{"name": i, "id": i} for i in total_power_df.columns]),
        dcc.Interval(
            id='interval-component',
            interval=1*1000, # in milliseconds
            n_intervals=0
        )
    ])
)


@app.callback(Output('live-update-text', 'children'),
              Input('interval-component', 'n_intervals'))
def update_metrics(n):
    lon, lat, alt = satellite.get_lonlatalt(datetime.datetime.now())
    random_data_df()
    style = {'padding': '5px', 'fontSize': '16px'}
    return [
        html.Span('Longitude: {0:.2f}'.format(lon), style=style),
        html.Span('Latitude: {0:.2f}'.format(lat), style=style),
        html.Span('Altitude: {0:0.2f}'.format(alt), style=style)
    ]


# Multiple components can update everytime interval gets fired.
@app.callback(Output('live-update-graph', 'figure'),
              Input('interval-component', 'n_intervals'))
def update_graph_live(n):
    satellite = Orbital('TERRA')
    data = {
        'time': [],
        'Latitude': [],
        'Longitude': [],
        'Altitude': []
    }

    # Collect some data
    for i in range(180):
        time = datetime.datetime.now() - datetime.timedelta(seconds=i*20)
        lon, lat, alt = satellite.get_lonlatalt(
            time
        )
        data['Longitude'].append(lon)
        data['Latitude'].append(lat)
        data['Altitude'].append(alt)
        data['time'].append(time)

    # Create the graph with subplots
    fig = plotly.tools.make_subplots(rows=2, cols=1, vertical_spacing=0.2)
    fig['layout']['margin'] = {
        'l': 30, 'r': 10, 'b': 30, 't': 10
    }
    fig['layout']['legend'] = {'x': 0, 'y': 1, 'xanchor': 'left'}

    fig.append_trace({
        'x': data['time'],
        'y': data['Altitude'],
        'name': 'Altitude',
        'mode': 'lines+markers',
        'type': 'scatter'
    }, 1, 1)
    fig.append_trace({
        'x': data['Longitude'],
        'y': data['Latitude'],
        'text': data['time'],
        'name': 'Longitude vs Latitude',
        'mode': 'lines+markers',
        'type': 'scatter'
    }, 2, 1)

    return fig


if __name__ == '__main__':
    app.run_server(debug=True)
While approach
from dash import Dash, dcc, html, Input, Output, dash_table, callback
import dash_html_components as html
import dash_core_components as dcc
import numpy as np
import datetime
import random
from time import time, sleep

import pandas as pd
from dash.dependencies import Input, Output
import time
total_power_df = pd.DataFrame(columns=["Total Power"], index=pd.DatetimeIndex([]))
def random_data_df():
    total_power_df.loc[datetime.datetime.now()] = random.randint(0, 200)
    return total_power_df
t_end = time.time() + 2
while time.time() < t_end:
    sleep(1)
    random_data_df()
    app = Dash(__name__)

    app.layout = html.Div([
        html.H6("Change the value in the text box to see callbacks in action!"),
        dash_table.DataTable(total_power_df.to_dict('records'), [{"name": i, "id": i} for i in total_power_df.columns]),

    ])

if __name__ == '__main__':
    app.run_server(debug=True)
    # do whatever you do
Auto update
import datetime
import datetime
import random
import dash
from dash import dcc, html,dash_table
import plotly
import pandas as pd

total_power_df = pd.DataFrame(columns=["Total Power"], index=pd.DatetimeIndex([]))
from dash.dependencies import Input, Output

# pip install pyorbital
from pyorbital.orbital import Orbital
satellite = Orbital('TERRA')
def random_data_df():
    total_power_df.loc[datetime.datetime.now()] = random.randint(0, 200)
    return total_power_df
external_stylesheets = ['https://codepen.io/chriddyp/pen/bWLwgP.css']

app = dash.Dash(__name__, external_stylesheets=external_stylesheets)
app.layout = html.Div(
    html.Div([
        html.H4('Total Power'),
        html.Div(id='live-update-text'),
        dcc.Interval(
            id='interval-component',
            interval=1*1000, # in milliseconds
            n_intervals=0
        )
    ])
)


@app.callback(Output('live-update-text', 'children'),
              Input('interval-component', 'n_intervals'))
def update_metrics(n):
    lon, lat, alt = satellite.get_lonlatalt(datetime.datetime.now())
    random_data_df()
    style = {'padding': '5px', 'fontSize': '16px'}
    return [
        total_power_df["Total Power"].iloc[-1]
    ]


# Multiple components can update everytime interval gets fired.
@app.callback(Output('live-update-graph', 'figure'),
              Input('interval-component', 'n_intervals'))
def update_graph_live(n):
    satellite = Orbital('TERRA')
    data = {
        'time': [],
        'Latitude': [],
        'Longitude': [],
        'Altitude': []
    }

    # Collect some data
    for i in range(180):
        time = datetime.datetime.now() - datetime.timedelta(seconds=i*20)
        lon, lat, alt = satellite.get_lonlatalt(
            time
        )
        data['Longitude'].append(lon)
        data['Latitude'].append(lat)
        data['Altitude'].append(alt)
        data['time'].append(time)

    # Create the graph with subplots
    fig = plotly.tools.make_subplots(rows=2, cols=1, vertical_spacing=0.2)
    fig['layout']['margin'] = {
        'l': 30, 'r': 10, 'b': 30, 't': 10
    }
    fig['layout']['legend'] = {'x': 0, 'y': 1, 'xanchor': 'left'}

    fig.append_trace({
        'x': data['time'],
        'y': data['Altitude'],
        'name': 'Altitude',
        'mode': 'lines+markers',
        'type': 'scatter'
    }, 1, 1)
    fig.append_trace({
        'x': data['Longitude'],
        'y': data['Latitude'],
        'text': data['time'],
        'name': 'Longitude vs Latitude',
        'mode': 'lines+markers',
        'type': 'scatter'
    }, 2, 1)


if __name__ == '__main__':
    app.run_server(debug=True)

Second based updated table
Put the shuffled data
- done
Put the data in the table header
- MANUFACTURING SPC DASHBOARD - PROCESS CONTROL AND EXCEPTION REPORTING
what to write here?

边栏推荐
猜你喜欢
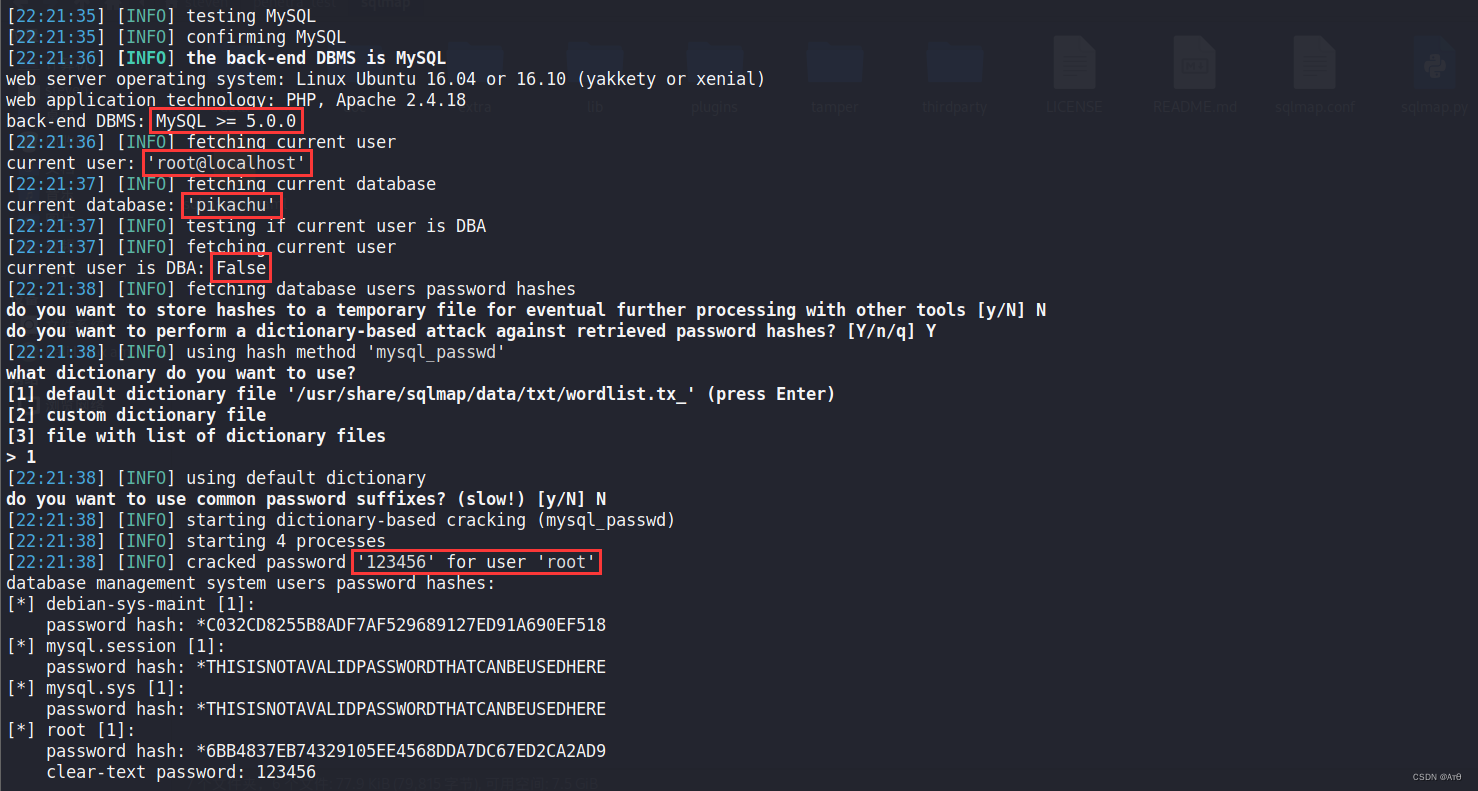
SQLMAP使用教程(二)实战技巧一
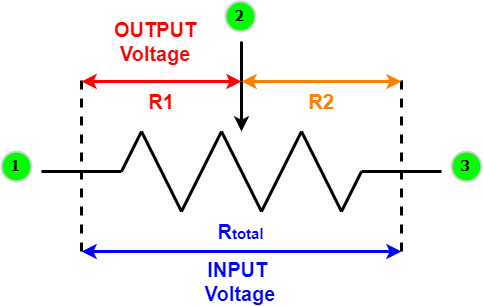
Overview of variable resistors - structure, operation and different applications

阿里新成员「瓴羊」正式亮相,由阿里副总裁朋新宇带队,集结多个核心部门技术团队
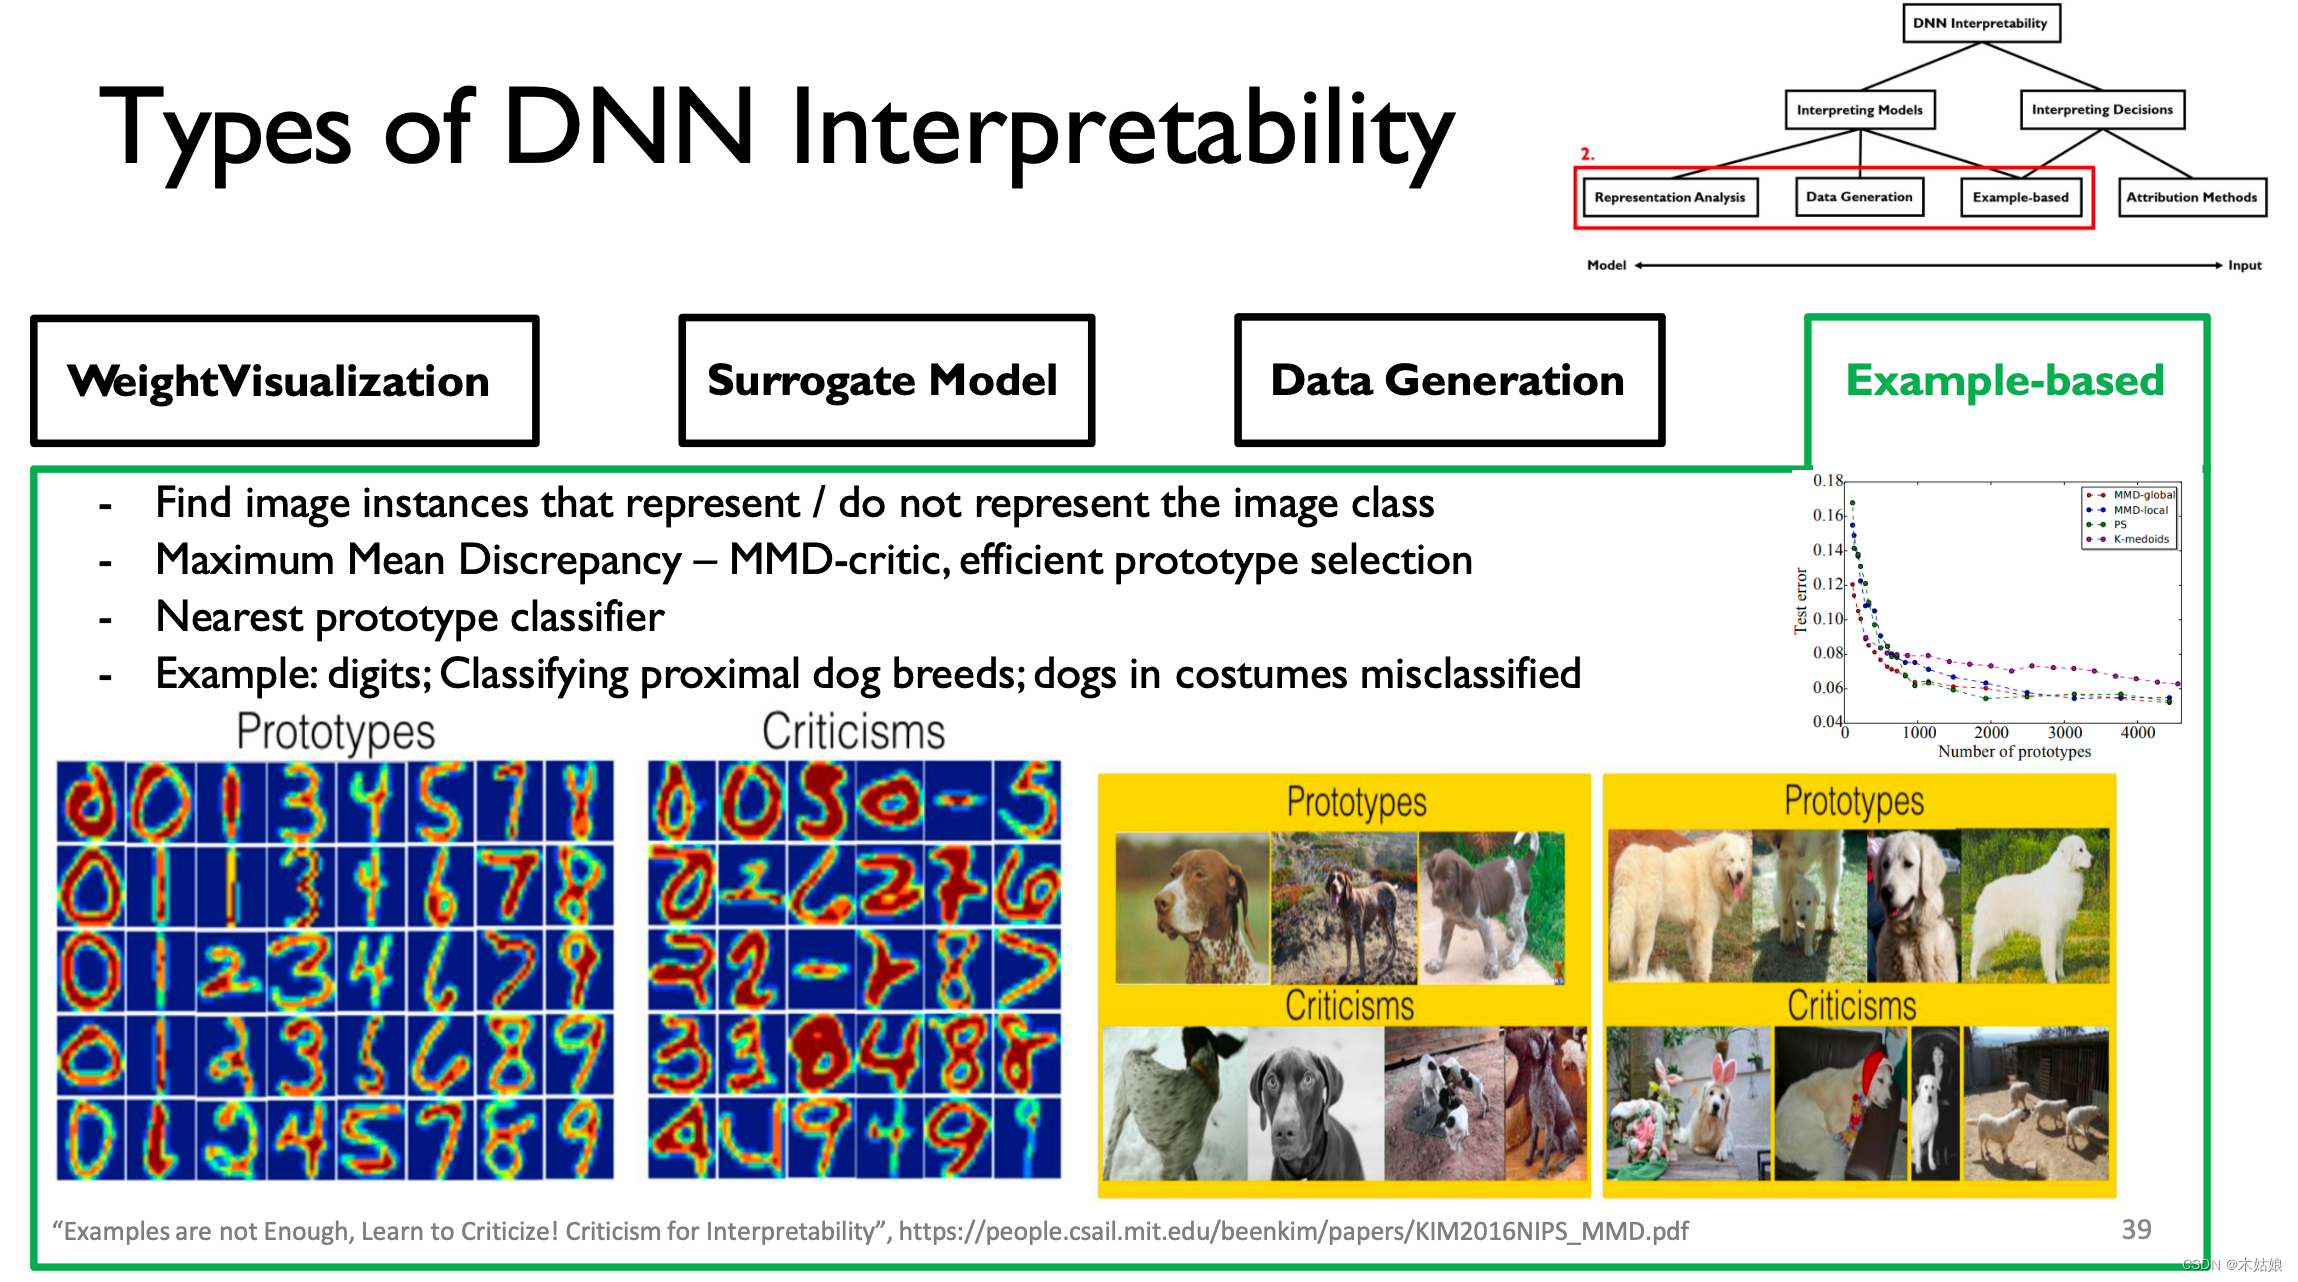
MIT-6874-Deep Learning in the Life Sciences Week 7

Simple selection sort of selection sort

SQLMAP使用教程(一)

Single chip computer engineering experience - layered idea
Arduino 控制的 RGB LED 无限镜
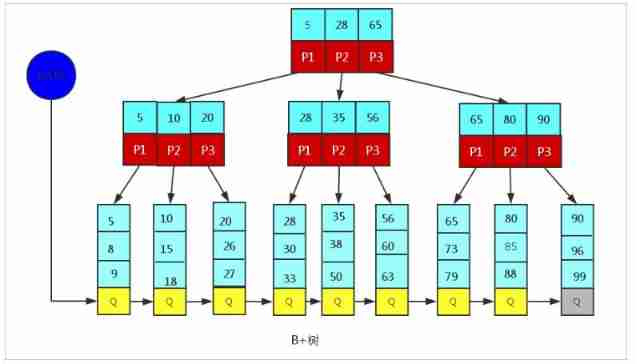
MySQL advanced part 1: index

Chapter 6 relational database theory
随机推荐
【Rust 笔记】15-字符串与文本(下)
Operator priority, one catch, no doubt
Introduction to LVS [unfinished (semi-finished products)]
数据可视化图表总结(一)
C - XOR to all (binary topic)
What's wrong with this paragraph that doesn't work? (unresolved)
C job interview - casting and comparing - C job interview - casting and comparing
Presentation of attribute value of an item
Data visualization chart summary (I)
SPI details
Golang uses context gracefully
Real time clock (RTC)
MIT-6874-Deep Learning in the Life Sciences Week 7
LaMDA 不可能觉醒吗?
高斯消元 AcWing 884. 高斯消元解异或線性方程組
什么是套接字?Socket基本介绍
C Primer Plus Chapter 15 (bit operation)
redis发布订阅命令行实现
Appium基础 — 使用Appium的第一个Demo
1039 Course List for Student