当前位置:网站首页>其实特简单,教你轻松实现酷炫的数据可视化大屏
其实特简单,教你轻松实现酷炫的数据可视化大屏
2022-07-07 06:45:00 【Python数据挖掘】
大家好,今天给大家分享一个 Python 可视化大屏项目,GitHub 地址:https://github.com/TurboWay/big_screen,
该项目结构简单使用方便,直接传数据就可以实现数据可视化大屏。喜欢记得收藏、关注、点赞。
注:文末提供技术交流、源码获取方式
安装
项目依赖第三方模块 flask,因此我们需要先进行依赖安装,安装命令:pip install -i https://pypi.tuna.tsinghua.edu.cn/simple flask。
部分源码分享
#!/usr/bin/env python3
# -*- coding: utf-8 -*-
# @Author : way
# @Site :
# @Describe:

import json

class SourceDataDemo:

    def __init__(self):
        self.title = '大数据可视化展板通用模板'
        self.counter = {
    'name': '2018年总收入情况', 'value': 12581189}
        self.counter2 = {
    'name': '2018年总支出情况', 'value': 3912410}
        self.echart1_data = {

            'title': '行业分布',
            'data': [
                {
    "name": "商超门店", "value": 47},
                {
    "name": "教育培训", "value": 52},
                {
    "name": "房地产", "value": 90},
                {
    "name": "生活服务", "value": 84},
                {
    "name": "汽车销售", "value": 99},
                {
    "name": "旅游酒店", "value": 37},
                {
    "name": "五金建材", "value": 2},
            ]
        }
        self.echart2_data = {

            'title': '省份分布',
            'data': [
                {
    "name": "浙江", "value": 47},
                {
    "name": "上海", "value": 52},
                {
    "name": "江苏", "value": 90},
                {
    "name": "广东", "value": 84},
                {
    "name": "北京", "value": 99},
                {
    "name": "深圳", "value": 37},
                {
    "name": "安徽", "value": 150},
            ]
        }
        self.echarts3_1_data = {

            'title': '年龄分布',
            'data': [
                {
    "name": "0岁以下", "value": 47},
                {
    "name": "20-29岁", "value": 52},
                {
    "name": "30-39岁", "value": 90},
                {
    "name": "40-49岁", "value": 84},
                {
    "name": "50岁以上", "value": 99},
            ]
        }
        self.echarts3_2_data = {

            'title': '职业分布',
            'data': [
                {
    "name": "电子商务", "value": 10},
                {
    "name": "教育", "value": 20},
                {
    "name": "IT/互联网", "value": 20},
                {
    "name": "金融", "value": 30},
                {
    "name": "学生", "value": 40},
                {
    "name": "其他", "value": 50},
            ]
        }
        self.echarts3_3_data = {

            'title': '兴趣分布',
            'data': [
                {
    "name": "汽车", "value": 4},
                {
    "name": "旅游", "value": 5},
                {
    "name": "财经", "value": 9},
                {
    "name": "教育", "value": 8},
                {
    "name": "软件", "value": 9},
                {
    "name": "其他", "value": 9},
            ]
        }
        self.echart4_data = {

            'title': '时间趋势',
            'data': [
                {
    "name": "安卓", "value": [3, 4, 3, 4, 3, 4, 3, 6, 2, 4, 2, 4, 3, 4, 3, 4, 3, 4, 3, 6, 2, 4, 4]},
                {
    "name": "IOS", "value": [5, 3, 5, 6, 1, 5, 3, 5, 6, 4, 6, 4, 8, 3, 5, 6, 1, 5, 3, 7, 2, 5, 8]},
            ],
            'xAxis': ['01', '02', '03', '04', '05', '06', '07', '08', '09', '11', '12', '13', '14', '15', '16', '17',
                      '18', '19', '20', '21', '22', '23', '24'],
        }
        self.echart5_data = {

            'title': '省份TOP',
            'data': [
                {
    "name": "浙江", "value": 2},
                {
    "name": "上海", "value": 3},
                {
    "name": "江苏", "value": 3},
                {
    "name": "广东", "value": 9},
                {
    "name": "北京", "value": 15},
                {
    "name": "深圳", "value": 18},
                {
    "name": "安徽", "value": 20},
                {
    "name": "四川", "value": 13},
            ]
        }
        self.echart6_data = {

            'title': '一线城市情况',
            'data': [
                {
    "name": "浙江", "value": 80, "value2": 20, "color": "01", "radius": ['59%', '70%']},
                {
    "name": "上海", "value": 70, "value2": 30, "color": "02", "radius": ['49%', '60%']},
                {
    "name": "广东", "value": 65, "value2": 35, "color": "03", "radius": ['39%', '50%']},
                {
    "name": "北京", "value": 60, "value2": 40, "color": "04", "radius": ['29%', '40%']},
                {
    "name": "深圳", "value": 50, "value2": 50, "color": "05", "radius": ['20%', '30%']},
            ]
        }
        self.map_1_data = {

            'symbolSize': 100,
            'data': [
                {
    'name': '海门', 'value': 239},
                {
    'name': '鄂尔多斯', 'value': 231},
                {
    'name': '招远', 'value': 203},
            ]
        }

    @property
    def echart1(self):
        data = self.echart1_data
        echart = {

            'title': data.get('title'),
            'xAxis': [i.get("name") for i in data.get('data')],
            'series': [i.get("value") for i in data.get('data')]
        }
        return echart

    @property
    def echart2(self):
        data = self.echart2_data
        echart = {

            'title': data.get('title'),
            'xAxis': [i.get("name") for i in data.get('data')],
            'series': [i.get("value") for i in data.get('data')]
        }
        return echart

    @property
    def echarts3_1(self):
        data = self.echarts3_1_data
        echart = {

            'title': data.get('title'),
            'xAxis': [i.get("name") for i in data.get('data')],
            'data': data.get('data'),
        }
        return echart

    @property
    def echarts3_2(self):
        data = self.echarts3_2_data
        echart = {

            'title': data.get('title'),
            'xAxis': [i.get("name") for i in data.get('data')],
            'data': data.get('data'),
        }
        return echart

    @property
    def echarts3_3(self):
        data = self.echarts3_3_data
        echart = {

            'title': data.get('title'),
            'xAxis': [i.get("name") for i in data.get('data')],
            'data': data.get('data'),
        }
        return echart

    @property
    def echart4(self):
        data = self.echart4_data
        echart = {

            'title': data.get('title'),
            'names': [i.get("name") for i in data.get('data')],
            'xAxis': data.get('xAxis'),
            'data': data.get('data'),
        }
        return echart

    @property
    def echart5(self):
        data = self.echart5_data
        echart = {

            'title': data.get('title'),
            'xAxis': [i.get("name") for i in data.get('data')],
            'series': [i.get("value") for i in data.get('data')],
            'data': data.get('data'),
        }
        return echart

    @property
    def echart6(self):
        data = self.echart6_data
        echart = {

            'title': data.get('title'),
            'xAxis': [i.get("name") for i in data.get('data')],
            'data': data.get('data'),
        }
        return echart

    @property
    def map_1(self):
        data = self.map_1_data
        echart = {

            'symbolSize': data.get('symbolSize'),
            'data': data.get('data'),
        }
        return echart


class SourceData(SourceDataDemo):

    def __init__(self):
        """ 按照 SourceDataDemo 的格式覆盖数据即可 """
        super().__init__()
        self.title = '大数据可视化展板通用模板'

class CorpData(SourceDataDemo):

    def __init__(self):
        """ 按照 SourceDataDemo 的格式覆盖数据即可 """
        super().__init__()
        with open('corp.json', 'r', encoding='utf-8') as f:
            data = json.loads(f.read())
        self.title = data.get('title')
        self.counter = data.get('counter')
        self.counter2 = data.get('counter2')
        self.echart1_data = data.get('echart1_data')
        self.echart2_data = data.get('echart2_data')
        self.echarts3_1_data = data.get('echarts3_1_data')
        self.echarts3_2_data = data.get('echarts3_2_data')
        self.echarts3_3_data = data.get('echarts3_3_data')
        self.echart4_data = data.get('echart4_data')
        self.echart5_data = data.get('echart5_data')
        self.echart6_data = data.get('echart6_data')
        self.map_1_data = data.get('map_1_data')

class JobData(SourceDataDemo):

    def __init__(self):
        """ 按照 SourceDataDemo 的格式覆盖数据即可 """
        super().__init__()
        with open('job.json', 'r', encoding='utf-8') as f:
            data = json.loads(f.read())
        self.title = data.get('title')
        self.counter = data.get('counter')
        self.counter2 = data.get('counter2')
        self.echart1_data = data.get('echart1_data')
        self.echart2_data = data.get('echart2_data')
        self.echarts3_1_data = data.get('echarts3_1_data')
        self.echarts3_2_data = data.get('echarts3_2_data')
        self.echarts3_3_data = data.get('echarts3_3_data')
        self.echart4_data = data.get('echart4_data')
        self.echart5_data = data.get('echart5_data')
        self.echart6_data = data.get('echart6_data')
        self.map_1_data = data.get('map_1_data')
运行
首先,我们从 GitHub 上将项目下载到本地,当然也可以在公众号Python小二后台回复big_screen直接获取。
项目下载好后,我们进入项目根路径,如下所示:
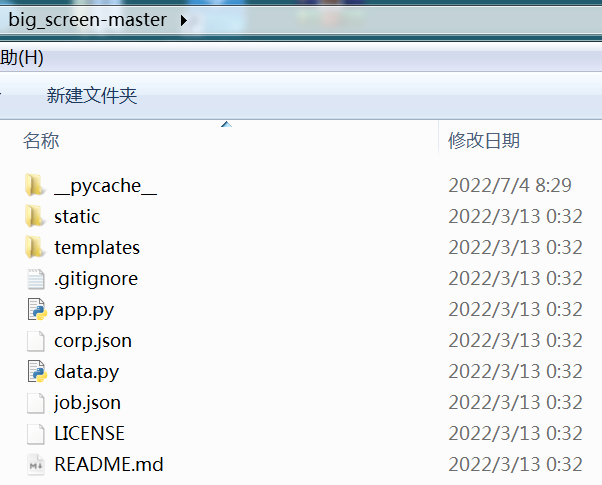
然后,按住Shift点鼠标右键,接着选择在此处打开命令窗口(W),命令窗口打开后输入命令:python app.py启动项目。
项目启动之后,我们直接在浏览器输入地址即可访问,下面看一下示例。
大数据可视化展板通用模板:http://127.0.0.1:5000,如下所示:
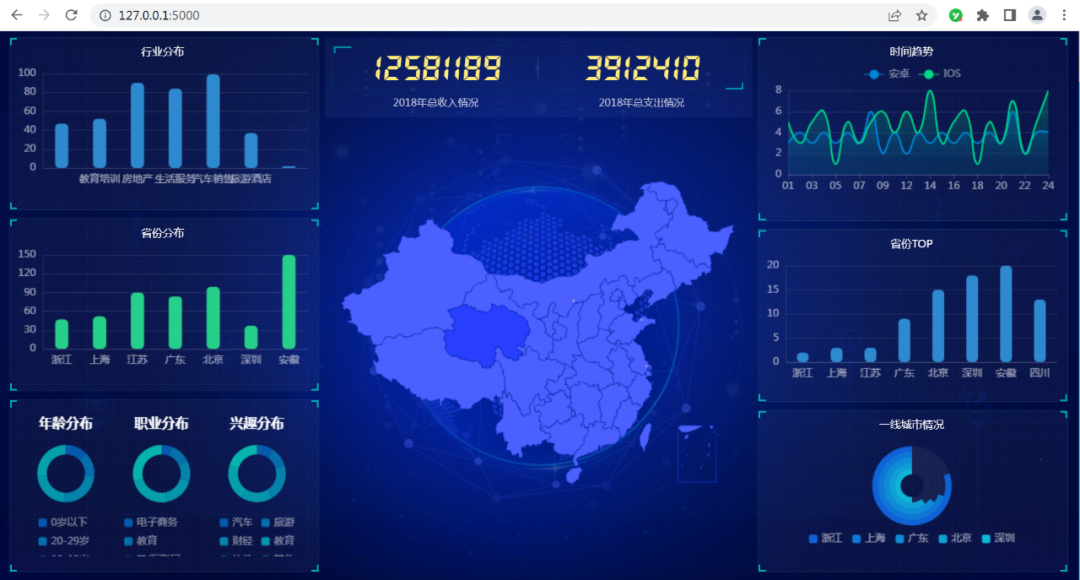
4600 万企业数据大屏可视化:http://127.0.0.1:5000/corp,如下所示:
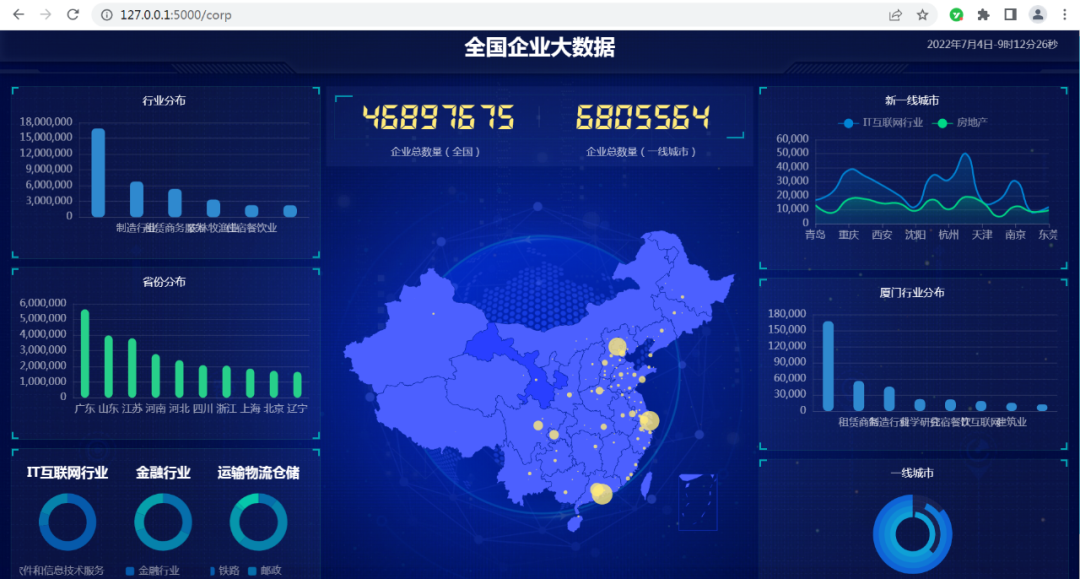
厦门 10 万招聘数据(2020-09)大屏可视化:http://127.0.0.1:5000/job,如下所示:
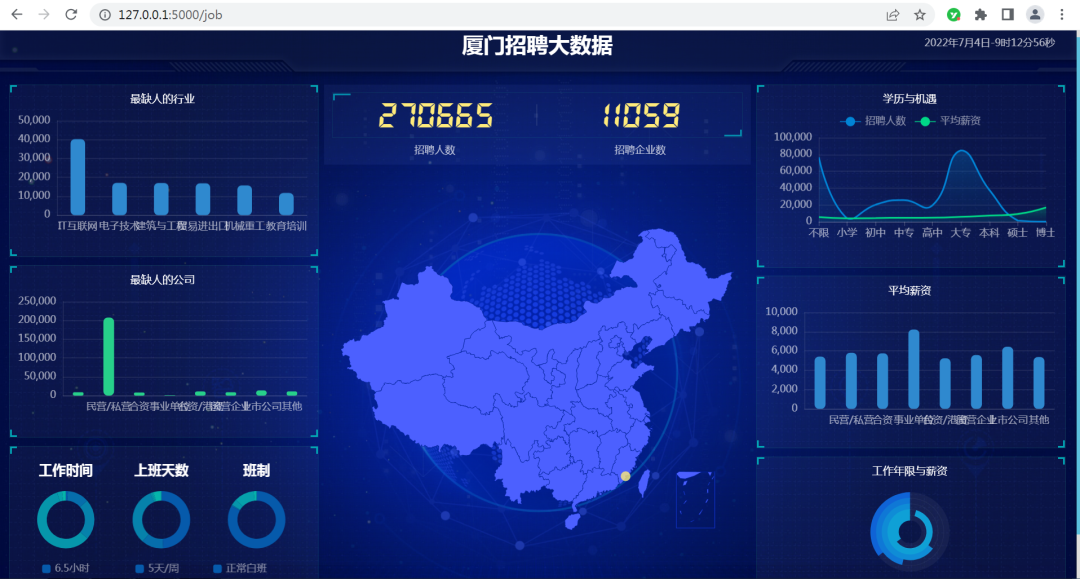
使用
编辑 data.py 中的 SourceData 类(或者新增类,新增的话需要编辑 app.py 增加路由,请参考 CorpData/JobData)
从任何地方读取你的数据,按照 SourceDataDemo 的数据格式,填充到 SourceData 类
运行 python app.py 查看数据变更后的效果
联系方式
目前开通了技术交流群,群友已超过3000人,添加时最好的备注方式为:来源+兴趣方向,方便找到志同道合的朋友,资料获取也可以加入
方式1、添加微信号:dkl88191,备注:来自CSDN
方式2、微信搜索公众号:Python学习与数据挖掘,后台回复:加群
边栏推荐
- PMP experience learning and sharing process
- liunx命令
- Leetcode question brushing record (array) combination sum, combination sum II
- 4、 Fundamentals of machine learning
- STM32 and motor development (from stand-alone version to Networking)
- Upgrade Alibaba cloud RDS (relational database service) instance to com mysql. jdbc. exceptions. Troubleshooting of jdbc4.communicationsexception
- Serializer & modelserializer of DRF serialization and deserialization
- (3/8)枚举的不当用法 之 方法参数(二)
- Confitest of fixture py
- Unittest simple project
猜你喜欢

嵌套(多级)childrn路由,query参数,命名路由,replace属性,路由的props配置,路由的params参数

2020 year end summary
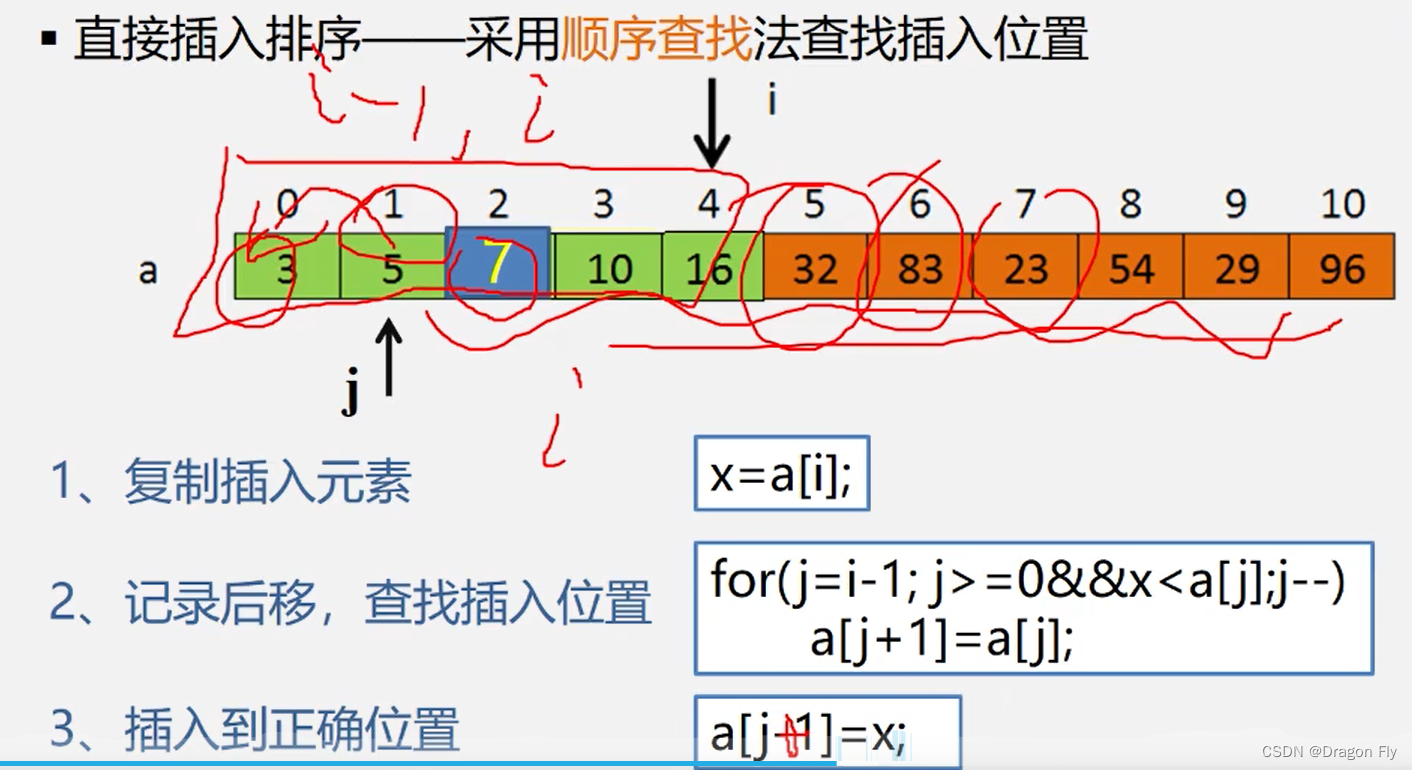
十二、排序

Kubernetes cluster capacity expansion to add node nodes
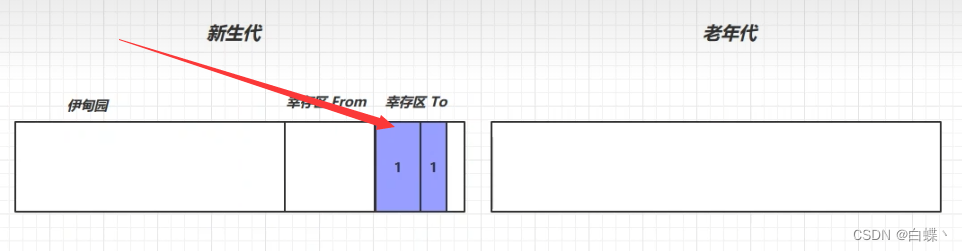
JVM garbage collection detailed learning notes (II)

Common short chain design methods
Detailed learning notes of JVM memory structure (I)
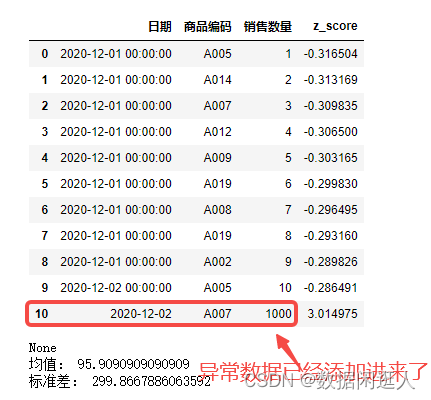
数据建模中利用3σ剔除异常值进行数据清洗
C language pointer (Part 2)
NATAPP内网穿透
随机推荐
How does the project manager write the weekly summary and weekly plan?
Unity shader (basic concept)
sqlplus乱码问题,求解答
JVM 内存结构 详细学习笔记(一)
十二、排序
C language pointer (exercises)
Cesium load vector data
信息安全实验二 :使用X-SCANNER扫描工具
What is the use of PMP certificate?
JWT certification used in DRF
Jenkins+ant+jmeter use
STM32 clock system
flinkcdc 用sqlclient可以指定mysqlbinlog id执行任务吗
liunx命令
Regular matching starts with XXX and ends with XXX
STM32 and motor development (from stand-alone version to Networking)
The use of recycling ideas
What are the conditions for applying for NPDP?
二叉树高频题型
C language pointer (Part 1)