Paper introduction :Negative-Aware Attention Framework for Image-Text Matching ( Image text matching based on negative perceived attention ,CVPR2022)
Code home page :https://github.com/CrossmodalGroup/NAAF
The main advantage :
1) Without adding any additional learning parameters , At base baseline SCAN Significant performance improvement on , achieve SOTA;
2) The model design is simple and effective , It only needs SCAN The text of - Images (Text-to-Image) One way calculation , It can greatly reduce the retrieval time of attention-based matching methods .
3) Explicit cross modal semantic alignment correlation and non correlation learning . Combine the optimal correlation to distinguish learning , Construct a joint optimization framework .

One 、 Preface
Image text matching task definition : Also known as Cross modal image text retrieval , That is, through a modal instance , Retrieve semantically relevant instances in another mode . for example , Given an image , Query the text corresponding to its semantics , vice versa . To be specific , For any input text - The image is right (Image-Text Pair), The purpose of image text matching is to measure the semantic similarity between image and text .
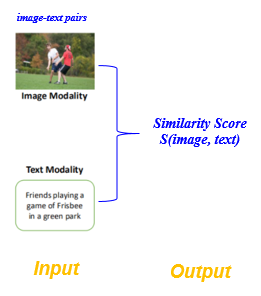
chart 1 Input and output of graphic matching
Core challenges : Image text cross modal semantic association is dedicated to Bridge the semantic gap between visual modality and language modality , The aim is to achieve heterogeneous modes ( Image composed of low-level pixels and text represented by high-level semantic vectors ) Accurate semantic alignment between , That is, mining and building images and texts Cross modal semantic consistency correlates correspondence .
Analysis of current situation : The existing image text image text matching work can be roughly divided into two categories :1) Global Association : Take the whole text and image as objects to learn semantic association ;2) Local correlation : Take fine-grained image salient areas and text words as objects to learn semantic association . The early work belongs to global correlation , That is, the whole image and text are mapped to a potential common subspace through the corresponding deep learning network , In this space, the similarity of cross modal semantic association between image and text can be directly measured , And the similarity of the semantic matching pairs is greater than that of the other mismatched pairs . However , This global association paradigm ignores the local salient information of the image and the fine-grained interaction of local important words in the text , It hinders the further improvement of the accuracy of image text semantic association . therefore , Local association based on fine-grained image regions and text words has been widely concerned and developed , And quickly occupy the dominant advantage . For the existing image text cross modal semantic association paradigm , The core idea is to mine the alignment relationship between all image segments and text segments .
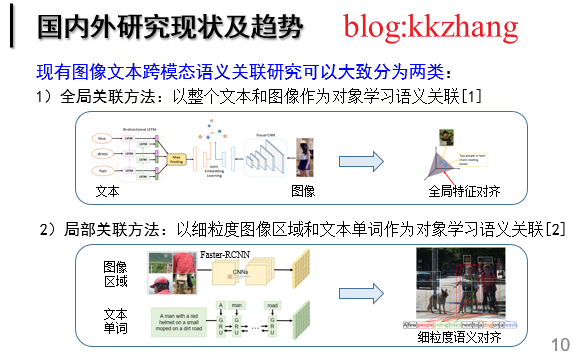
chart 2 Development status of image text matching
Cross attention network SCAN Capture all potential local alignments through the mutual attention mechanism between regions and words , And inspired a series of work . Cross modal cross attention aims to mine the alignment relationship between all image regions and text words , Infer the overall relevance through local semantic alignment . To benefit from For fine-grained modal information interaction , The method based on cross attention achieves significant performance improvement , It has become the mainstream paradigm of cross modal semantic association of image and text .
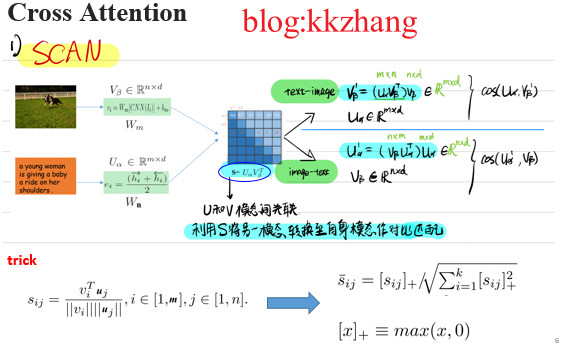
chart 3 Cross modal attention paradigm SCAN
motivation : Existing methods often obtain the alignment semantics between modes according to the association interaction . The purpose of this process is Maximize alignment semantic similarity in images and texts , And use this as a clue to calculate the degree of graphic matching . Concrete , In the process of modal interactive learning , Existing methods usually suppress the role of non aligned cues ( Through one ReLU Function to erase negative correlation scores ), The model mainly learns the positive effect of alignment semantics . However , They all ignore the image - Text alignment Rich non aligned clues for measuring Matching is also very important . Because when content that does not exist in the image appears in the text description ( Unaligned text word fragments ), So this Images - Text pairs just don't match . From this analysis, we can see , Unaligned text word fragments for measuring images - Text is also important for matching . The simplest idea is : We can fully exploit the negative effects of misaligned fragments , Make the original search in Top The wrong matching of positions reduces the similarity score , So as to retrieve the correct . As shown in the figure below :
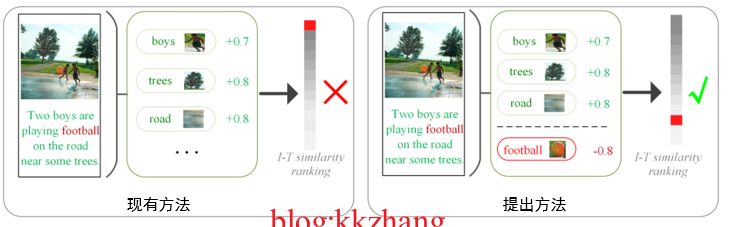
chart 4 Analysis of negative perceived attention motivation
Two 、 General framework
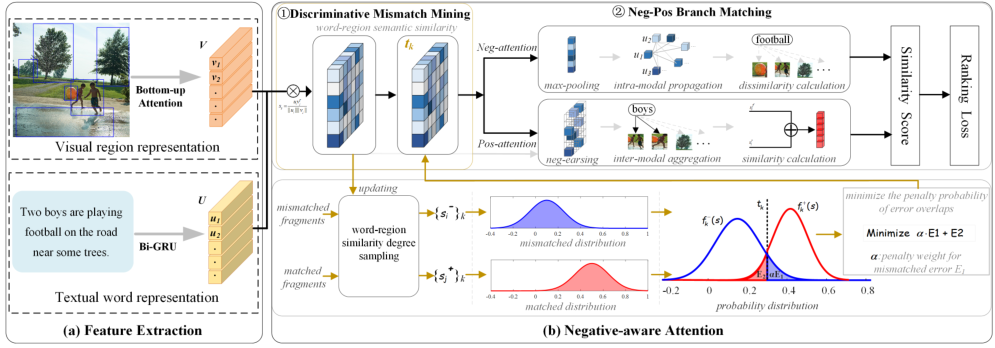
chart 5 The overall framework of negative perceived attention
Overview: The negative perception attention network consists of two main modules :1) Mismatch mining module : By modeling the similarity distribution of matched fragments and mismatched fragments , Then the optimal similarity discrimination threshold is solved by optimizing the minimum misclassification probability of the two distributions , So as to distinguish mismatched fragments as much as possible .2) Positive and negative double branch matching module : Through two different mask attention mechanisms , On the one hand, we should pay attention to the similarity of matching fragments , On the other hand, accurately calculate the dissimilarity of mismatched fragments , Using the positive effect of the former and the negative effect of the latter to measure the cross modal semantic association between image and text .
Bright spot :① The first one combines the positive and negative effects of matched and mismatched fragments , and Explicitly mining mismatched fragments The job of .② In the process of training Joint optimization framework : Forward optimization : Adaptively learn the optimal correlation threshold , Get better semantic alignment ; Backward optimization : Because the optimal threshold is involved in the attention calculation process , Therefore, in gradient back propagation optimization , It will promote the gradual separation of relevant and irrelevant similarity , So as to learn more distinctive image text feature embedding .
below , Introduce the specific implementation of the two modules :
1) Mismatch fragment mining module
In an image - Text pairs contain a large number of matching and mismatching fragments , We need to make full use of these two types of information to achieve more accurate retrieval performance . In the process of actual matching , Calculate the area - After the similarity score of word pairs , You need a boundary to decide whether it is a matching fragment or a mismatching fragment , Existing methods usually implicitly take a fixed value 0 As the boundary of distinction . In order to more accurately distinguish between matched fragments and mismatched fragments , We sample the similarity between the two , Then explicitly 、 Adaptively model the similarity distribution of the two , Then find an optimal boundary , Realize effective mining of mismatched fragments . Considering the lack of regions on the fragment level - A priori information about whether words match , And the image contains a large number of background areas , From the perspective of text , A sampling strategy is designed : For a matching text , Any word must find at least one matching area in its matching image , We regard a text word $u_{i}, i \in[1, m]$ All areas of the image that match it $\{v^{+}_{j}\}_{j=1}^{n}$ The matching segment with the highest similarity score , Then take samples :
\begin{eqnarray}
s^{+}_{i}=\underset{j}{\text{max}}(\{{v^{+}_{j} u_{i}^{\mathrm{T}}}/({\|v^{+}_{j}\|\|u_i\|})\}_{j=1}^{n}),\label{E13}
\end{eqnarray}
On the other hand , For a mismatched picture and text pair , The mismatched words in the text do not match all areas in the image , Words at this time $u_{i}, i \in[1, m]$ And all areas of the mismatched image $\{v^{-}_{j}\}_{j=1}^{n}$ The highest similarity score can represent the upper bound of the similarity of mismatched fragments , Thus sampling is made :
\begin{eqnarray}
s^{-}_{i}=\underset{j}{\text{max}}(\{{v^{-}_{j} u_{i}^{\mathrm{T}}}/({\|v^{-}_{j}\|\|u_i\|})\}_{j=1}^{n}),\label{E14}
\end{eqnarray}
And construct the following set :
\begin{eqnarray}
{S}^{-}_{k} =[s^{-}_{1}, s^{-}_{2}, s^{-}_{3}, \ldots, s^{-}_{i}, \ldots],\label{E3}\\
{S}^{+}_{k} =[s^{+}_{1}, s^{+}_{2}, s^{+}_{3}, \ldots, s^{+}_{i}, \ldots],\label{E4}
\end{eqnarray}
among ${S}^{-}_{k}$ and ${S}^{+}_{k}$ Respectively represent the mismatch area - Word similarity score $s^{-}_{i}$ And matching areas - Word similarity score $s^{+}_{i}$ Set , They will be updated dynamically during training ,$k$ That is, the number of rounds updated . Based on the two sets constructed , We can establish the similarity scores of matched fragments and mismatched fragments respectively $s$ Probability distribution model of number :
$f^{-}_{k}(s)=\frac{1}{\sigma^{-}_{k}\sqrt{2\pi}}e^{[-\frac{(s-\mu^{-}_{k})^{2}}{2(\sigma^{-}_{k})^2}]}$, $f^{+}_{k}(s)=\frac{1}{\sigma^{+}_{k}\sqrt{2\pi}}e^{[-\frac{(s-\mu^{+}_{k})^{2}}{2(\sigma^{+}_{k})^2}]}$,
among , $(\mu^{-}_{k}, \sigma^{-}_{k})$ and $(\mu^{+}_{k}, \sigma^{+}_{k})$ Are the mean and standard deviation of the two probability distributions .
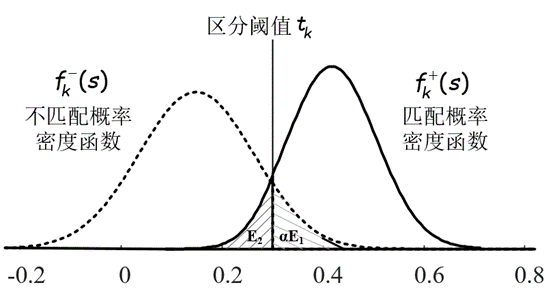
chart 6 Modeling the similarity distribution of matched and mismatched fragments
Get two similarity distribution models respectively , You can use an explicit boundary $t$ Distinguish between matched and unmatched fragments , Pictured 6 Shown , The similarity score is greater than $t$ Region - Word pairs are treated as matching fragments , Otherwise, it is a mismatched fragment . among , There are two situations where the distinction is wrong : Divide the actually mismatched fragments into matched ( Pictured 6 Medium $E_1$), Or mistake the actually matched fragments for mismatches ( Pictured 6 Medium $E_2$). Our goal is to maximize the mining of mismatched fragments , We need to find an optimal boundary $t$, Make the probability of distinguishing errors lowest , Ensure the accuracy of identification , That is to solve the following optimization problems :
\begin{equation}\label{E5}
\begin{array}{ll}{\underset{{t}}{\text{min}}} & \alpha \int_{t}^{+\infty}f_{k}^{-}(s)d{s} + \int_{-\infty}^{t}f_{k}^{+}(s)d{s},
\\ {\text {s.t. }}& t\geq 0,\end{array}
\end{equation}
among $t$ Is the decision variable of this problem ,$\alpha$ It's a penalty parameter .
For the optimal solution of this problem , We first search for the zero of its first derivative , And according to the constraints of the feasible region in $t \geq 0$ There's a cut ( Use $[\cdot]_{+} \equiv max(\cdot,0)$), The optimal solution is :
\begin{equation}\label{E6}
t_{k} = [(({\beta_{2}^{k}}^2-4\beta_{1}^{k} \beta_{3}^{k})^{\frac{1}{2}}-\beta_{2}^{k})/(2\beta_{1}^{k})]_{+}
\end{equation}
among $\beta_{1}^{k} = (\sigma^{+}_{k})^2-(\sigma^{-}_{k})^2$, $\beta_{2}^{k} = 2(\mu^{+}_{k}{\sigma^{-}_{k}}^2-\mu^{-}_{k}{\sigma^{+}_{k}}^2)$, and $\beta_{3}^{k} = (\sigma^{+}_{k}\mu^{-}_{k})^2 - (\sigma^{-}_{k}\mu^{+}_{k})^2 + 2(\sigma^{+}_{k}\sigma^{-}_{k})^2\ln\frac{\sigma^{-}_{k}}{\alpha\sigma^{+}_{k}}$.
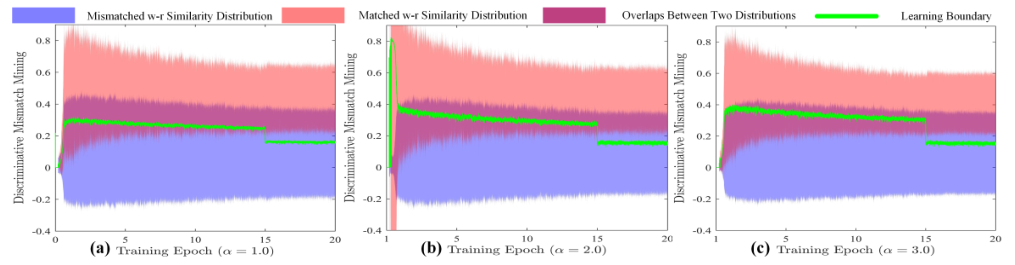
There are two points worth emphasizing . (1) In the process of training , About the explicit correlation boundary , It first learns from the similarity distribution of unmatched and matched fragments , Then it will be integrated into the attention matching process , To adjust the more differentiated similarity distribution , To create an iterative optimization process . such , The distribution of mismatched fragments will be separated from the distribution of matched fragments to the greatest extent , Mismatched fragments can produce more robust negative effects . therefore , Mismatched fragments can also be used as meaningful clues to accurately measure the image - The similarity of text .(2) At the end of training , We expect that the adaptive learning boundary can simultaneously ensure the maximum mining of mismatched fragments , Avoid performance degradation caused by misjudging matching fragments . In order to make the learning boundary converge to a state with better mining accuracy , We give the theoretical conditions for adjusting the initial penalty parameters , Or it can be more simply implemented as :$t_k = \mu^{+}_{k}-3\sigma^{+}_{k}$.
2) Positive and negative double branch matching module
In this module , We also consider images - Matching fragments and mismatching fragments between text pairs , By using two different attention masks, positive and negative , Accurately measure their positive and negative effects from two branches . We first calculate the semantic correlation between all regions and word pairs :
\begin{equation}\label{E7}
{s}_{ij}=\frac{u_{i} v_{j}^{\mathrm{T}}}{\|u_i\|\|v_j\|}, i\in[1,m], j\in[1,n]
\end{equation}
Still from the perspective of text , Calculate a text word $u_i, i\in[1, m]$ And all areas of an image $\{v_j\}_{j=1}^{n}$ Similarity and distinction boundary $t_k$ The difference between the , The maximum value reflects whether the fragment matches or does not match :
\begin{equation}\label{E8}
{s}_{i}=\underset{{j}}{\text{max}}(\{s_{ij}-t_k\}_{j=1}^{n}),
\end{equation}
thus , It can be measured that the negative effect of the first word in an image text pair is :
\begin{equation}\label{E9}
s_{i}^{neg} = {s}_{i}\odot\text{Mask}_{neg}({s}_{i})
\end{equation}
among $\text{Mask}_{neg}(\cdot)$ Mask function , When the input is negative, the output is 1, Otherwise 0,$\odot$ Represents dot product operation .
meanwhile , We can consider the semantic relationship of words in the text , Make semantically similar words get the same matching relationship , In the process of reasoning (Inference/Testing stage), Carry out an intra modal propagation of the matching degree of each word :
\begin{equation}\label{E10}
\hat{s}_{i}\!=\! \sum_{l=1}^{m} w_{il}^{intra}{s}_{l}, \ \text{s.t.} \ w_{il}^{intra}\!=\text{softmax}_{\lambda}(\{{\frac{u_i u_l^{\mathrm{T}}}{\|u_i\|\|{u}_{l}\|}}\}_{l=1}^{m}),
\end{equation}
among $ w_{il}^{intra}$ It means the first one $i$ And the first $l$ The semantic relationship between words ,$\lambda$ It's a scale factor .
On the other hand , When measuring the similarity of text pairs , We first focus on shared semantics across modes , The first $i$ The related shared semantics of words in the image can be aggregated into :
\begin{equation}\label{E11}
\hat{v}_{i}=\sum_{j=1}^{n} w_{ij}^{inter} v_j, \quad s.t. \ \ w_{ij}^{inter} = \text{softmax}_{\lambda}(\{\text{Mask}_{pos}(s_{ij}-t_k)\}_{j=1}^{n}),
\end{equation}
among $w_{ij}^{inter}$ It is the semantic association between words and regions ,$\text{Mask}_{pos}(\cdot)$ Mask function , When the input is positive, the output is equal to the input , Otherwise output $-\infty$, This makes irrelevant image areas ($s_{ij}-t_k<0$) The attention weight of is reduced to 0. thus , The similarity score of the fragment is $s_{i}^{f} = {u_{i}{\hat{v}_{i}}^{\mathrm{T}}}/(\|u_i\|\|\hat{v}_{i}\|)$.
in addition , The correlation score between regions and words also reflects the similarity between texts , Get the similarity score weighted by the correlation weight $s_{i}^{r}$ = $\sum_{j=1}^{n}w_{ij}^{relev}s_{ij}$, among $w_{ij}^{relev}=\text{softmax}_{\lambda}(\{\bar{s}_{ij}\}_{j=1}^{n})$,$\bar{s}_{ij}= [{s}_{ij}]_{+}/\sqrt{\sum_{i=1}^{m}[{s}_{ij}]_{+}^{2}}$. therefore , The positive effect of the first word in an image text pair is :
\begin{equation}\label{E12}
s_{i}^{pos} = s_{i}^{f} + s_{i}^{r}
\end{equation}
Final , Image text pair $(U, V)$ The similarity of is determined by both positive and negative effects :
\begin{equation}\label{E12-2}
S(U, V) = \frac{1}{m}\sum_{i=1}^{m} (s_{i}^{neg} + s_{i}^{pos})
\end{equation}
3、 ... and 、 Test results
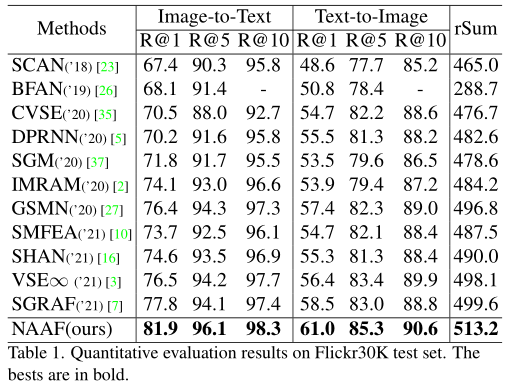
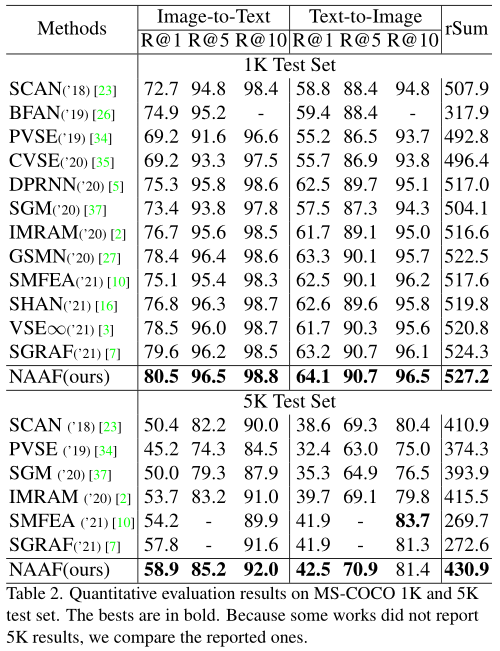
1) achieve SOTA
2) visualization
Optimal threshold learning process :
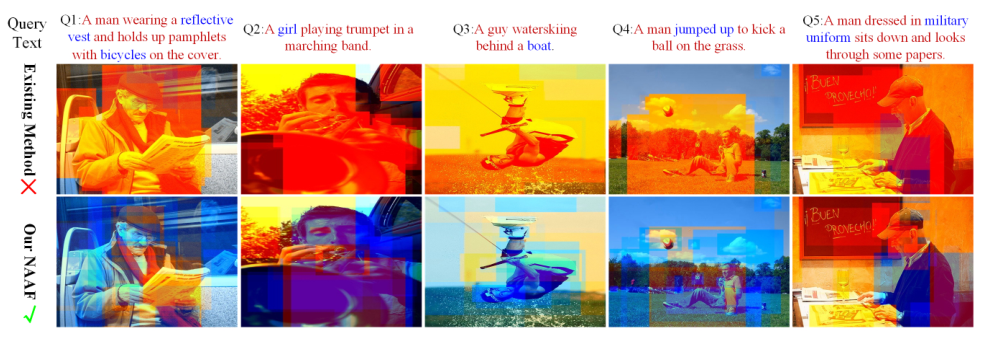
Unmatched clue mining comparison ( Blue For a mismatch )
Four 、 The paper
Zhang K, Mao Z, Wang Q, et al. Negative-Aware Attention Framework for Image-Text Matching[C]//Proceedings of the IEEE/CVF Conference on Computer Vision and Pattern Recognition. 2022: 15661-15670.