当前位置:网站首页>故障分析 | MySQL 耗尽主机内存一例分析
故障分析 | MySQL 耗尽主机内存一例分析
2022-07-05 13:54:00 【爱可生开源社区】
作者:付祥现居珠海,主要负责 Oracle、MySQL、mongoDB 和 Redis 维护工作。本文来源:原创投稿*爱可生开源社区出品,原创内容未经授权不得随意使用,转载请联系小编并注明来源。
异常现象
开发人员反馈,有一台服务器内存几乎被 MySQL 耗尽了,执行 top 命令,输出如下:
这台机器是个测试环境,MySQL 是开发自己安装的,数据库版本 5.6.51 ,机器总内存32G,MySQL 占了29G。
分析过程
查看 MySQL 启动时间发现1个星期前才启动,猜测之前由于主机内存耗尽触发了 OOM ,查看 MySQL 错误日志,发现每隔10几天,MySQL 就异常关闭一次:
2022-02-24 03:03:42 20981 [Note] InnoDB: Database was not shutdown normally!
2022-03-13 02:31:40 4134 [Note] InnoDB: Database was not shutdown normally!
2022-03-31 02:31:08 6846 [Note] InnoDB: Database was not shutdown normally!
2022-04-12 02:31:41 1159 [Note] InnoDB: Database was not shutdown normally!
2022-04-23 04:41:51 6773 [Note] InnoDB: Database was not shutdown normally!
2022-05-04 02:31:52 2499 [Note] InnoDB: Database was not shutdown normally!
2022-05-13 04:56:06 23010 [Note] InnoDB: Database was not shutdown normally!
2022-05-30 02:31:33 3244 [Note] InnoDB: Database was not shutdown normally!查看操作系统日志,进一步验证了 MySQL 耗尽主机内存,触发 OOM :
# grep oom-killer /var/log/messages* /var/log/messages-20220605:May 30 02:31:30 vm10-136-9-24 kernel: mysqld invoked
oom-killer: gfp_mask=0x201da, order=0, oom_score_adj=0查看 my.cnf 配置文件,发现几乎都是默认配置,innodb_buffer_pool_size 等于默认值128M :
mysql> show variables like 'innodb_buffer_pool_size';
+-------------------------+-----------+
| Variable_name | Value               |
+-------------------------+-----------+
| innodb_buffer_pool_size | 134217728 |
+-------------------------+-----------+当前数据库有500多个连接,都是 Sleep 状态,从 MySQL 错误日志发现 performance_schema 下的表结构全是错误的,估计 MySQL 版本做了升级,没有执行 upgrade升 级数据字典,意味着一些内存诊断信息便不能从 PS 获取:
2022-06-09 11:19:08 27468 [ERROR] Native table
'performance_schema'.'cond_instances' has the wrong structure
2022-06-09 11:19:08 27468 [ERROR] Native table
'performance_schema'.'events_waits_current' has the wrong structure
2022-06-09 11:19:08 27468 [ERROR] Native table
'performance_schema'.'events_waits_history' has the wrong structure
2022-06-09 11:19:08 27468 [ERROR] Native table
'performance_schema'.'events_waits_history_long' has the wrong structure
2022-06-09 11:19:08 27468 [ERROR] Native table
'performance_schema'.'events_waits_summary_by_host_by_event_name' has the wrong
structure
2022-06-09 11:19:08 27468 [ERROR] Native table
'performance_schema'.'events_waits_summary_by_instance' has the wrong structure
2022-06-09 11:19:08 27468 [ERROR] Native table
'performance_schema'.'events_waits_summary_by_thread_by_event_name' has the wrong
structure
2022-06-09 11:19:08 27468 [ERROR] Native table
'performance_schema'.'events_waits_summary_by_user_by_event_name' has the wrong
structure
2022-06-09 11:19:08 27468 [ERROR] Native table
'performance_schema'.'events_waits_summary_by_account_by_event_name' has the wrong
structure
2022-06-09 11:19:08 27468 [ERROR] Native table
'performance_schema'.'events_waits_summary_global_by_event_name' has the wrong
structure
2022-06-09 11:19:08 27468 [ERROR] Native table
'performance_schema'.'file_instances' has the wrong structure
2022-06-09 11:19:08 27468 [ERROR] Native table
'performance_schema'.'file_summary_by_event_name' has the wrong structure
2022-06-09 11:19:08 27468 [ERROR] Native table
'performance_schema'.'file_summary_by_instance' has the wrong structure
2022-06-09 11:19:08 27468 [ERROR] Native table 'performance_schema'.'host_cache'
has the wrong structure
2022-06-09 11:19:08 27468 [ERROR] Native table
'performance_schema'.'mutex_instances' has the wrong structure
2022-06-09 11:19:08 27468 [ERROR] Native table
'performance_schema'.'objects_summary_global_by_type' has the wrong structure
2022-06-09 11:19:08 27468 [ERROR] Native table
'performance_schema'.'performance_timers' has the wrong structure
2022-06-09 11:19:08 27468 [ERROR] Native table
'performance_schema'.'rwlock_instances' has the wrong structure
.....省略输出.........
mysql> show variables like 'performance_schema'; +--------------------+-------+
| Variable_name | Value | +--------------------+-------+
| performance_schema | ON | +--------------------+-------+
1 row in set (0.00 sec)
mysql> use performance_schema
Database changed
mysql> show tables;
Empty set (0.00 sec)show engine innodb status ,截取内存信息如下:
BUFFER POOL AND MEMORY
----------------------
Total memory allocated 137363456; in additional pool allocated 0
Dictionary memory allocated 736104382
Buffer pool size 8191
Free buffers 1024
Database pages 6851
Old database pages 2508
Modified db pages 0
Pending reads 0
Pending writes: LRU 0, flush list 0, single page 0
Pages made young 1280745, not young 1337956473
1.59 youngs/s, 0.10 non-youngs/s
Pages read 97753005, created 121179, written 1163360
0.06 reads/s, 0.88 creates/s, 12.12 writes/s
Buffer pool hit rate 1000 / 1000, young-making rate 0 / 1000 not 0 / 1000
Pages read ahead 0.00/s, evicted without access 0.00/s, Random read ahead 0.00/s
LRU len: 6851, unzip_LRU len: 0 I/O sum[597]:cur[0], unzip sum[0]:cur[0]数据字典分配内存竟然达到700M,通过 lsof 命令发现,MySQL 打开了大量的 MyISAM 表分区文件,每个分区占用2个文件句柄,这应该是其内存使用高的原因:
lsof|grep "#P#"|grep -E "MYD$|MYI$"|wc -l
29826MyISAM 存储引擎,数据块通过操作系统缓存,索引块由 key buffer 缓存,大小通过参数 key_buffer_size 控制,当前默认值如下:
mysql> show variables like 'key_buffer_size';
+-----------------+---------+
| Variable_name | Value     |
+-----------------+---------+
| key_buffer_size | 8388608 |
+-----------------+---------+
1 row in set (0.00 sec)MySQL 默认使用 GLIBC 内存分配器,通过 gdb 调用 malloc_stats()函数分析内存使用情况:
gdb -ex "call (void) malloc_stats()" --batch -p $(pidof mysqld)上述命令执行完成后,会将内存使用情况打印到 MySQL 错误日志:
Arena 0:
system bytes = 2001301504
in use bytes = 250961264
Arena 1:
system bytes = 12181504
in use bytes = 1000800
Arena 2:
system bytes = 164257792
in use bytes = 8032368
Arena 3:
system bytes = 1363267584
in use bytes = 468958176
Arena 4:
system bytes = 335654912
in use bytes = 708240
Arena 5:
system bytes = 2150400
in use bytes = 254576
Arena 6:
system bytes = 32059392
in use bytes = 1078000
Arena 7:
system bytes = 671559680
in use bytes = 4884688
Arena 8:
system bytes = 44052480
in use bytes = 935904
Arena 9:
system bytes = 43302912
in use bytes = 2630256
Arena 10:
system bytes = 21729280
in use bytes = 618848
Arena 11:
system bytes = 702341120
in use bytes = 2745648
Arena 12:
system bytes = 63066112
in use bytes = 1537360
Arena 13:
system bytes = 467128320
in use bytes = 2199648
Arena 14:
system bytes = 1682067456
in use bytes = 23873712
Arena 15:
system bytes = 1613938688
in use bytes = 929648
Arena 16:
system bytes = 150749184
in use bytes = 1593600
Arena 17:
system bytes = 1554382848
in use bytes = 343840
Arena 18:
system bytes = 514367488
in use bytes = 38418976
Arena 19:
system bytes = 88248320
in use bytes = 3488848
Arena 20:
system bytes = 703705088
in use bytes = 5674256
Arena 21:
system bytes = 469848064
in use bytes = 417632
Arena 22:
system bytes = 172064768
in use bytes = 2259808
Arena 23:
system bytes = 391884800
in use bytes = 763104
Arena 24:
system bytes = 1414455296
in use bytes = 26260272
Arena 25:
system bytes = 316915712
in use bytes = 596432
Arena 26:
system bytes = 702865408
in use bytes = 623840
Arena 27:
system bytes = 516800512
in use bytes = 371040
Arena 28:
system bytes = 175669248
in use bytes = 3301776
Arena 29:
system bytes = 26525696
in use bytes = 1406640
Arena 30:
system bytes = 51970048
in use bytes = 375072
Arena 31:
system bytes = 525869056
in use bytes = 515651936
Arena 32:
system bytes = 363950080
in use bytes = 696912
Arena 33:
system bytes = 1816637440
in use bytes = 13213184
Arena 34:
system bytes = 1470251008
in use bytes = 13774880
Arena 35:
system bytes = 703832064
in use bytes = 2624144
Arena 36:
system bytes = 115941376
in use bytes = 3248720
Arena 37:
system bytes = 777551872
in use bytes = 978896
Arena 38:
system bytes = 45363200
in use bytes = 45081504
Arena 39:
system bytes = 374652928
in use bytes = 341904
Arena 40:
system bytes = 26222592
in use bytes = 25993760
Arena 41:
system bytes = 20140032
in use bytes = 386384
Arena 42:
system bytes = 702484480
in use bytes = 700284096
Arena 43:
system bytes = 54947840
in use bytes = 1650880
Arena 44:
system bytes = 516972544
in use bytes = 3178016
Arena 45:
system bytes = 66084864
in use bytes = 1186080
Arena 46:
system bytes = 1672466432
in use bytes = 3988320
Arena 47:
system bytes = 3727360
in use bytes = 1518624
Arena 48:
system bytes = 471752704
in use bytes = 66314288
Arena 49:
system bytes = 491962368
in use bytes = 2521952
Arena 50:
system bytes = 12431360
in use bytes = 3573216
Arena 51:
system bytes = 58073088
in use bytes = 720512
Arena 52:
system bytes = 24412160
in use bytes = 1166080
Arena 53:
system bytes = 34963456
in use bytes = 1003856
Arena 54:
system bytes = 28745728
in use bytes = 3283728
Arena 55:
system bytes = 703614976
in use bytes = 423398352
Arena 56:
system bytes = 31150080
in use bytes = 30834032
Arena 57:
system bytes = 397848576
in use bytes = 757680
Arena 58:
system bytes = 416169984
in use bytes = 1561520
Arena 59:
system bytes = 702533632
in use bytes = 4707824
Arena 60:
system bytes = 26615808
in use bytes = 8339040
Arena 61:
system bytes = 174006272
in use bytes = 317760
Arena 62:
system bytes = 3846144
in use bytes = 3525664
Arena 63:
system bytes = 26365952
in use bytes = 693104
Total (incl. mmap):
system bytes = 1166893056
in use bytes = 348358880
max mmap regions = 55
max mmap bytes = 1919492096将上述输出存入临时文件 /tmp/fx.txt ,计算分配给 MySQL 内存和 MySQL 使用内存如下:
# awk '{if($1 == "system") total+=$NF; else if ($1 == "in") used+=$NF }END{print
total/1024/1024/1024,used/1024/1024/1024}' /tmp/fx.txt
28.4044 2.87976分配给 MySQL 内存28.4G,MySQL 使用内存才2.8G,表明内存碎片化太严重了,使用 google 内存分配器 tcmalloc 重启 MySQL 十几天后,top 命令观察 MySQL 占用内存稳定在5G:
小结
jemalloc 和 tcmalloc 之类的内存分配器在一些场景,尤其是在多核 CPU 和高并发工作负载下能提供更高效的性能,例如我们熟知的 mongodb 使用 tcmalloc ,redis 使用 jemalloc 。
边栏推荐
- [cloud resources] what software is good for cloud resource security management? Why?
- 常见问题之PHP——Fatal error: Allowed memory size of 314572800 bytes exhausted...
- upload (1-6)
- Wonderful express | Tencent cloud database June issue
- Aspx simple user login
- 明峰医疗冲刺科创板:年营收3.5亿元 拟募资6.24亿
- What is information security? What is included? What is the difference with network security?
- ::ffff:192.168.31.101 是一个什么地址?
- redis6数据类型及操作总结
- 锚点导航小demo
猜你喜欢
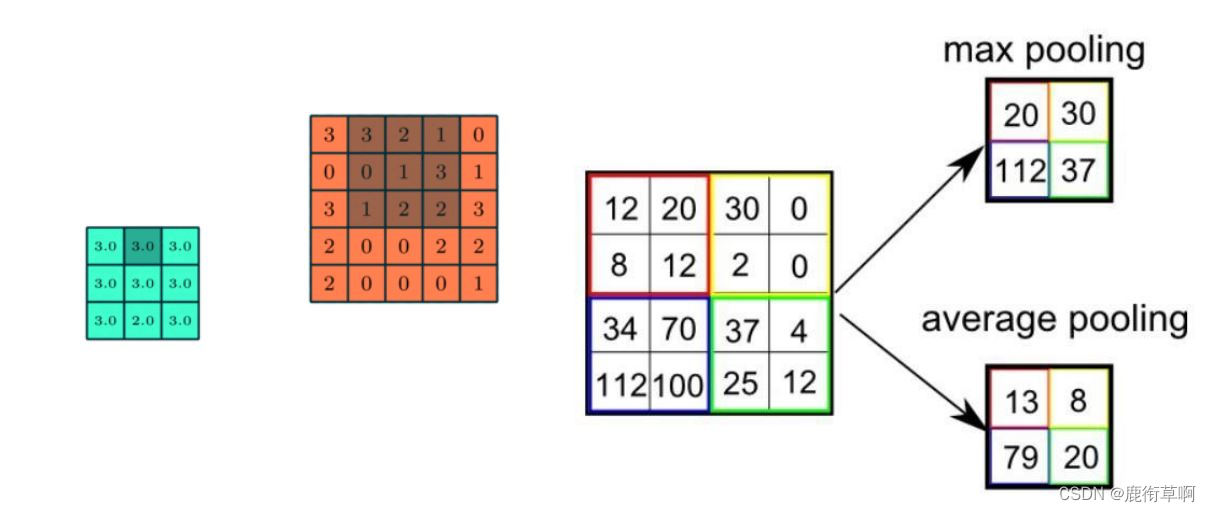
Brief introduction to revolutionary neural networks
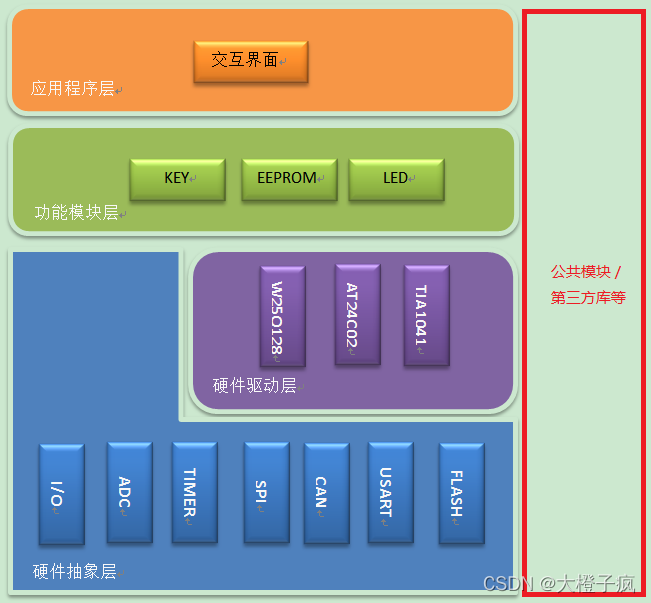
Embedded software architecture design - message interaction
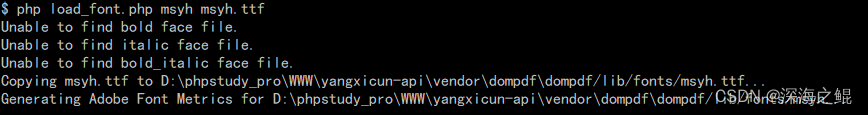
laravel-dompdf导出pdf,中文乱码问题解决
![Primary code audit [no dolls (modification)] assessment](/img/b8/82c32e95d1b72f75823ca91c97138e.jpg)
Primary code audit [no dolls (modification)] assessment

Zibll theme external chain redirection go page beautification tutorial

Introduction to Chapter 8 proof problem of njupt "Xin'an numeral base"

Wonderful express | Tencent cloud database June issue
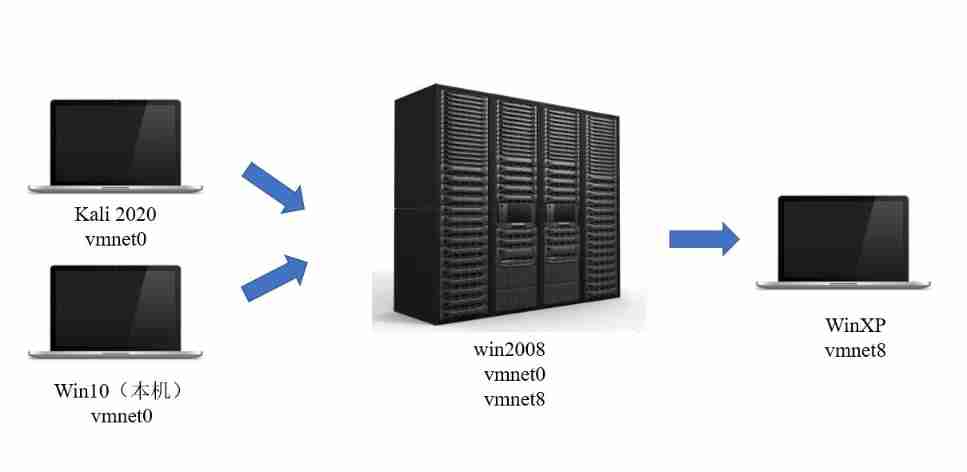
Self built shooting range 2022

Summit review | baowanda - an integrated data security protection system driven by compliance and security
redis6主从复制及集群
随机推荐
Usage, installation and use of TortoiseSVN
Laravel框架运行报错:No application encryption key has been specified
Requset + BS4 crawling shell listings
ETCD数据库源码分析——集群间网络层客户端peerRt
ZABBIX monitoring
2022 machine fitter (Advanced) test question simulation test question bank simulation test platform operation
zabbix 监控
ELFK部署
Godson 2nd generation burn PMON and reload system
ETCD数据库源码分析——rawnode简单封装
What is information security? What is included? What is the difference with network security?
French scholars: the explicability of counter attack under optimal transmission theory
PHP generate Poster
Wechat app payment callback processing method PHP logging method, notes. 2020/5/26
Kafaka log collection
LeetCode_67(二进制求和)
[South China University of technology] information sharing of postgraduate entrance examination and re examination
Idea remote debugging agent
asp.net 读取txt文件
Embedded software architecture design - message interaction