当前位置:网站首页>Common configurations in rectangular coordinate system
Common configurations in rectangular coordinate system
2022-07-08 01:11:00 【Just love life】
Common configuration in rectangular coordinate system
Diagram of rectangular coordinate system : Histogram 、 Broken line diagram 、 Scatter plot
grid grid
grid It is used to control the layout and size of rectangular coordinates
x Axis and y The axis is grid Based on 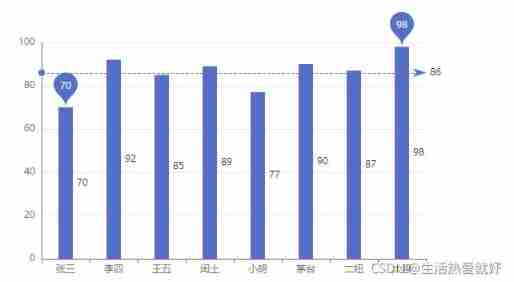
Show grid
show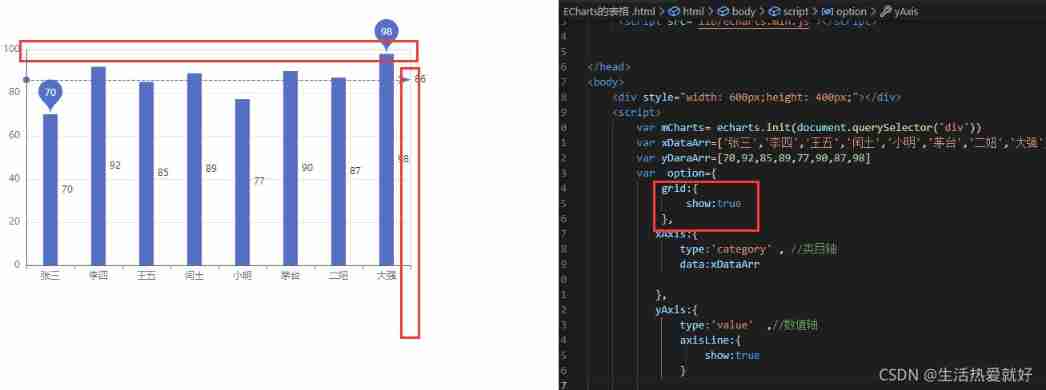
grid Location and size of
left、top、right、bottom、height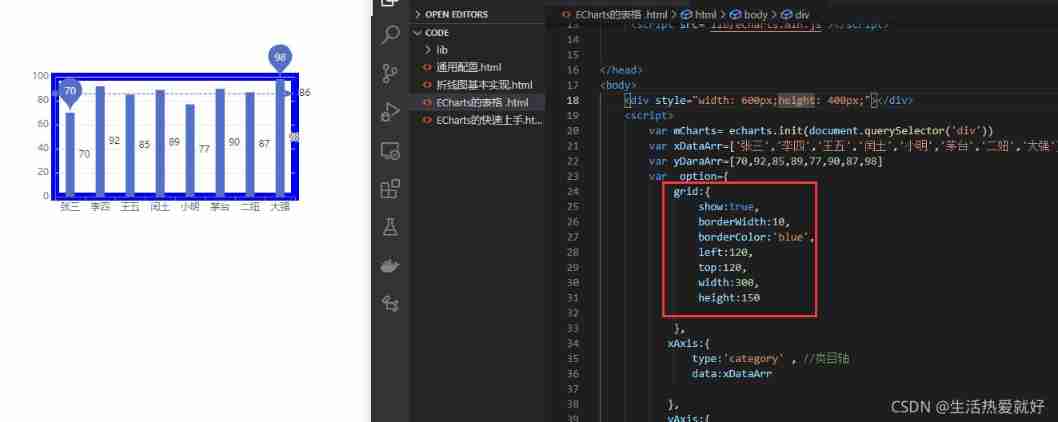
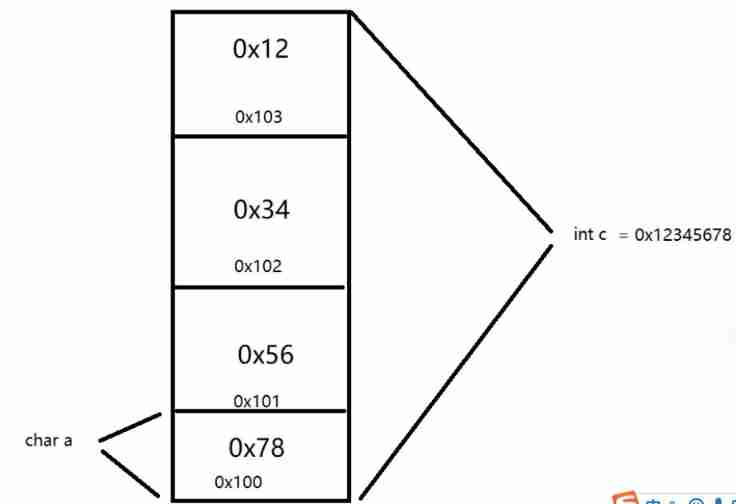
Axis
The coordinate axis is divided into x Axis and y Axis
One grid There are at most two positions in x Axis and y Axis
Axis type type
value: Value axis , This type must pass data Set category
category: Taxonomic axis , This type must pass data Set category data
Display position position
xAxis: It can be taken as top perhaps bottom
yAxis: It can be taken as left perhaps right
dataZoom
dataZoom For area scaling , Filter amount of data range ,x Axis and y All axes can have
dataZoom Is an array , This means that multiple area scalers can be configured
slider: slider
inside: built-in , Zoom with the mouse wheel or two fingers 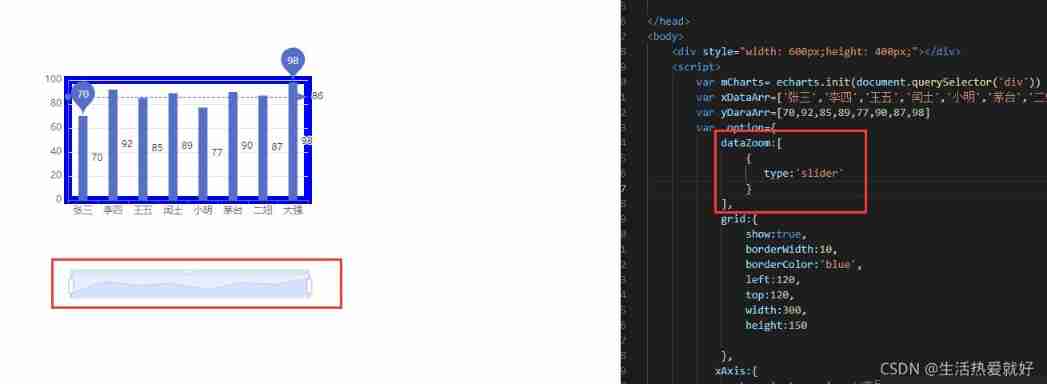
Indicate which axis works
xAxisIndex: Set which... The zoom component controls x Axis , General writing 0 that will do
yAxisIndex: Set which... The zoom component controls y Axis , General writing 0 that will do 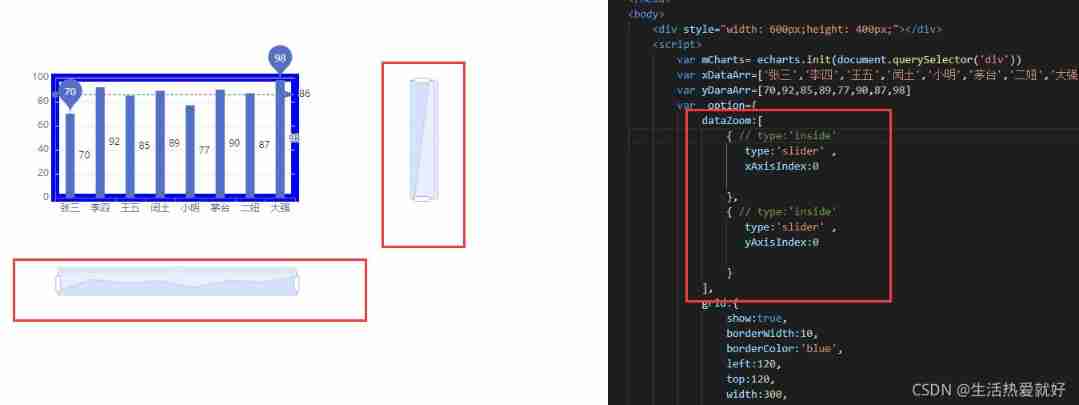
Indicates the scaling of the initial state
start: The starting percentage of the data window range
end: End percentage of data window range 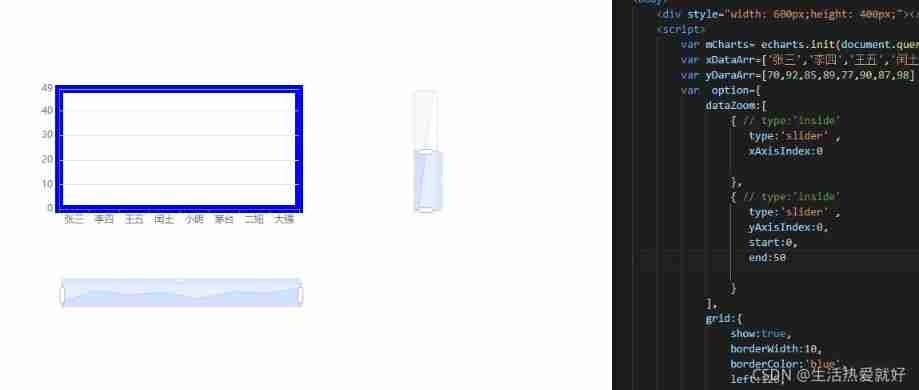
Code
 <!-- 1.ECharts The most basic code structure  2.x Axis data :[' Zhang San ',‘ Li Si ’,‘ Wang Wu ’,‘ Intercalary soil ’,‘ Xiao Ming ’,‘ maotai ’,‘ Er Niu ’,‘ Daqiang ’] 3.y Axis data :[88,92,63,77,94,80,72,86] 4. take type Is set to bar --> <!DOCTYPE html> <html lang="en"> <head> <meta charset="UTF-8"> <meta name="viewport" content="width=device-width, initial-scale=1.0"> <title>Document</title> <script src="lib/echarts.min.js"></script> </head> <body> <div style="width: 600px;height: 400px;"></div> <script> var mCharts= echarts.init(document.querySelector('div')) var xDataArr=[' Zhang San ',' Li Si ',' Wang Wu ',' Intercalary soil ',' Xiao Ming ',' maotai ',' Er Niu ',' Daqiang '] var yDaraArr=[70,92,85,89,77,90,87,98] var option={

            dataZoom:[
                {
     // type:'inside'
                   type:'slider' ,
                   xAxisIndex:0

                },
                {
     // type:'inside'
                   type:'slider' ,
                   yAxisIndex:0,
                   start:0,
                   end:50

                }
            ], grid:{

                show:true,
                borderWidth:10,
                borderColor:'blue',
                left:120,
                top:120,
                width:300,
                height:150

            }, xAxis:{

               type:'category' , // Taxonomic axis
               data:xDataArr

           }, yAxis:{

               type:'value' ,// Value axis  axisLine:{

                   show:true
               }

           }, series:[
               {

                   name:' Chinese language and literature ', type:'bar', //bar It's a histogram ,line It's linear ,pie It's pie shaped  markPoint:{

                       data:[
                         {

                             type:'max',name:' Maximum '
                         },{

                           type:'min',name:' minimum value '
                         }
                      ]
                    }, markLine:{

                       data:[
                           {

                               type:'average',name:' Average '
                           }
                       ]
                    }, label:{

                       show: true,
                       position:'right'
                    },

                    barWidth:'30%',
                   data:yDaraArr
               }
           ]
        }
        // step 5: Set the configuration item to echarts Instance object
        mCharts.setOption(option)
     </script>
</body>
</html>
边栏推荐
- ThinkPHP kernel work order system source code commercial open source version multi user + multi customer service + SMS + email notification
- Know how to get the traffic password
- Interface test advanced interface script use - apipost (pre / post execution script)
- Mathematical modeling -- knowledge map
- Image data preprocessing
- Chapter 7 Bayesian classifier
- 基础篇——整合第三方技术
- 牛客基础语法必刷100题之基本类型
- 国外众测之密码找回漏洞
- Fundamentals - integrating third-party technology
猜你喜欢
A network composed of three convolution layers completes the image classification task of cifar10 data set
![[necessary for R & D personnel] how to make your own dataset and display it.](/img/50/3d826186b563069fd8d433e8feefc4.png)
[necessary for R & D personnel] how to make your own dataset and display it.
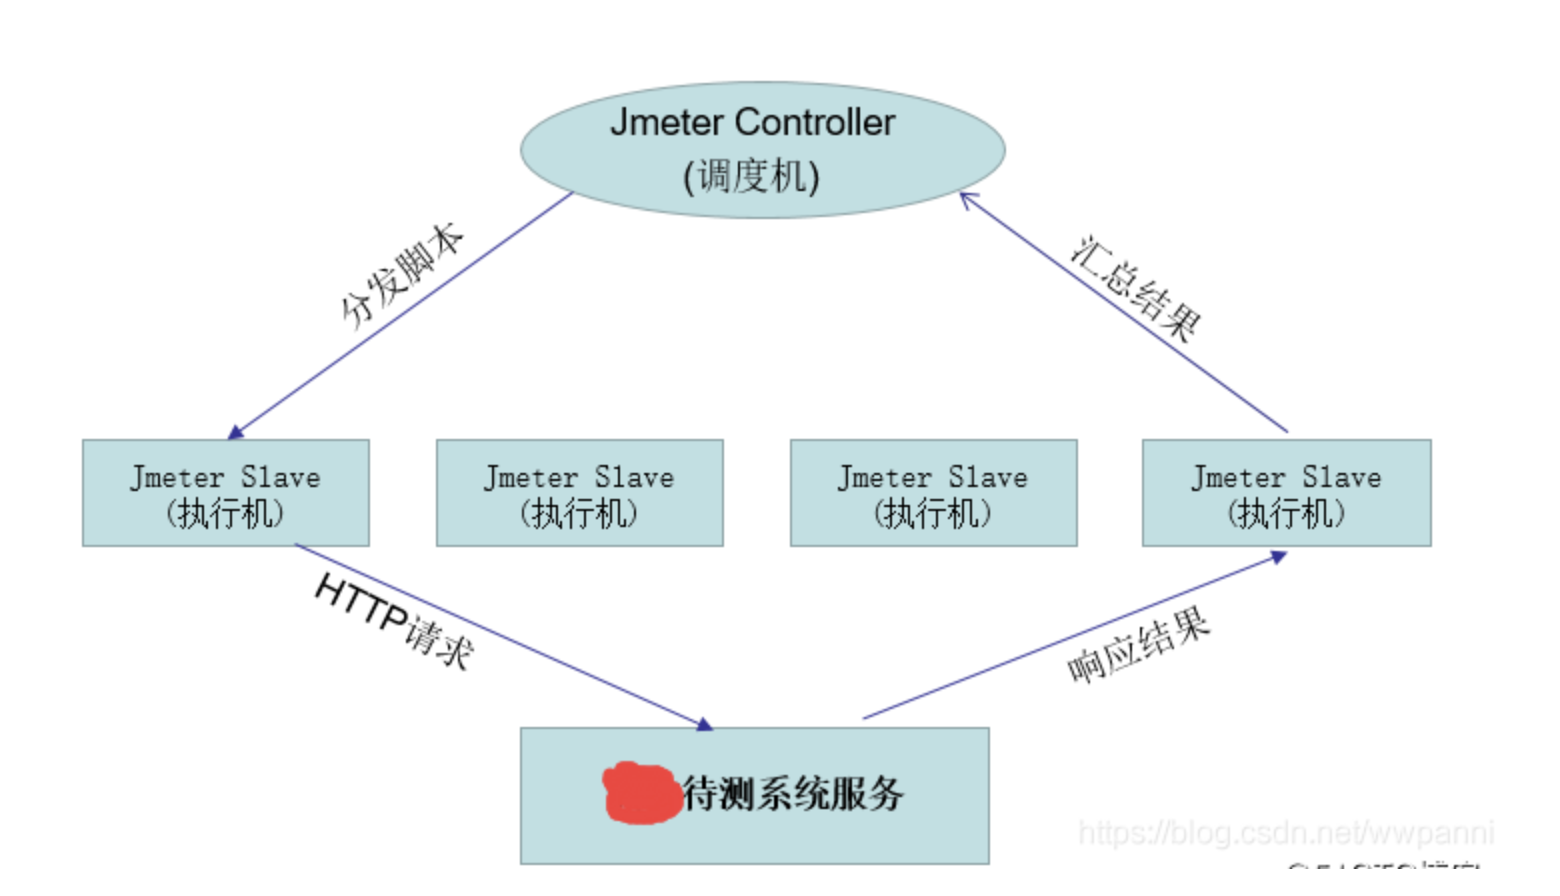
Jemter distributed
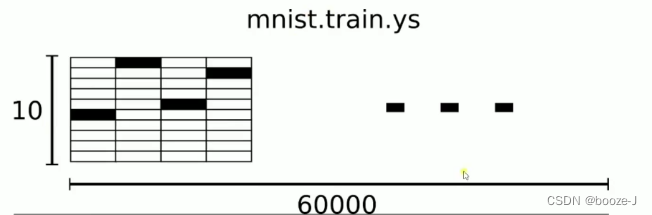
3.MNIST数据集分类
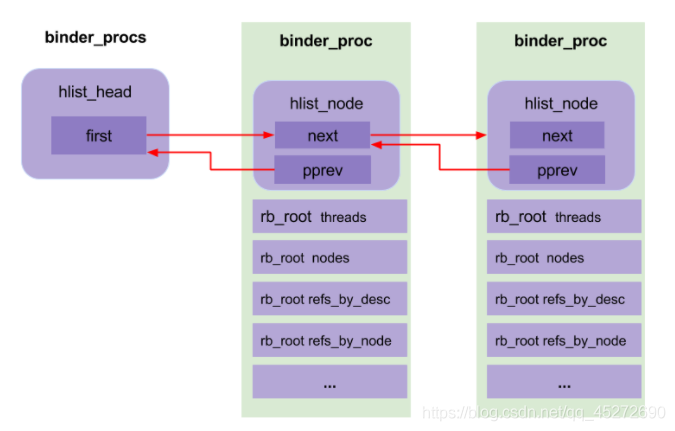
Binder core API
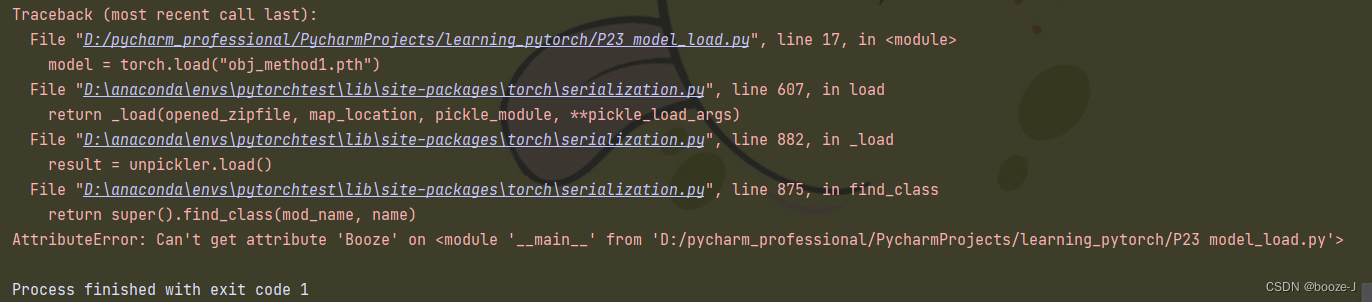
网络模型的保存与读取
My best game based on wechat applet development
Su embedded training - Day6
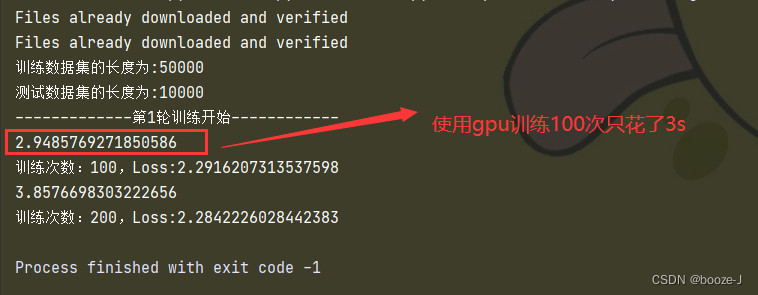
Using GPU to train network model
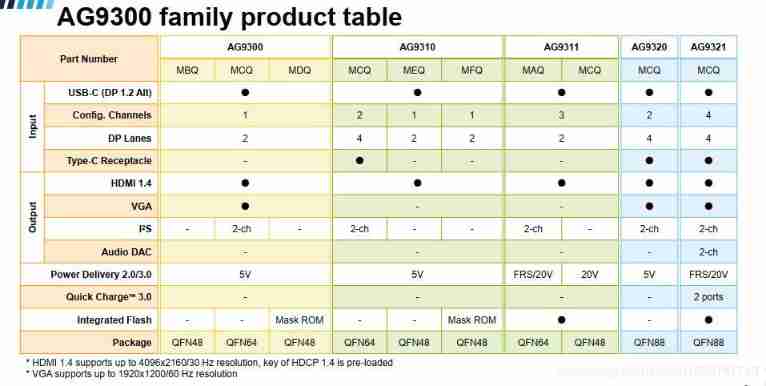
USB type-C mobile phone projection scheme | USB type-C docking station scheme | TV / projector type-C converter scheme | ag9300ag9310ag9320
随机推荐
6. Dropout application
Recommend a document management tool mendely Reference Manager
Semantic segmentation model base segmentation_ models_ Detailed introduction to pytorch
Serial port receives a packet of data
swift获取url参数
[note] common combined filter circuit
10.CNN应用于手写数字识别
串口接收一包数据
Implementation of adjacency table of SQLite database storage directory structure 2-construction of directory tree
50Mhz产生时间
The weight of the product page of the second level classification is low. What if it is not included?
Introduction to ML regression analysis of AI zhetianchuan
How to transfer Netease cloud music /qq music to Apple Music
Ag9310 for type-C docking station scheme circuit design method | ag9310 for type-C audio and video converter scheme circuit design reference
Chapter 16 intensive learning
基于微信小程序开发的我最在行的小游戏
EDP to LVDS conversion design circuit | EDP to LVDS adapter board circuit | capstone/cs5211 chip circuit schematic reference
13.模型的保存和載入
Malware detection method based on convolutional neural network
Several frequently used OCR document scanning tools | no watermark | avoid IQ tax