当前位置:网站首页>How does Matplotlib and PIL image integrate and save multiple pictures into one picture
How does Matplotlib and PIL image integrate and save multiple pictures into one picture
2022-07-08 01:26:00 【Bosong】
Catalog
1. Law 1 : Generate multi row and multi column graph
2. Law two : Generate a single line / Single column diagram
stay This article How to generate multiple graphs is described in , But many times, we need to comprehensively compare and display the pictures , Therefore, it needs to be merged in one picture .
Here is 2 Methods : Method 1 usually shows the idea of multiple rows and columns , Reference resources writing 1; Method 2 can be used to send a single line / Single column long graph , Reference resources writing 2.
1. Law 1 : Generate multi row and multi column graph
import os
import inspect
import pandas as pd
import numpy as np
from datetime import datetime
from PIL import Image
import glob, os
import matplotlib.pyplot as plt
%matplotlib inline
plt.rcParams['font.sans-serif']=['SimHei']
plt.rcParams['axes.unicode_minus']=False

prefix = 'flow'
# * matching 1 individual or Multiple characters ,files It can display all file names ( Tabular form )
files=glob.glob('fig_lots/flow_*')
num=len(files)
img_np = []
# sz Represents the pixel of the picture
sz = (2000, 1400)
for i in range(0, num):
    file = prefix+'_'+str(i+1)+'.png'
    #  Traverse and open these pictures , and resize by sz
    im = Image.open('fig_lots/'+file)
    im = im.resize(sz,Image.ANTIALIAS)
    #  Turn the picture into array
    im_array = np.atleast_2d(im)
    img_np.append(im_array)
#  The length of the picture 、 wide 、 The channel number
print(im_array.shape[0], im_array.shape[1], im_array.shape[2])

#  Canvas size figsize according to sz and rows cols Jointly determine , That is, the canvas is horizontal : Canvas portrait  = sz Length *cols :sz The width of *rows
fig = plt.figure(figsize = (20, 39))
rows = 11
cols = 4
for i in range(1, rows*cols + 1):
    img_array = img_np[i-1]
    #  Subgraph location
    ax = fig.add_subplot(rows, cols, i)
    plt.axis('off') #  Remove the axis of each subgraph
    plt.imshow(img_array)

plt.subplots_adjust(wspace = 0, hspace = 0) #  Modify the interval between subgraphs
plt.savefig('flowrc.png', dpi=400)
2. Law two : Generate a single line / Single column diagram
import numpy as np
from PIL import Image
import glob, os

#  Use only PIL Library by converting pictures to array Format , Merge export . Unable to adjust the size and spacing of the picture for the time being 、 Only one way 、 Single column Export .
if __name__=='__main__':
    # * matching 1 individual or Multiple characters ,files It can display all file names ( Tabular form )
    files=glob.glob('fig_lots/flow_*')
    num=len(files)

    filename_lens=[len(x) for x in files] #length of the files
    min_len=min(filename_lens) #minimal length of filenames
    max_len=max(filename_lens) #maximal length of filenames
    if min_len==max_len:#the last number of each filename has the same length
        files=sorted(files) #sort the files in ascending order
    else:#maybe the filenames are:x_0.png ... x_10.png ... x_100.png
        index=[0 for x in range(num)]
        for i in range(num):
            filename=files[i]
            start=filename.rfind('_')+1
            end=filename.rfind('.')
            file_no=int(filename[start:end])
            index[i]=file_no
        index=sorted(index)
        files=[prefix+'_'+str(x)+'.png' for x in index]

    print(files[0], files)
    # Image.open Picture attribute
    baseimg=Image.open('fig_lots/'+files[0])
    # .size Display size (2000,1400)
    sz=baseimg.size
    # 0-255 Of the displayed picture 2 Dimension group
    basemat=np.atleast_2d(baseimg)
    #  From 2 The picture begins , Merge with the previous figure
    for i in range(1,num):
        file=files[i]
        im=Image.open('fig_lots/'+file)
        im=im.resize(sz,Image.ANTIALIAS)
        #  The image is converted into an array
        mat=np.atleast_2d(im)
        basemat=np.append(basemat,mat,axis=0)
    #  The image is converted back from the array
    final_img=Image.fromarray(basemat)
    print(final_img)
    final_img.save('merged.png')
Generating multiple graphs is “ discharge ”, Aggregated into a graph is “ closed ”,“ discharge ” Yes “ From thin to thick ” The feeling of ,“ closed ” Yes “ From thick to thin ” The feeling of .
See a bunch of beautiful pictures , Happy ~~
边栏推荐
- [deep learning] AI one click to change the sky
- 2021-04-12 - new features lambda expression and function functional interface programming
- Common fault analysis and Countermeasures of using MySQL in go language
- Two methods for full screen adaptation of background pictures, background size: cover; Or (background size: 100% 100%;)
- Overall introduction of the project
- Solve the error: NPM warn config global ` --global`, `--local` are deprecated Use `--location=global` instead.
- Application of state mode in JSF source code
- Know how to get the traffic password
- 2022 safety officer-c certificate examination paper and safety officer-c certificate simulated examination question bank
- General configuration toolbox
猜你喜欢

2022 high altitude installation, maintenance and demolition examination materials and high altitude installation, maintenance and demolition operation certificate examination

3. MNIST dataset classification
Probability distribution
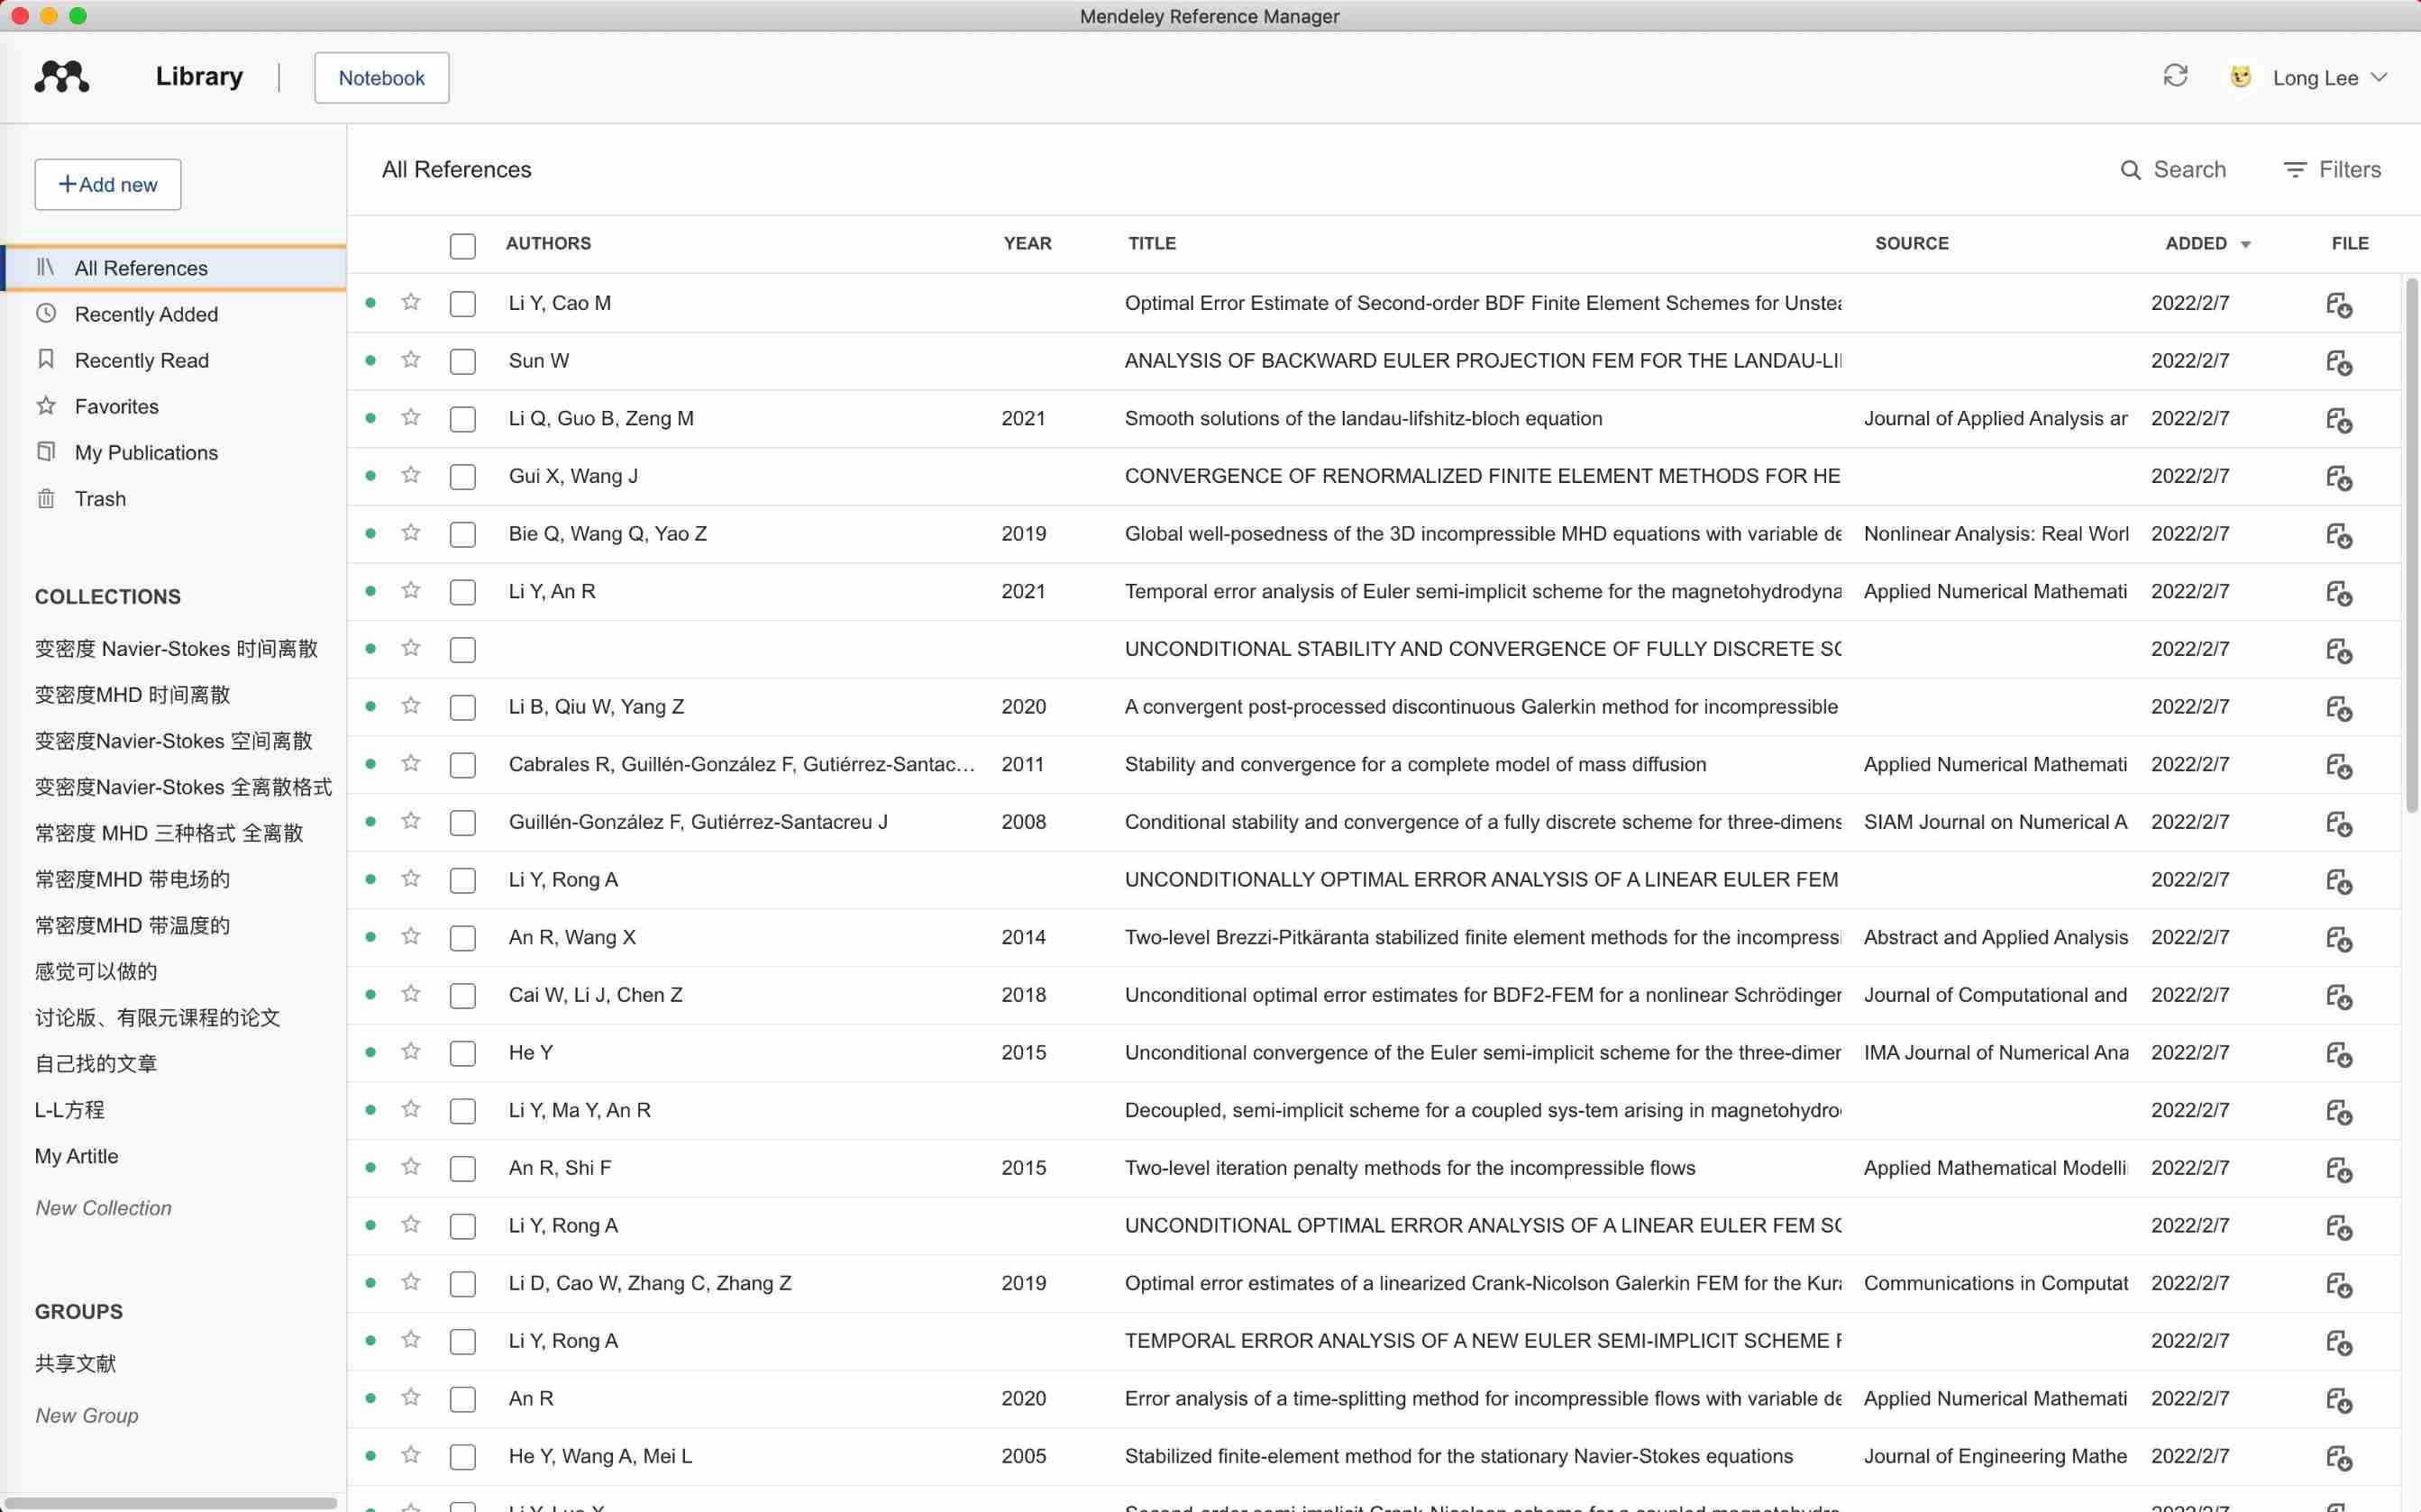
Recommend a document management tool mendely Reference Manager
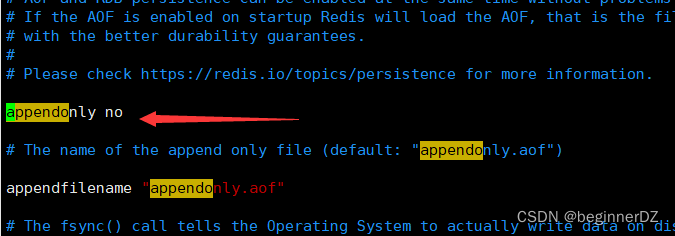
redis的持久化方式-RDB和AOF 两种持久化机制
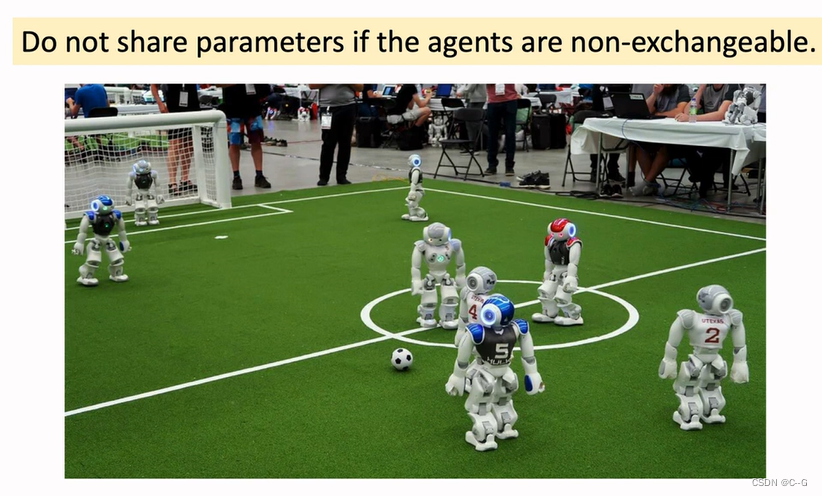
3、多智能体强化学习
Getting started STM32 -- how to learn stm32

Markdown learning (entry level)
Scheme selection and scheme design of multifunctional docking station for type C to VGA HDMI audio and video launched by ange in Taiwan | scheme selection and scheme explanation of usb-c to VGA HDMI c
High quality USB sound card / audio chip sss1700 | sss1700 design 96 kHz 24 bit sampling rate USB headset microphone scheme | sss1700 Chinese design scheme explanation
随机推荐
A little experience from reading "civilization, modernization, value investment and China"
10. CNN applied to handwritten digit recognition
4. Apprentissage stratégique
redis的持久化方式-RDB和AOF 两种持久化机制
NPM Internal Split module
Kaptcha generates verification code on Web page
Several frequently used OCR document scanning tools | no watermark | avoid IQ tax
Complete model verification (test, demo) routine
Common operations of numpy on two-dimensional array
AttributeError: ‘str‘ object has no attribute ‘strftime‘
2022 new examination questions for crane driver (limited to bridge crane) and question bank for crane driver (limited to bridge crane) operation examination
Cs5212an design display to VGA HD adapter products | display to VGA Hd 1080p adapter products
2022 high voltage electrician examination skills and high voltage electrician reexamination examination
Swift get URL parameters
Vscode reading Notepad Chinese display garbled code
How to transfer Netease cloud music /qq music to Apple Music
The difference between distribution function and probability density function of random variables
Two methods for full screen adaptation of background pictures, background size: cover; Or (background size: 100% 100%;)
8. Optimizer
Gnuradio 3.9 using OOT custom module problem record