当前位置:网站首页>Statistics 8th Edition Jia Junping Chapter 4 Summary and after class exercise answers
Statistics 8th Edition Jia Junping Chapter 4 Summary and after class exercise answers
2022-07-06 14:43:00 【No two or three things】
1. Examination site induction
2. Test site tips
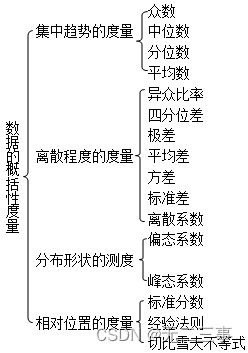
(1) Concentration trend 、 A measure of discrete trends , Including the meaning of each indicator 、 Calculation formula 、 characteristic 、 significance 、 Scope of application ( choice question 、 Short answer 、 Calculation test site );
(2) The number of 、 The characteristics and application occasions of the three indicators of median and average , The relationship between the three indicators under skew distribution ( choice question 、 Short answer 、 Calculation test site );
(3) A measure of the shape of the distribution : Numerical meaning of skewness coefficient and kurtosis coefficient ( choice question 、 Short answer test site ).
(4) Calculation formula and application of standard score ( choice question 、 Short answer 、 Calculation test site );
(5) Rule of thumb 、 The concrete application of Chebyshev inequality ( Multiple choice test site ).
3. Core of examination site
(1): The measurement of concentration trends
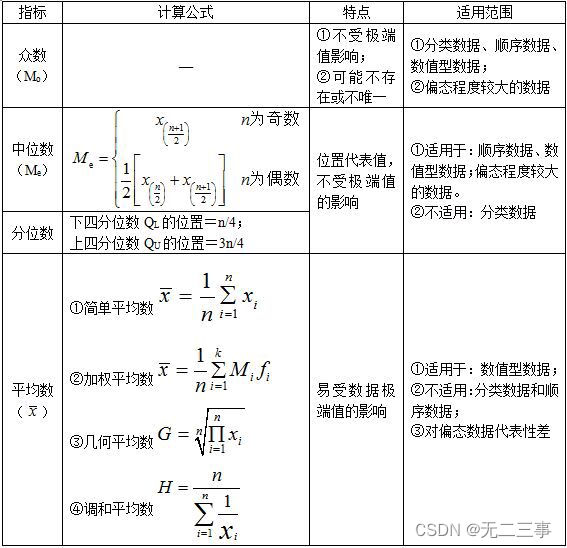
【 Be careful 】 The relationship between centralized trend measurement indicators in the distribution of different degrees of skewness :① In symmetric distribution , The number of 、 The median is equal to the average ;② Left biased distribution , The data has a minimum , Pull the average to the minimum , The mode and median are not affected by extreme values , Yes x<Me<Mo;③ Right biased distribution , The data has a maximum , It must pull the average to the maximum , therefore Mo<Me<x.
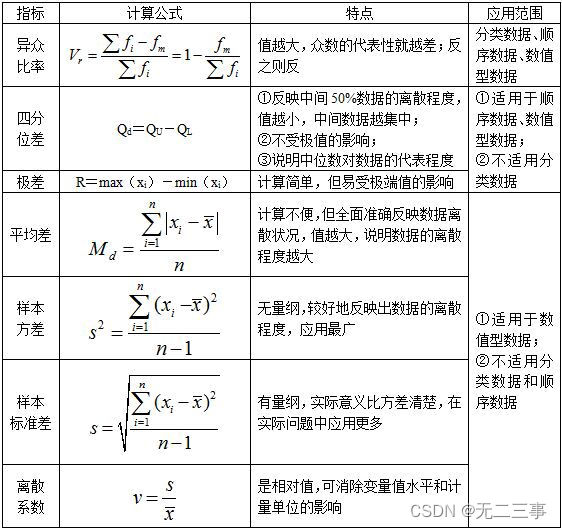
(2) A measure of the degree of dispersion
The degree of dispersion of data reflects the degree to which the value of each variable is far away from its central value , The smaller the degree of dispersion , The better the representativeness .
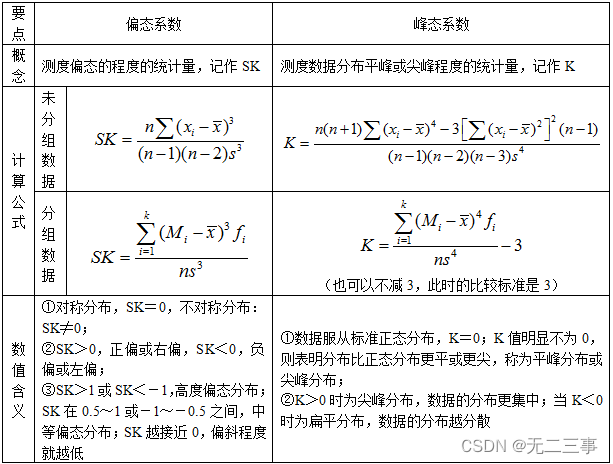
(3) Measure of distribution shape
Skewness is a measure of the symmetry of data distribution , Kurtosis is a measure of the degree of flattening or peaking of data distribution .
(4) A measure of relative position
(1) Standard score ( Normalized value or z fraction )
① Calculation formula :zi=(xi-x)/s.
② characteristic : The average is 0、 The standard deviation is 1; The data is linearly transformed , Do not change the position of the data in the Group , Nor does it change the shape of the distribution of this group of data .
③ purpose :
a. Determine the relative position of a certain data in the group of data , It can be used to judge whether a group of data has outliers ;
b. When dealing with multiple variables with different dimensions , Standard scores can be used to standardize variables .
(2) Rule of thumb (3σ principle )
When a set of data is symmetrically distributed , The rule of thumb shows :
① There are about 68% The data is on average ±1 Within the range of standard deviation ;
② There are about 95% The data is on average ±2 Within the range of standard deviation ;
③ There are about 99% The data is on average ±3 Within the range of standard deviation .
therefore , On average ±3 The range of standard deviation contains almost all the data , And in the ±3 Data outside of the standard deviation is called outliers .
(3) Chebyshev inequality
① Concept : For data with arbitrary distribution patterns , According to Chebyshev inequality , There are at least (1-1/k2) The data of this project falls in ±k Within standard deviation . among k It is greater than 1 Any value of , It doesn't have to be an integer . about k=2,3,4, The meaning of this inequality is :
a. There are at least 75% The data of falls on the average ±2 Within the range of standard deviation ;
b. There are at least 89% The data of falls on the average ±3 Within the range of standard deviation ;
c. There are at least 94% The data of falls on the average ±4 Within the range of standard deviation .
② characteristic : Chebyshev inequality is applicable to data with any distribution shape .
Two exercises
1 A car retail store 10 Sales people 5 The number of cars sold in the month ( Company : platform ) The order is as follows :
2 4 7 10 10 10 12 12 14 15
requirement :
(1) Calculate the mode of car sales 、 Median and average .
(2) Calculate the quartile according to the defined formula .
(3) Calculate the standard deviation of sales .
(4) Explain the characteristics of the distribution of automobile sales .
Explain :(1)10 Sales people 5 Of the number of cars sold in the month , sales 10 There are the most people in this car , by 3 people , So mode M0=10.
The median position =(n+1)/2=(10+1)/2=5.5, therefore Me=(10+10)/2=10( platform ).
The average 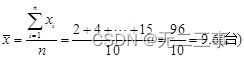
(2) From the data in the question :
①QL Location =n/4=10/4=2.5, namely QL In the 2 A numerical (4) And the 3 A numerical (7) Between 0.5 Location . therefore
QL=(4+7)/2=5.5( platform )
②QU Location =3n/4=3×10÷4=7.5, namely QU In the 7 A numerical (12) And the 8 A numerical (12) Between 0.5 Location , therefore
QU=(12+12)/2=12( platform )
(3) By average x=9.6 Available :
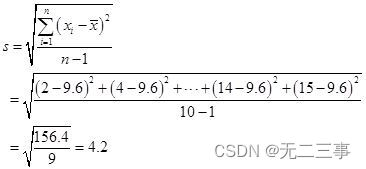
(4) Because the average is less than the median and mode , Therefore, the distribution of car sales is left biased .
2 Random sampling 25 Network users , Get their age data as shown in the table 4-4 Shown .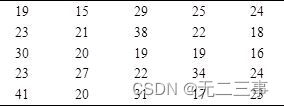
requirement :
(1) Calculate the mode 、 Median .
(2) Calculate the quartile .
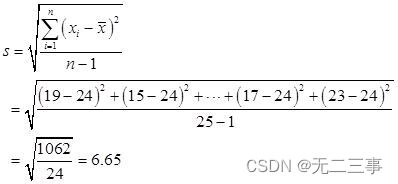
(3) Calculate the mean and standard deviation .
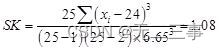
(4) Calculate skewness coefficient and kurtosis coefficient .
(5) Comprehensively analyze the distribution characteristics of netizens' age .
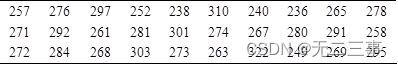
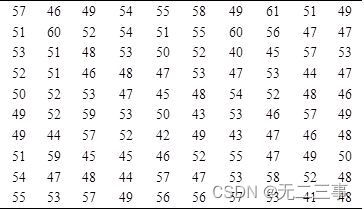
Explain :(1) Counter table 4-4 The data in is arranged from small to large :
![]()
According to the sorting data , The most frequent occurrence of age is 19 and 23, All appear 3 Time , So there are two modes , namely Mo=19 and Mo=23.
Due to the median position =(n+1)/n=(25+1)/2=13, therefore Me=23( year )
(2) The quartile can be calculated from the data in the question :
①QL Location =n/4=25/4=6.25, namely QL In the 6 A numerical (19) And the 7 A numerical (19) Between 0.25 Location , therefore
QL=19+0.25×(19-19)=19( year )
② because QU Location =3×25/4=25/4=18.75, namely QU In the 18 A numerical (25) And the 19 A numerical (27) Between 0.75 Location , therefore
QU=25+0.75×(27-25)=26.5( year )
(3) The average
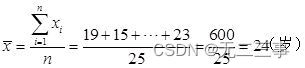
By average x=24 Available :
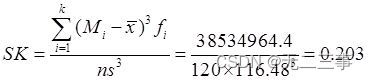
(4) The coefficient of skewness :
Peak state coefficient :
![]()
(5) The results of a comprehensive analysis of the age distribution of netizens are as follows : From mode 、 Median and average , Netizens are aged 23 People around the age of are in the majority ; The standard deviation is large , It shows that there is a large age difference between netizens ; The skewness coefficient is greater than 1, It shows that the age distribution of netizens is right , And the degree of deflection is very large . The kurtosis coefficient is positive , It is peak distribution , It shows that the age distribution of netizens is relatively concentrated .
3 An e-commerce 6 Sales data for each day of the month
requirement :
(1) Calculate the average and median daily sales of the department store .
(2) Calculate the quartile .
(3) Calculate the standard deviation of daily sales .
Explain :(1) The average of daily sales is :
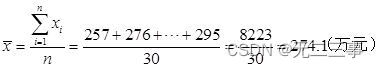
Will table 4-5 Data sorting in :
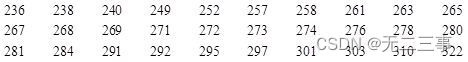
The median position =(30+1)/2=15.5, therefore Me=(272+273)/2=272.5
(2) The quartile can be calculated from the data in the question :
① because QL Location =30/4=7.5, namely QL In the 7 A numerical (258) And the 8 A numerical (261) Between 0.5 Location . therefore
QL=(258+261)/2=259.5( Ten thousand yuan )②QU Location =3×30÷4=22.5, namely QL In the 22 A numerical (284) And the 23 A numerical (291) Between 0.5 Location . therefore
QU=(284+291)/2=287.5( Ten thousand yuan )
(3) By the average of daily sales x=274.1 Available :
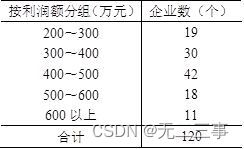
4 Draw in an area 120 companies , Group by profit amount .
requirement :
(1) Calculation 120 The average and standard deviation of the profits of enterprises .
(2) Calculate the skewness coefficient and kurtosis coefficient of the distribution .
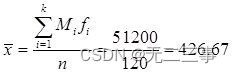
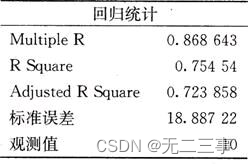
Explain :(1) The average calculation process is shown in table 4-7 Shown .
surface 4-7 A region 120 Calculation process table of average profit of enterprises
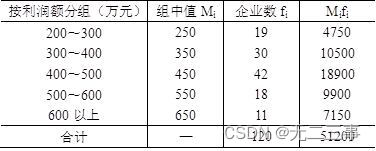
By the table 4-7 The average can be obtained from the data in :
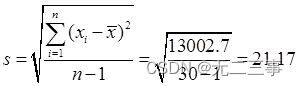
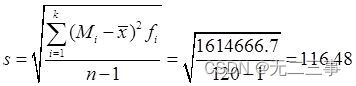
The calculation process of standard deviation is shown in table 4-8 Shown .
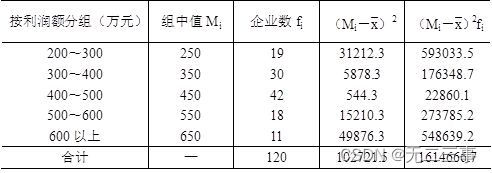
surface 4-8 A region 120 Calculation process table of standard deviation of profits of enterprises
By the table 4-8 Data available in :
(2) The calculation process of skewness coefficient and kurtosis coefficient is shown in table 4-9 Shown .
surface 4-9 Calculation process of skewness coefficient and kurtosis coefficient
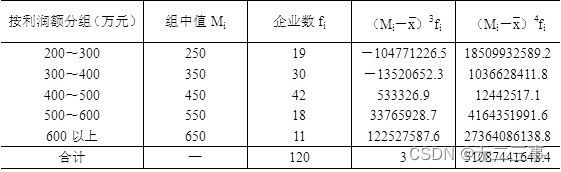
From the data in the table, the skewness coefficient is :
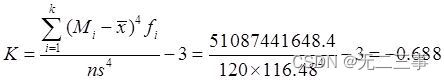
The kurtosis coefficient can be obtained from the data in the table :
5 The average daily output of a product production line is 3700 Pieces of , The standard deviation is 50 Pieces of . If the yield on a given day is lower or higher than the average yield , And fall into ±2 Out of the range of standard deviation , Think of this production line “ Out of control ”. surface 4-10 It is the output of each day of the week , Which days did the production line lose control ?
surface 4-10 Production line output data
![]()
Explain : because x=3700,s=50, Use the formula zi=(xi-x)/s You can calculate the standard score every day , As shown in the table 4-11 Shown .
![]()
surface 4-11 Standard score table of production line output
By the table 4-11 According to the data in : Monday 、 The absolute value of the standard score on Saturday is greater than 2, So I lost control on Monday and Saturday .
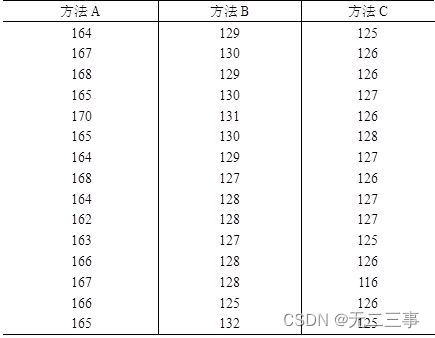
6 A product requires manual assembly , There are three alternative assembly methods . To test which method is better , Random sampling 15 One worker , Let them assemble in three ways . surface 4-12 yes 15 The number of products assembled by workers in three ways at the same time .
surface 4-12 The number of products assembled by workers in the same time in three ways ( Company : individual )
requirement :
(1) What method are you going to use to evaluate the advantages and disadvantages of the assembly method ?
(2) If you choose a method , What choice would you make ? Try to explain why . Explain :(1) It should be evaluated in terms of average and standard deviation . When comparing the discreteness of various methods , Discrete coefficients should be used .
(2) surface 4-13 Given with Excel Calculate some main descriptive statistics .
surface 4-13 Description statistics
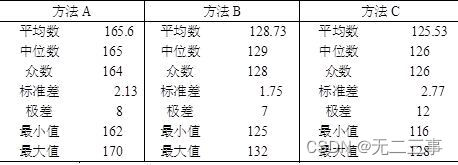
From the centralized trend of the three methods , Method A The average output of is the highest , The median and mode are also higher than the other two methods . In terms of dispersion , The discrete coefficients of the three methods are :
vA=sA/xA=2.13/165.6=0.013
vB=sB/xB=1.75/128.73=0.014
vA=sC/xC=2.77/125.53=0.022
Method A The dispersion coefficient of is the smallest , That is, the degree of dispersion is the smallest , Therefore, the method should be selected A.
边栏推荐
- The common methods of servlet context, session and request objects and the scope of storing data in servlet.
- [pointer] the array is stored in reverse order and output
- Statistics 8th Edition Jia Junping Chapter 12 summary of knowledge points of multiple linear regression and answers to exercises after class
- 指針:最大值、最小值和平均值
- 函数:字符串反序存放
- Intel oneapi - opening a new era of heterogeneity
- Markdown font color editing teaching
- Fundamentals of digital circuit (IV) data distributor, data selector and numerical comparator
- [pointer] use the insertion sorting method to arrange n numbers from small to large
- 【指针】查找最大的字符串
猜你喜欢
The common methods of servlet context, session and request objects and the scope of storing data in servlet.
《统计学》第八版贾俊平第十一章一元线性回归知识点总结及课后习题答案
servlet中 servlet context与 session与 request三个对象的常用方法和存放数据的作用域。

1.支付系统
Statistics 8th Edition Jia Junping Chapter 3 after class exercises and answer summary

JVM memory model concept
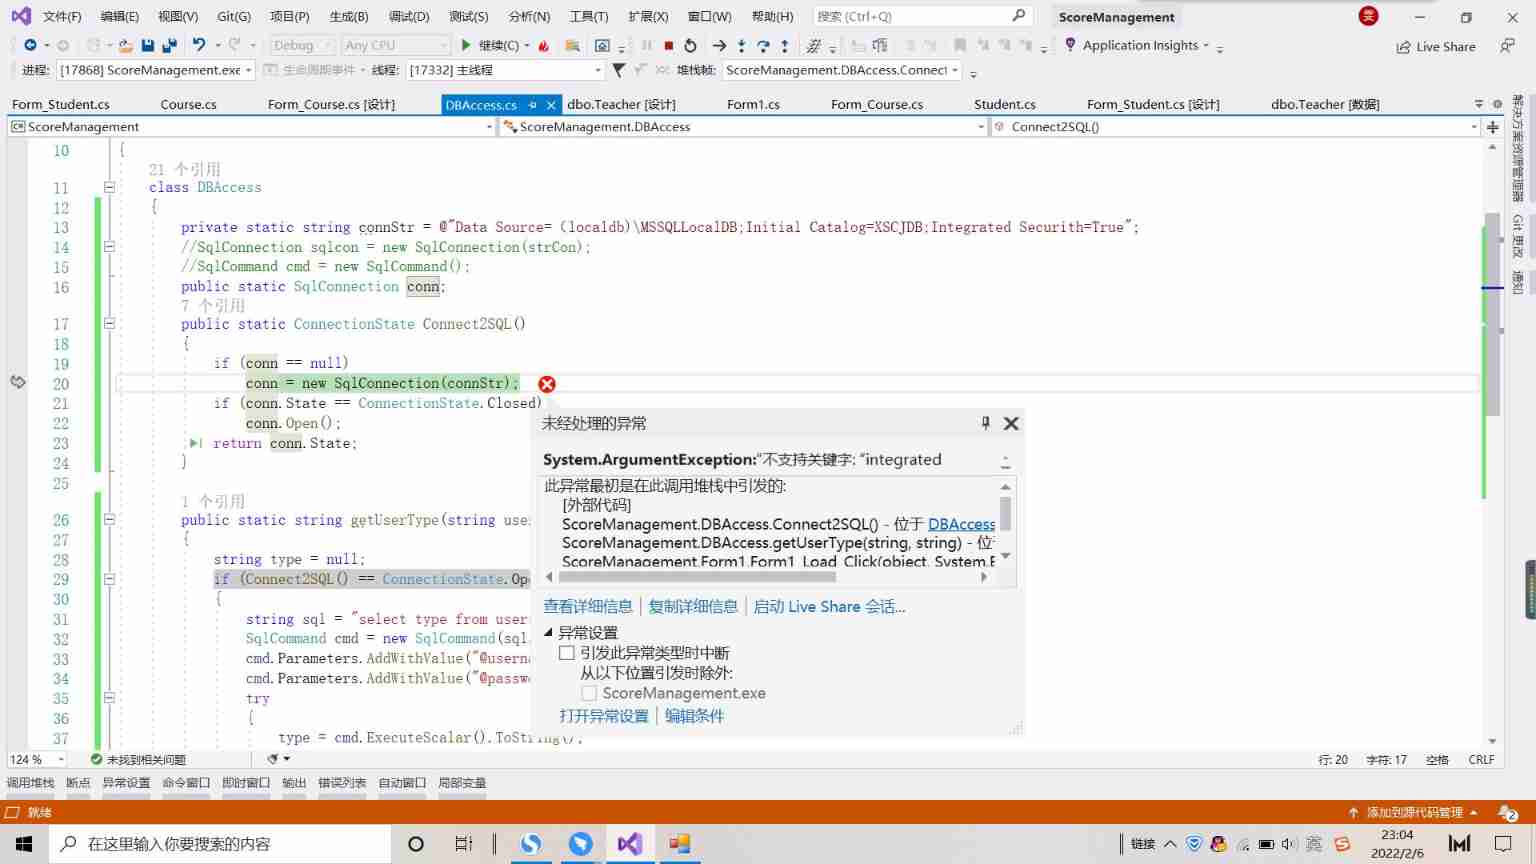
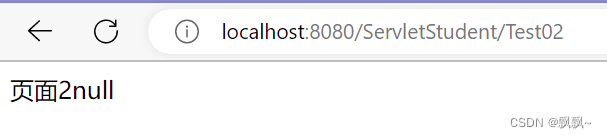
An unhandled exception occurred when C connected to SQL Server: system Argumentexception: "keyword not supported:" integrated
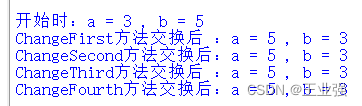
关于交换a和b的值的四种方法

四元数---基本概念(转载)
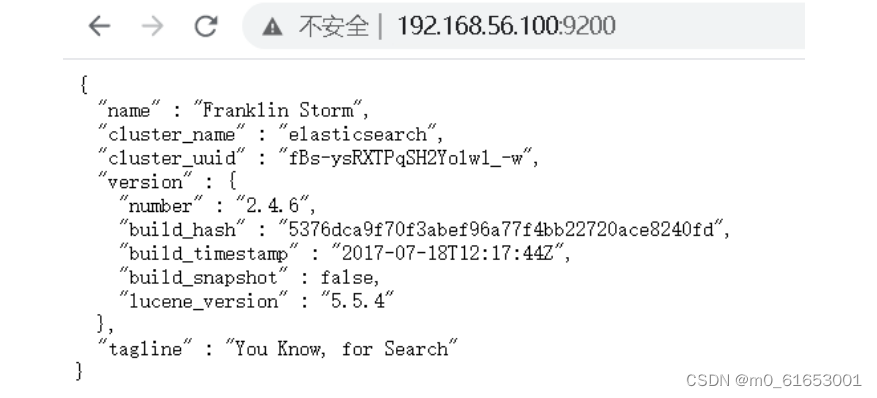
Es full text index
随机推荐
《统计学》第八版贾俊平第五章概率与概率分布
Overview of LNMP architecture and construction of related services
MySQL中什么是索引?常用的索引有哪些种类?索引在什么情况下会失效?
1. Payment system
1.支付系统
Summary of thread implementation
函数:用牛顿迭代法求方程的根
Feature extraction and detection 14 plane object recognition
Flash implements forced login
Intranet information collection of Intranet penetration (4)
“人生若只如初见”——RISC-V
函数:求方程的根
【指针】求解最后留下的人
Wang Shuang's detailed learning notes of assembly language II: registers
How to earn the first pot of gold in CSDN (we are all creators)
Constants, variables, and operators of SystemVerilog usage
Sqqyw (indifferent dot icon system) vulnerability recurrence and 74cms vulnerability recurrence
The most popular colloquial system explains the base of numbers
Mathematical modeling idea of 2022 central China Cup
5分钟掌握机器学习鸢尾花逻辑回归分类