当前位置:网站首页>Statistics 8th Edition Jia Junping Chapter 12 summary of knowledge points of multiple linear regression and answers to exercises after class
Statistics 8th Edition Jia Junping Chapter 12 summary of knowledge points of multiple linear regression and answers to exercises after class
2022-07-06 14:31:00 【No two or three things】
Catalog
One 、 Knowledge framework
Two 、 Exercises
1 According to the table 12-2 The data for Excel Regression , And the regression results are discussed , Calculation x1=200,x2=7 when y The predicted value of .
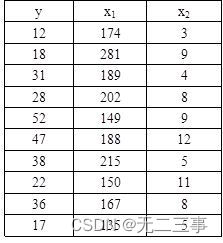
Explain : from Excel Output regression results , As shown in the table .
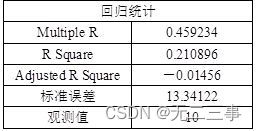
Regression results
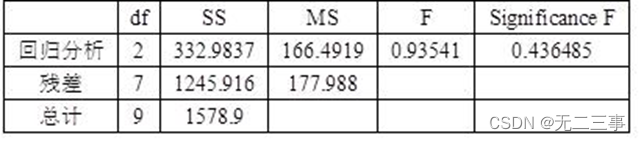
variance analysis
 So the regression equation is :y=25.0287-0.04971x1+1.928169x2.
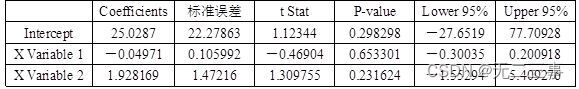
among β1=-0.04971 Express , stay x2 Under the same conditions ,x1 Every increase 1 A unit of ,y Average decline 0.04971 A unit of ;β2=1.928169 Express , stay x1 Under the same conditions ,x2 Every increase 1 A unit of ,y Average increase 1.928169 A unit of . Determination factor R2=21.09%, It means that the variation of the dependent variable can be y And x1 and x2 The proportion explained by the linear relationship between is 21.09%. Because this proportion is very low , It shows that the fitting degree of the regression equation is very poor . Estimate the standard error se=13.34122, The prediction error is also large . The ANOVA table shows ,Significance F=0.436485>α=0.05, indicate y And x1 and x2 The linear relationship between them is not significant . For regression coefficient test P All values are greater than α=0.05, The two regression coefficients are not significant . When x1=200,x2=7 when ,y The predicted value of is :y=25.0287-0.04971×200+1.928169×7=28.58.
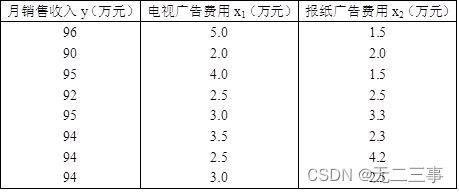
2 The management of an electric appliance sales company thinks that , Monthly sales revenue is a function of advertising expenses , And I want to estimate the monthly sales revenue through advertising expenses .
requirement :
(1) Take the TV advertising cost as the independent variable , Monthly sales revenue as the dependent variable , Establish the regression equation of estimation .
(2) The independent variables are TV advertising expense and newspaper advertising expense , Monthly sales revenue as the dependent variable , Establish the regression equation of estimation .
(3) Above (1) and (2) The established regression equation of estimation , Is the coefficient of TV advertising cost the same ? Explain the regression coefficients respectively .
(4) According to the question (2) The established regression equation of estimation , In the total variation of sales revenue , What proportion is explained by the estimated regression equation ?
(5) According to the question (2) The established regression equation of estimation , Test whether the regression coefficient is significant (α=0.05).
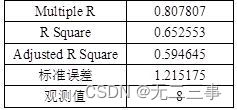
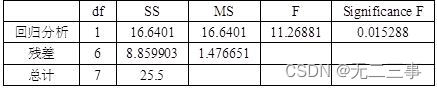
Explain :(1) Take the TV advertising cost as the independent variable , Monthly sales revenue as the dependent variable , from Excel The output regression results are shown in the table .
Regression results
Analysis of variance
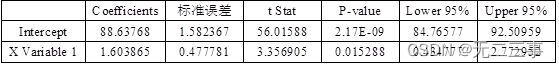
So the estimated regression equation is :y=88.63768+1.603865x1.
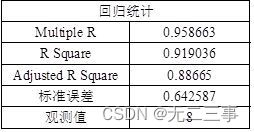
(2) The independent variables are TV advertising expense and newspaper advertising expense , Monthly sales revenue as the dependent variable , from Excel The output regression results are shown .
Regression results
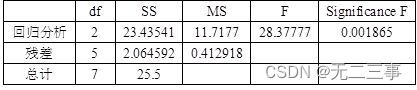
Analysis of variance
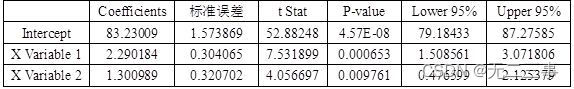
So the estimated regression equation is :y=83.23009+2.290184x1+1.300989x2.
(3)(1) and (2) In the established regression equation of estimation , The coefficients of TV advertising expenses are different .
stay (1) In the regression equation of , Regression coefficient β1=1.603865 Express : Every increase in TV advertising expenses 1 Ten thousand yuan , Monthly sales revenue increased on average 1.603865 Ten thousand yuan ; stay (2) In the regression equation of , Regression coefficient β1=2.290184 Express : Under the condition of constant newspaper advertising expenses , Every increase in TV advertising expenses 1 Ten thousand yuan , Monthly sales revenue increased on average 2.290184 Ten thousand yuan .
(4) problem (2) in ,R2=91.9036%,Ra2=88.665%, It shows that in the total variation of sales revenue , The proportion explained by the estimated regression equation is 88.665%.
(5) problem (2) in ,β1 Of P value 0.000653,β2 Of P value =0.009761, All less than α=0.05, Therefore, the two regression coefficients are significant .
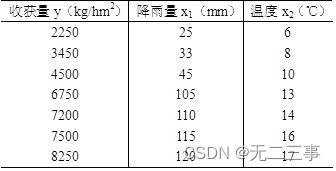
3 The data of early rice harvest, spring rainfall and spring temperature obtained by a farm through experiments are shown in the table .
requirement :
(1) Try to determine the binary linear regression equation of early rice harvest to spring rainfall and spring temperature .
(2) Explain the practical significance of the regression coefficient .
(3) In your judgment , Whether there is multicollinearity in the model ?
Explain :(1) from Excel The output regression results are shown in the table .
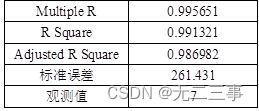
Regression results
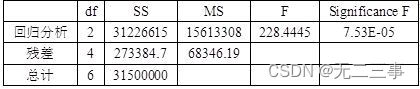
Analysis of variance 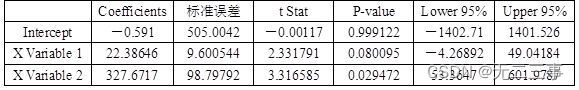
Therefore, the binary linear regression equation of early rice harvest to spring rainfall and spring temperature is :
y=-0.5910+22.3865x1+327.6717x2
(2) Regression coefficient β1=22.3865 Express , Under the condition of constant temperature , Every increase in rainfall 1mm, The wheat harvest increased on average 22.3865kg/hm2; Regression coefficient β2=327.6717 Express , Under the condition of constant rainfall , Every time the temperature increases 1℃, The wheat harvest increased on average 327.6717kg/hm2.
(3) From the relationship between rainfall, temperature and harvest , There is a strong relationship between the two variables and the harvest , And from the table 12-16 From the data of , There is also a strong relationship between temperature and rainfall , therefore , There may be multicollinearity in the model .
4 A real estate appraisal company wants to estimate the selling price of real estate in a city (y) And the appraised value of the property (x1)、 Property valuation (x2) And usable area (x3) Build a model , In order to make a reasonable prediction of the sales price . So , It collected 20 Real estate appraisal data of residential buildings , As shown in the table .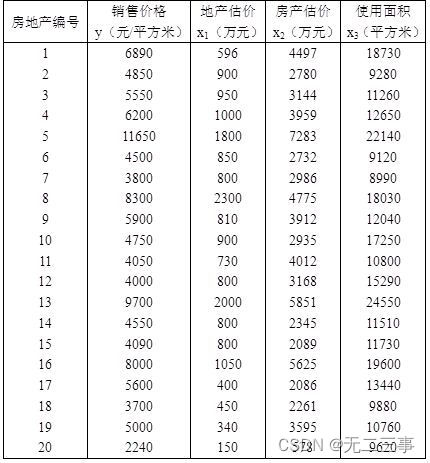
use Excel Regression , Answer the following question :
(1) Write the estimated multiple regression equation .
(2) What is the proportion explained by the estimated regression equation in the total variation of sales price ?
(3) Test whether the linear relationship of the regression equation is significant (α=0.05).
(4) Test whether the regression coefficients are significant (α=0.05).
Explain :(1) from Excel The output regression results are shown in the table .
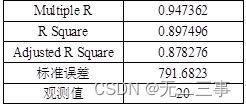
Regression results
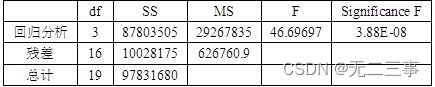
Analysis of variance 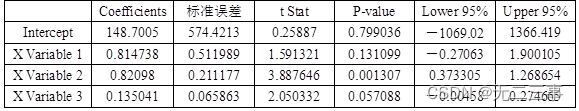
Therefore, the estimated multiple regression equation is :y=148.7005+0.8147x1+0.8210x2+0.1350x3
(2) In multiple linear regression analysis , The adjusted judgment coefficient should be used to measure the goodness of fit of the regression model , Adjusted judgment coefficient Ra2=87.83%, It indicates that the total variation of sales price , The proportion explained by the estimated regression equation is 87.83%.
(3) because Significance F=3.88E-08<α=0.05, Therefore, the linear relationship of the regression equation is significant .
(4)β1 Of P value =0.1311>α=0.05, No significant ;β2 Of P value =0.0013≤α=0.05, remarkable ;β3 Of P value =0.0571>α=0.05, No significant .
5 surface 12-21 It's random 15 Relevant data of similar products sold in large shopping malls ( Company : element ).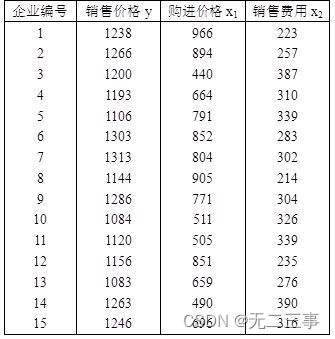
requirement :
(1) Calculation y And x1、y And x2 The correlation coefficient between , Is there any evidence that the sales price and the purchase price 、 There is a linear relationship between selling price and selling expense ?
(2) Based on the above results , Do you think it is effective to predict the sales price by using the purchase price and selling expenses ?
(3) use Excel Regression , And test whether the linear relationship of the model is significant (α=0.05).
(4) Explain the judgment coefficient R2, Conclusions and problems (2) Whether it's consistent with ?
(5) Calculation x1 And x2 The correlation coefficient between , What does the result mean ?
(6) Whether there is multicollinearity in the model ? What suggestions do you have for the model ?
Explain :(1) from Excel Of “CORREL” Coefficient of function calculation
![]()
![]()
The test statistics are :
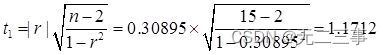
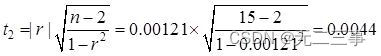
take α=0.05,t0.05/2(15-2)=2.160. Because the test statistics t1=1.1712<tα/2=2.160,t2=0.0044<tα/2=2.160. Therefore, there is no evidence that the sales price and the purchase price 、 There is a linear relationship between selling price and selling expense .
(2) Because there is no evidence that the sales price and the purchase price 、 There is a linear relationship between selling price and selling expense , Therefore, it is useless to predict the sales price by using the purchase price and sales expenses .
(3) from Excel Output regression results , As shown in the table .
Regression results
Analysis of variance
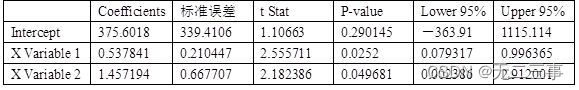
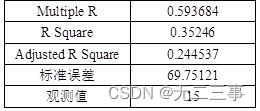
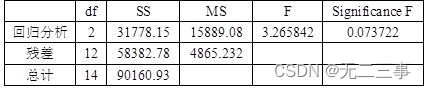
So the regression equation is :y=375.6018+0.5378x1+1.4572x2
because Significance F=0.073722>α=0.05, The linear relationship is not significant .
(4)R2=35.25%,Ra2=24.45%, It shows that the sales price is in the total variation , The proportion explained by the estimated regression equation of sales is 24.45%, It shows that the linear relationship is not significant , Conclusions and problems (2) Agreement .
(5) from Excel Of “CORREL” Coefficient of function calculation
![]()
The two independent variables are highly negatively correlated .
(6) Because the two independent variables are highly negatively correlated , Therefore, there is multicollinearity in the model , It is suggested to eliminate an independent variable from the model .
边栏推荐
- Uibutton status exploration and customization
- Intel oneapi - opening a new era of heterogeneity
- What language should I learn from zero foundation. Suggestions
- Xray and Burp linked Mining
- SystemVerilog discusses loop loop structure and built-in loop variable I
- How to understand the difference between technical thinking and business thinking in Bi?
- 7-7 7003 combination lock (PTA program design)
- Wu Enda's latest interview! Data centric reasons
- Lintcode logo queries the two nearest saplings
- sqqyw(淡然点图标系统)漏洞复现和74cms漏洞复现
猜你喜欢
SystemVerilog discusses loop loop structure and built-in loop variable I
Middleware vulnerability recurrence Apache
An unhandled exception occurred when C connected to SQL Server: system Argumentexception: "keyword not supported:" integrated
Hackmyvm target series (2) -warrior
内网渗透之内网信息收集(五)
Intranet information collection of Intranet penetration (4)
HackMyvm靶机系列(2)-warrior
小程序web抓包-fiddler
HackMyvm靶机系列(6)-videoclub
HackMyvm靶機系列(3)-visions
随机推荐
HackMyvm靶机系列(6)-videoclub
The most popular colloquial system explains the base of numbers
7-8 7104 Joseph problem (PTA program design)
Detailed explanation of three ways of HTTP caching
Apache APIs IX has the risk of rewriting the x-real-ip header (cve-2022-24112)
7-14 error ticket (PTA program design)
Harmonyos application development -- address book management system telmanagesys based on listcontainer [phonebook][api v6]
[MySQL table structure and integrity constraint modification (Alter)]
攻防世界MISC练习区(SimpleRAR、base64stego、功夫再高也怕菜刀)
Lintcode logo queries the two nearest saplings
Always of SystemVerilog usage_ comb 、always_ iff
Feature extraction and detection 14 plane object recognition
Ucos-iii learning records (11) - task management
This article explains in detail how mockmvc is used in practical work
Middleware vulnerability recurrence Apache
《统计学》第八版贾俊平第四章总结及课后习题答案
[issue 18] share a Netease go experience
内网渗透之内网信息收集(五)
Hackmyvm target series (5) -warez
Xray and Burp linked Mining