当前位置:网站首页>Statistics, 8th Edition, Jia Junping, Chapter 11 summary of knowledge points of univariate linear regression and answers to exercises after class
Statistics, 8th Edition, Jia Junping, Chapter 11 summary of knowledge points of univariate linear regression and answers to exercises after class
2022-07-06 14:31:00 【No two or three things】
Catalog
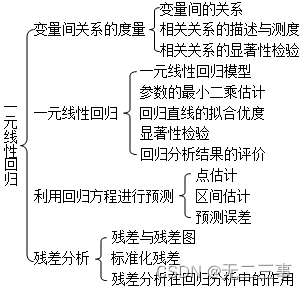
One 、 Knowledge framework
Two 、 After-school exercises
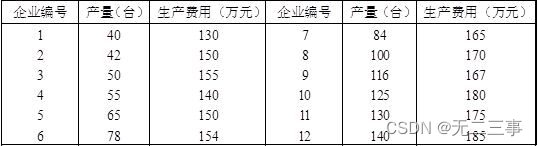
1 Randomly selected from a certain industry 12 companies , The data of output and production cost are shown in the table .
requirement :
(1) Draw a scatter chart of output and production cost , Judge the relationship between the two .
(2) Calculate the linear correlation coefficient between output and production cost .
(3) Test the significance of the correlation coefficient (α=0.05), And explain the strength of the relationship between the two .
Explain :(1) Draw a scatter plot , As shown in the figure .
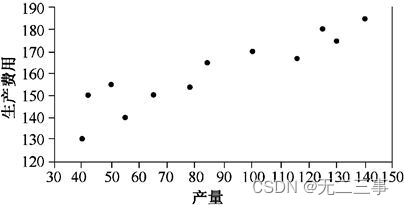
As can be seen from the scatter diagram , There is a positive linear correlation between output and production cost .
(2) Let the output be a variable X, Production cost is variable Y. It can be calculated from the data in the table :
x=85.42y=160.08
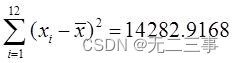
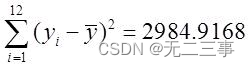
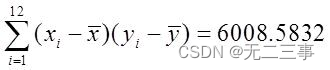
Therefore, the correlation coefficient is :
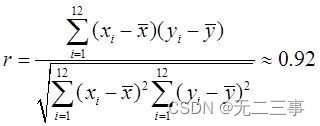
(3) First put forward the following assumptions :H0:ρ=0;H1:ρ≠0. Calculate the value of the test statistic :
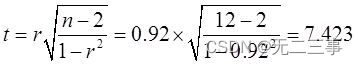
When α=0.05 when ,t0.05/2(12-2)=2.228. Because the value of the test statistic t=7.423>tα/2=2.228, So reject the original assumption . It shows that the linear relationship between output and production cost is significant .
2 Random sampling 10 Home airline , The flight punctuality rate and the number of customer complaints in the recent year were investigated , The data obtained are shown in the table .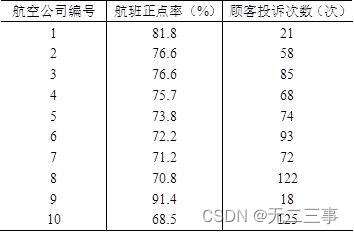
requirement :
(1) Draw a scatter plot , Explain the relationship form between the two .
(2) The flight punctuality rate is used as the independent variable , The number of customer complaints is the dependent variable , Find the estimated regression equation , And explain the significance of regression coefficient .
(3) Test the significance of the regression coefficient (α=0.05).
(4) If the flight punctuality rate is 80%, Estimate the number of customer complaints .
(5) The flight punctuality rate is 80% when , Number of customer complaints 95% Confidence interval and prediction interval .
Explain :(1) Draw a scatter plot , As shown in the figure .
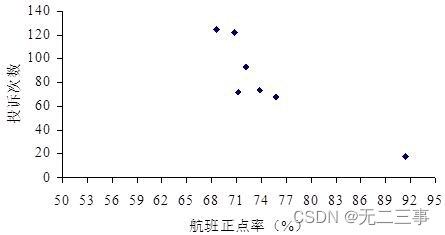
As can be seen from the scatter diagram , There is a negative linear correlation between the flight punctuality rate and the number of complaints .
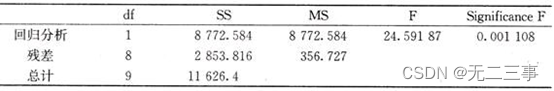
(2) from Excel The output regression results are shown in table 1 Shown .
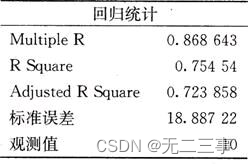
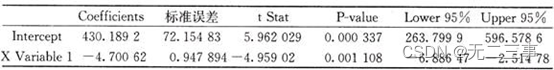
The linear regression equation is :y=430.1892-4.7x
Regression coefficient β1=-4.7 It means that every increase in flight punctuality 1%, The number of customer complaints decreased on average 4.7 Time .
(3) Regression coefficient test P- value =0.001108<α=0.05, Rejection of null hypothesis , The regression coefficient is significant .
(4)y80=430.1892-4.7×80=54.1892( Time ).
(5) When α=0.05 when ,t0.05/2(10-2)=2.306,se=18.88722.
The confidence interval is :
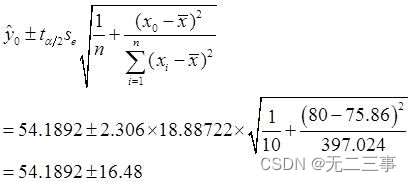
namely (37.7,70.7).
The prediction interval is :
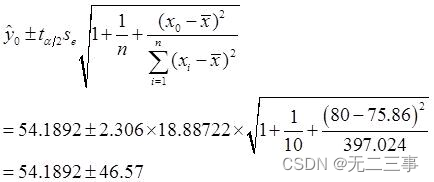
namely (7.6,100.8).
3 Here is 20 Data of office occupancy rate and monthly rent per square meter in cities , As shown in the table .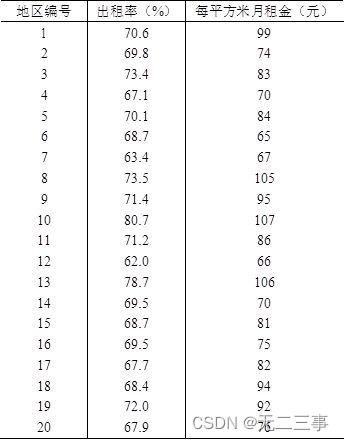
Let monthly rent be the independent variable , The occupancy rate is a dependent variable , use Excel Regression , And explain and analyze the results .
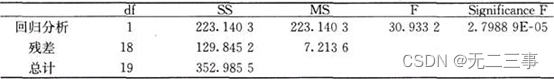
Explain :Excel Output regression results , As shown in the table .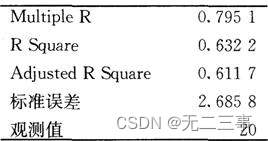
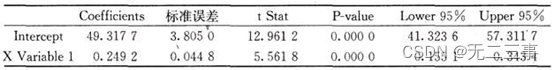
From the table, we can get , The linear regression equation is :Y=49.3177+0.2492X
Regression coefficient β1=0.2492 Express : Every increase in monthly rent 1 element , The rental rate increased on average 0.2492%.
R2=63.22%, It shows that the proportion explained by the linear relationship between rental rate and rent in the variation of rental rate is 63.22%, The fitting degree of the regression equation is general .
Estimate the standard error se=2.6858 Express , When using monthly rent to predict the rental rate , The average prediction error is 2.6858%, It shows that the prediction error is not big .
From the analysis of variance table ,Significance F=2.79889E-05<α=0.05, That is, the linear relationship of the regression equation is significant . Regression coefficient test P- value =0.0000<α=0.05, It shows that the regression coefficient is significant , That is, monthly rent is a significant factor affecting the rental rate .4 An automobile manufacturer wants to know about advertising expenses (x) Sales volume (y) Influence , Collected the past 12 Relevant data of . Relevant results obtained through calculation , As shown in the table .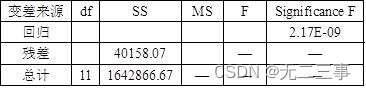
requirement :
(1) Complete the above ANOVA table .
(2) How much of the decline in car sales is caused by changes in advertising expenses ?
(3) What is the correlation coefficient between sales volume and advertising expenses ?
(4) Write the estimated regression equation and explain the practical significance of the regression coefficient .
(5) Test the significance of the linear relationship (α=0.05).
Explain :(1) Fill in the ANOVA table ,
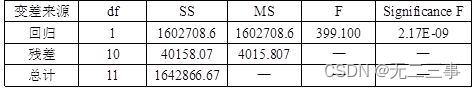
(2) According to the variance analysis table, the determination coefficient is :
R2=SSR/SST=1602708.6/1642866.67=97.56%
This shows that the deterioration of car sales includes 97.56% It is caused by the change of advertising expenses .
(3) The correlation coefficient can be obtained from the square root of the determination coefficient :
![]()
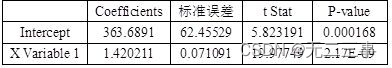
(4) The regression equation is :y=363.6891+1.420211x
Regression coefficient β1=1.420211 It means that every increase in advertising expenses 1 A unit of , Sales increased on average 1.420211 A unit of .
(5) because Significance F=2.17E-09<α=0.05, It shows that the linear relationship between advertising expenses and sales volume is significant .
5 Establish the regression equation according to the data in the table , Calculated residual error 、 Determination factor R2, Estimate the standard error se, And analyze the fitting degree of the regression equation .![]()
Explain :Excel The output regression results are shown in the table .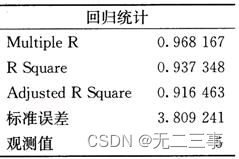
From the table, we can get , The linear regression equation is :y=13.6254+2.3029x
The regression coefficient shows ,x Every increase 1 A unit of ,y Average increase 2.3029 A unit of ; Determination factor R2=93.74%, It shows that the fitting degree of the regression equation is high ; Estimate the standard error se=3.8092, Show that x To predict the y The time average prediction error is 3.8092.
6 Random sampling 7 A supermarket , The data of advertising expenses and sales are shown in the table .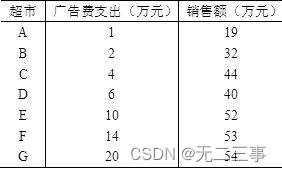
requirement :
(1) Advertising expenses are used as independent variables x, Sales volume is the dependent variable y, Find the estimated regression equation .
(2) Test whether the linear relationship between advertising expenses and sales is significant (α=0.05).
(3) Draw about x Residual diagram of , What do you think about the error term ε Are your assumptions satisfied ?
(4) You choose this model , Or looking for a better model ?
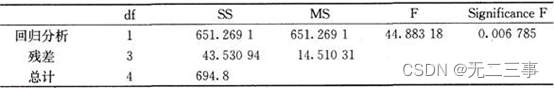
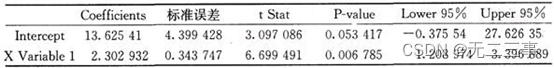
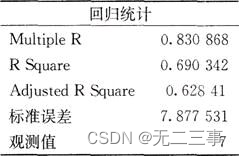
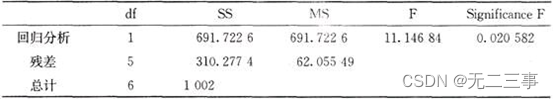
Explain :(1)Excel The output regression results are shown in the table .
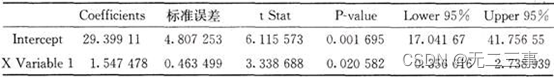
It can be concluded from the table , The estimated regression equation is :y=29.3991+1.547478x
(2) because Significance F=0.020582<α=0.05, Therefore, the linear relationship between advertising expenses and sales is significant .
(3) Draw about x Residual diagram of , As shown in the figure .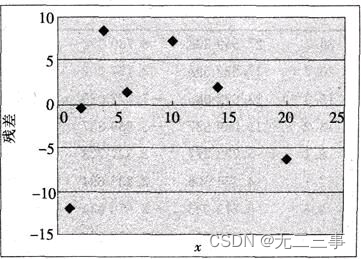
As can be seen from the residual diagram , About the error term ε The assumption of does not hold .
(4) Although the linear relationship passed the significance test , But from the residual diagram , About x And y The assumption that there is a linear relationship between them is still questionable . Therefore, the nonlinear model can be considered .
边栏推荐
- 《统计学》第八版贾俊平第九章分类数据分析知识点总结及课后习题答案
- 7-11 mechanic mustadio (PTA program design)
- [experiment index of educator database]
- 网络基础之路由详解
- Wu Enda's latest interview! Data centric reasons
- Hcip -- MPLS experiment
- 《英特尔 oneAPI—打开异构新纪元》
- The difference between layer 3 switch and router
- Experiment five categories and objects
- Always of SystemVerilog usage_ comb 、always_ iff
猜你喜欢
内网渗透之内网信息收集(二)
Database monitoring SQL execution
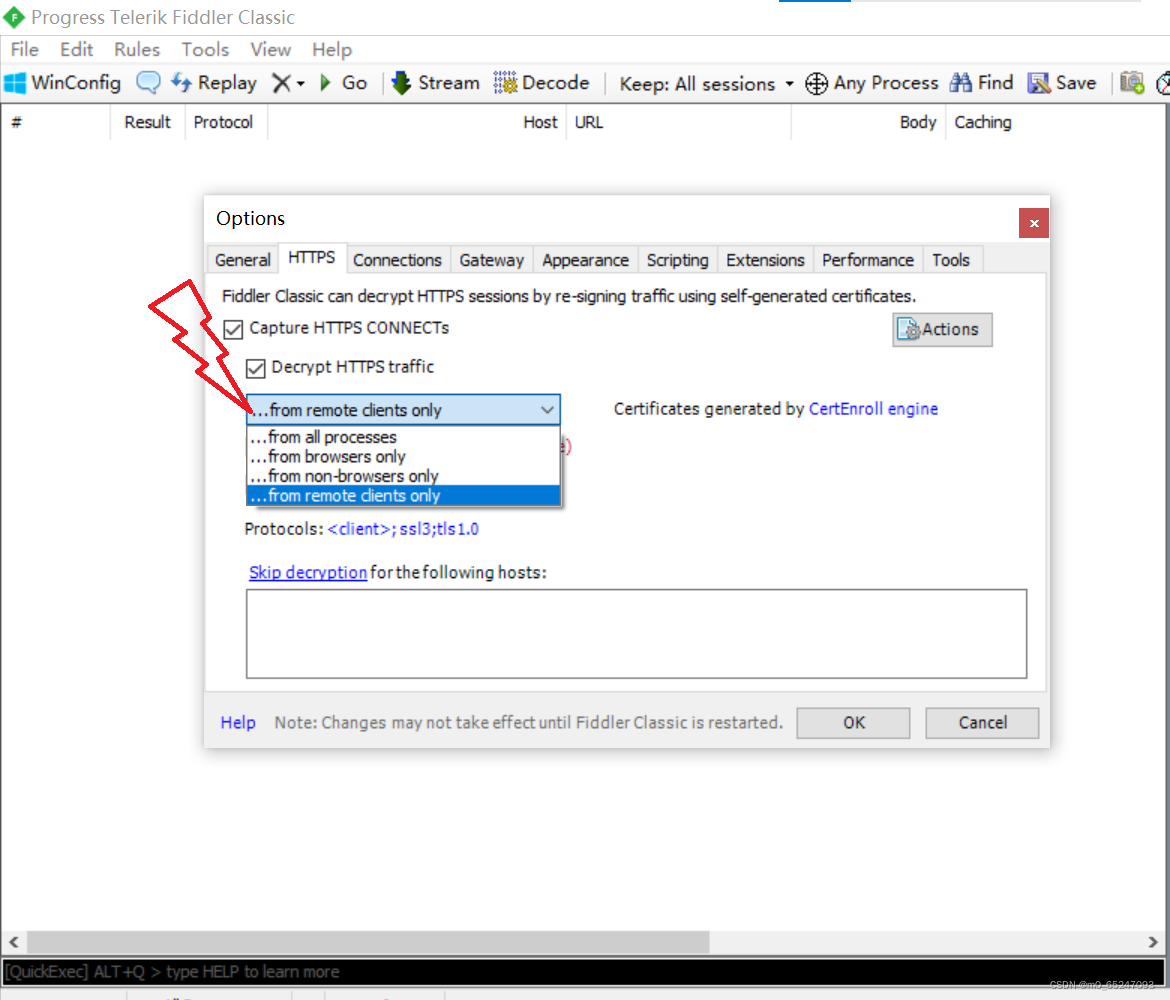
小程序web抓包-fiddler
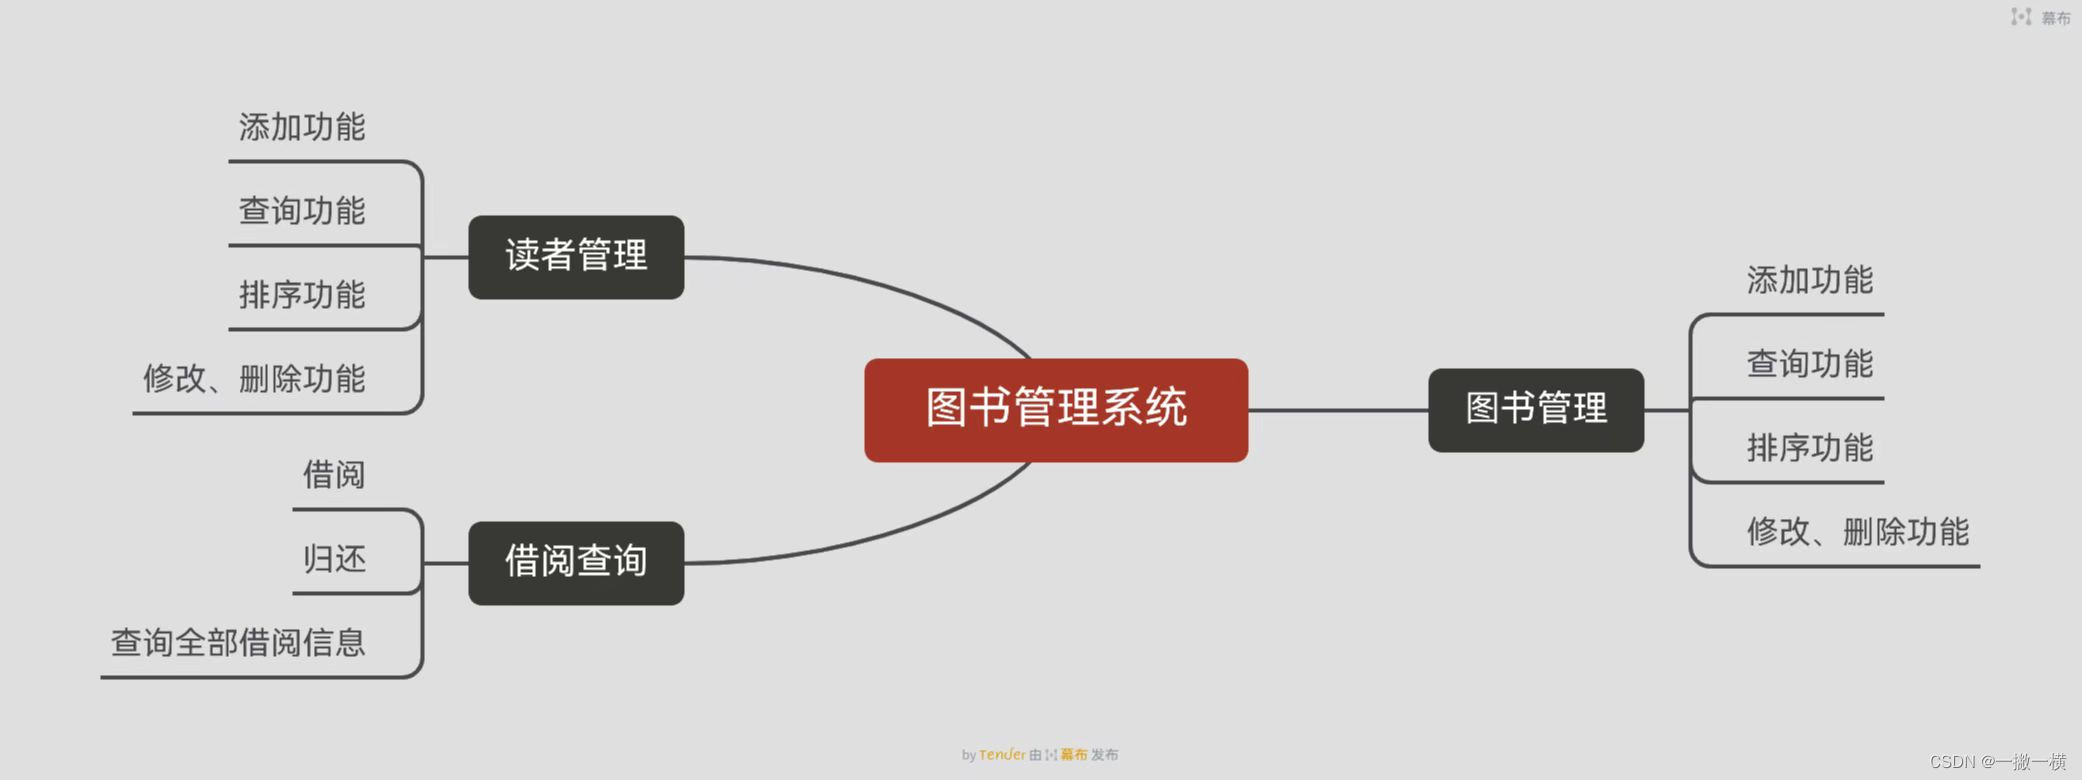
Library management system

List and data frame of R language experiment III
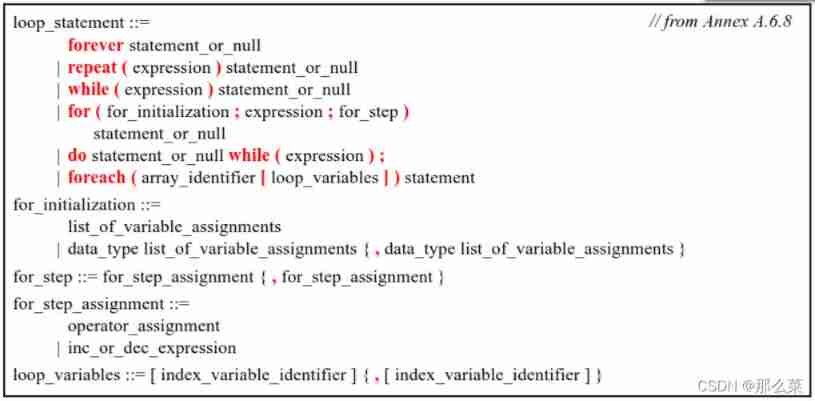
SystemVerilog discusses loop loop structure and built-in loop variable I
Hackmyvm Target Series (3) - vues
Chain team implementation (C language)
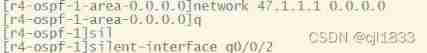
Hcip -- MPLS experiment
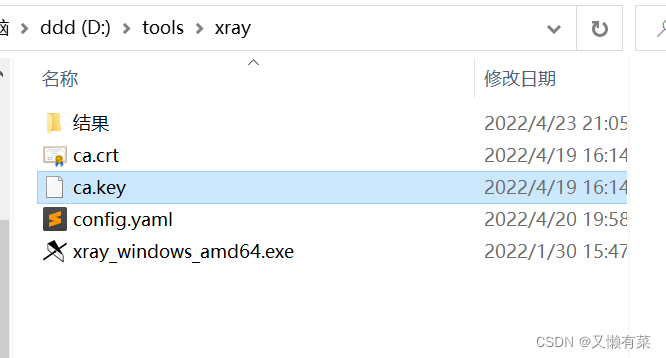
xray与burp联动 挖掘
随机推荐
Build domain environment (win)
Xray and burp linkage mining
攻防世界MISC练习区(gif 掀桌子 ext3 )
Tencent map circle
HackMyvm靶機系列(3)-visions
7-9 make house number 3.0 (PTA program design)
Record an API interface SQL injection practice
Hackmyvm target series (7) -tron
Statistics 8th Edition Jia Junping Chapter 14 summary of index knowledge points and answers to exercises after class
7-15 h0161. Find the greatest common divisor and the least common multiple (PTA program design)
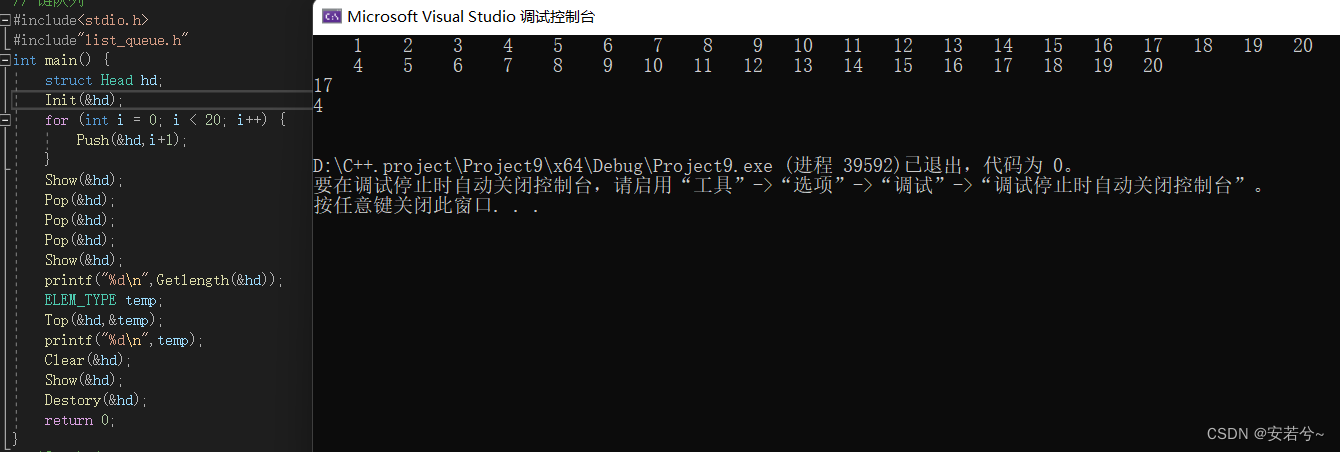
Circular queue (C language)
7-1 output all primes between 2 and n (PTA programming)
[VMware abnormal problems] problem analysis & Solutions
《统计学》第八版贾俊平第一章课后习题及答案总结
浅谈漏洞发现思路
Ucos-iii learning records (11) - task management
Constants, variables, and operators of SystemVerilog usage
C language file operation
7-4 hash table search (PTA program design)
[issue 18] share a Netease go experience