当前位置:网站首页>[software reverse analysis tool] disassembly and decompilation tool
[software reverse analysis tool] disassembly and decompilation tool
2022-07-05 03:37:00 【Black zone (rise)】
Catalog
(2)IDA Main window introduction
(3) Basic debugging operations
One 、IDA
1.1、 brief introduction :
There are many disassembly tools , But the most powerful 、 The most widely used one is IDA Pro( abbreviation IDA). In Decompilation , The best decompile tool is IDA Self contained Hex-Ray plug-in unit ( Shortcut keys are F5), So here's the main introduction IDA.
IDA The file types supported are very rich , In addition to including PE Format 、ELF Out of format , It also includes DOS、Mach-O、.NET Etc . meanwhile IDA It also supports dozens of different processor architectures .
1.2、 Usage method :
(1)IDA Open file
Through the menu bar File→Open, Select the target program to analyze ,IDA The program is automatically recognized as x86_64 Of ELF cheng
order , Just click OK that will do .(2)IDA Main window introduction
(1) Toolbar area : Commonly used tools
(2) Navigation belt : Load a linear view of the address space of the file , It presents the entire address range of the binary . Different colors represent different types of files
(3) Function window : Shows all functions
(4) Data display window : The data display window includes : Disassembly window 、 Decompile window 、 Import table window 、 Export table window 、 Structure window, etc .
(5) Message window : yes IDA Output information , Equivalent to a console output device .
(3)IDA Basic use of
(1) Function correction
With push ebp/rbp The address at the beginning of the instruction is the starting address of a function , But sometimes IDA It is not correctly recognized as a function , At this point, you need to manually create it as a function , After creating a function, you can usually decompile the function
The way to create a function is : At the assembly code of the starting address of the function , Click on the right , choice Create Function, The corresponding shortcut key is P
(2) Instruction correction
stay IDA in , If some instructions or data are identified incorrectly , It can be corrected manually ( Such as using shortcut keys D Can be converted into data , Using shortcut keys C Can be converted into code )
(3) Data correction
In the data segment , The length of a data may be 1、2、4 or 8 byte , At this point, you can use the shortcut key D To change to the corresponding type .
If a part of the data segment is a string , however IDA Not correctly identified , Then you can use the shortcut keys A Convert it to a ASCII character string .
(4) Comment information and rename
Modify the variables or function names in the program to help readers understand , Click on the right , choice Rename You can rename .
Besides , You can also add comments to the code , Using shortcut keys “;” You can add comments in the Disassembly window , Using shortcut keys “/” You can add comments in the decompile window .
For some programs written for uncommon processor architectures , You can turn on the automatic annotation function of assembly . The opening method is to check Auto comments
(5) Binary program's patch
Convert the corrected extra bytes into empty instructions (nop Instructions , The corresponding bytecode is 0x90), In this way, the function can be decompiled normally
Select... In the menu bar Edit→Patch program→Change byte Function modification
(6) Cross reference
IDA There are two kinds of : Code cross reference and data cross reference .
Code cross references :
Used to indicate that one instruction transfers control to another instruction . Cross reference through code , You can know which instructions call which function or instruction .
Data cross references :
Can be used to track how binary files access data . Through data cross reference , You can know which instructions access which data .
Two 、 The debugger
2.1、 brief introduction :
In the field of reverse analysis , Analysts will also use relevant debugging tools to analyze the behavior of the software and verify the results
The two most basic features of the debugger are : Breakpoint setting and code tracking .
Breakpoints allow the user to select a line of code anywhere in the program , Once the program runs to this line , Then it will instruct the debugger to pause the program , And display the current status of the program .
Code tracing allows users to track the execution of a program while it is running , Tracing means that every time a program executes an assembly code, it pauses , And allow users to observe or even change the state of the program .
Common debuggers include :Ollydbg、x64dbg、Windbg and gdb etc. . among ,Ollydbg Can debug Windows Under the 32 Bit user mode program ;x64dbg Can debug Windows Under the 64 Bit application ;Windbg It is a debugger provided by Microsoft , It can debug user programs and system kernel , however GUI The interface is relatively less friendly ;gdb yes Linux The main debugger used under the system . The following mainly explains the most commonly used Ollydbg and gdb.
2.2、Ollydbg
Ollydbg( abbreviation OD) yes Windows A user mode debugging tool with visual interface .OD have GUI Interface , Very easy to get started . Special Edition Ollydbg, This version has powerful anti debugging function .
(1) main interface
Disassembly window : After loading the program , The window shows the source code of the program after disassembly .
Information window : During dynamic debugging , The information of each register of the current code line will be displayed in the window , perhaps API Function call 、 Jump and other information , It can be used to help understand the operation of the register of the current code line .
Data window : By default, the data in memory is displayed in hexadecimal .
register window : Dynamic display CPU Contents of each register , Including data registers 、 Pointer and index register 、 Segment register , And the program status word register in the control register .
Stack window : Show the contents of the stack . call API Function or subroutine , You can know the passed parameters and other information by looking at the stack .
Command line : In the original OD There is no command line in , This is an external plug-in , It is convenient to input commands during dynamic debugging . Generally speaking , It is mainly to input the command of next breakpoint or clearing breakpoint .“ Command line command .txt” There are detailed commands and
Function is introduced , You can see .(2) Breakpoint operation
During dynamic debugging, the program should be interrupted at the key code , Then conduct dynamic analysis according to the displayed dynamic information , This requires breaking points in the program . Breakpoints have general breakpoints 、 Memory breakpoints 、 Hardware breakpoints and other types , Generally, breakpoints are the most commonly used breakpoints .
1) General breakpoints
Generally, the first byte at the input breakpoint address is used INT3 Instructions instead . When the program runs to the breakpoint address , Will execute INT3 Instructions ,Ollydbg Will catch this instruction and interrupt .There are generally two ways to lower breakpoints :
F2 key : Press... Above the line of code in the Disassembly window F2 Key can be broken . Next
After breakpoint , The virtual address will be in red . If you want to cancel the breakpoint , Then click on the F2 key
that will do .Command line mode : You can use... On the command line bp Command the breakpoint . Such as bp 4516B8
perhaps bp MessageBoxA.2) Memory breakpoints
There are two kinds of memory breakpoints : Memory access breakpoints and memory write breakpoints .OD Only one memory breakpoint is allowed at a time .
Memory access breakpoints : When the program is running, the selected memory data will be called OD interrupt . According to this feature , When cracking the trace, just drop the breakpoint in the key data memory , You can know where and when the program uses the tracking data . This function is very helpful for the tracking of some complex algorithms . In terms of cracking , The generation of a registration code must be calculated from some key data or raw data , So these key data must be used in memory , Then the memory access breakpoint is a better interrupt method .
Memory write breakpoint : When the program is running, writing data to the selected memory address will be OD interrupt . According to this feature , When cracking, you can track when a key data is generated , Where is the generated code segment . therefore , If you don't know the origin of a key data , You can use memory to write breakpoints to view the core of the calculation .
If you want to set a memory breakpoint , You can select part of the memory data in the hexadecimal column in the data window , Then click the right mouse button to display the function menu , choice “ The breakpoint ”, Then select a memory access breakpoint or a memory write breakpoint .
3) hardware breakpoint
Hardware breakpoints do not change the program code to INT3 Instructions , If some programs have self checking function , You can use hardware breakpoints . The method of lower interrupt is the same as that of lower memory breakpoint , There are three ways : Hardware access 、 Hardware write 、 Hardware execution . At most, you can set 4 Hardware breakpoints .
(3) Code trace operation
Code tracking operations mainly include some common shortcut keys , For dynamic tracking of programs .
F9 key : After loading the program , Press F9 Key to run the program .
F7 key : One step tracking ( Stepping into ), That is, code by code , encounter Call Statement will be followed by the code at the call address of the statement or the called function code .
F8 key : One step tracking ( Step over ), encounter Call Statement will not follow .
F4 key : Execute to the selected code .
ALT+F9 key : Execute to program airspace , If you enter the referenced DLL Module airspace , You can use this shortcut key to quickly return to the program airspace .
2.3、gdb
(1) brief introduction :
gdb It's a by GNU Open source organization released 、UNIX/Linux Under the operating system 、 Command line based 、 Powerful program debugging tool .
(2) install
In most Linux Distribution in ,gdb Are installed by default , without , So in Ubuntu You can go through apt-get Installation
The installation command is :sudo apt-get install gdb
If you need to debug other architectures elf Program , You can install gdb-multiarch
The installation command is :sudo apt-get install gdb-multiarch
Besides ,gdb There are also many plug-ins , Such as peda、gef、pwndbg etc. , The plug-in here provides some additional commands , Facilitate the reverse analysis of the program . These plug-ins can be found in Github Found on the , Install according to the installation instructions . chart 9-9 by gdb Installed peda The interface that runs after the plug-in , Can pass peda help Command view new commands .
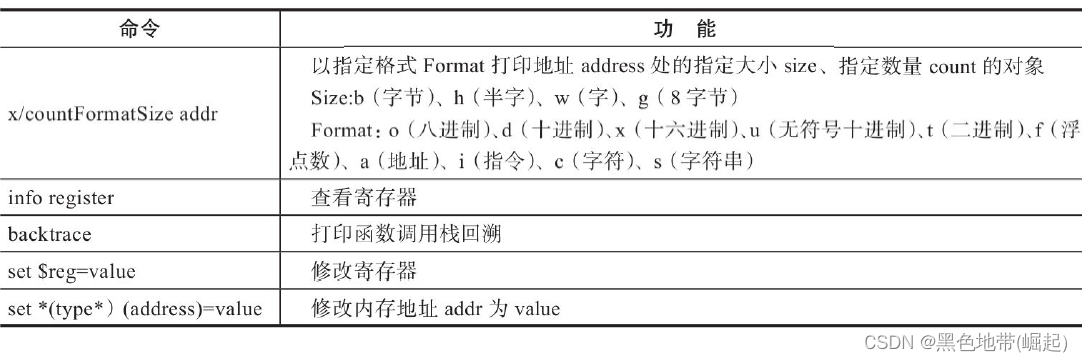
(3) Basic debugging operations
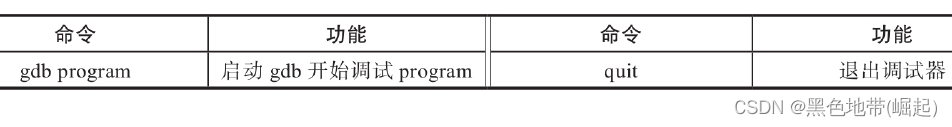
1) Start and end gdb
2) General Command
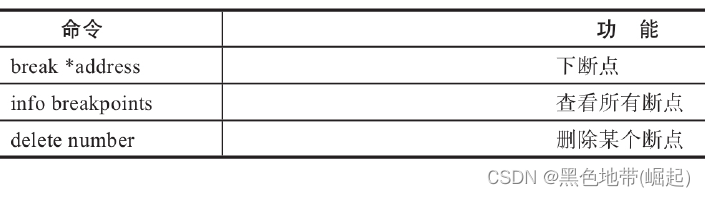
3) The breakpoint
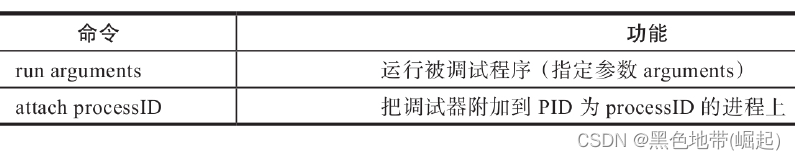
4) Run debug target
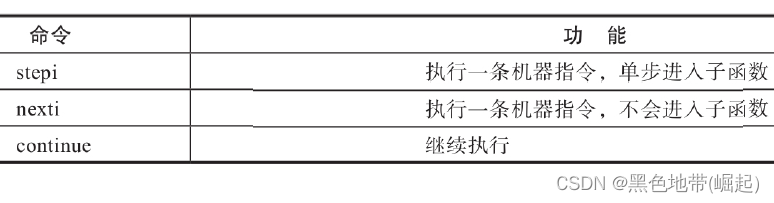
5) View and modify program status
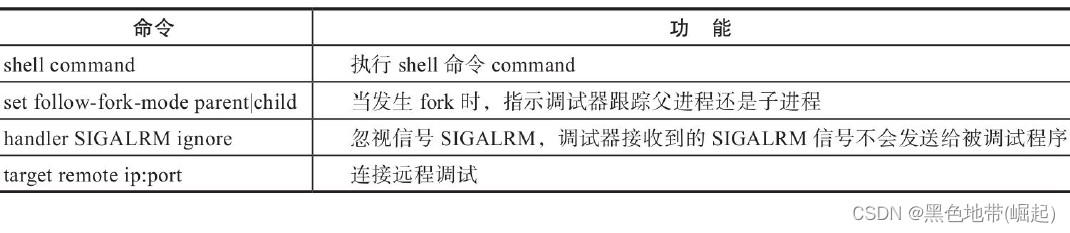
6) Other commands
3、 ... and 、Trace Class tools
3.1、 brief introduction :
Monitor and record the operation of the program in a certain way , Then the analyst can get some dynamic information of the program from the recorded information
eg:strace The tool is Linux The next tool to track system calls . A more powerful Trace Class tools :Qira.
3.2、Qira
The official homepage is http://qira.me/, By famous hackers geohot Development . After installation , Run the command qira-s/bin/ls, This is equivalent to 4000 Port open service /bin/ls, Use nc localhost 4000 You can connect . meanwhile , It also turns on 3002 Of Web port , Pictured 9-10 Shown .
browser Web The interface mainly includes :
1) The leftmost two columns are fork, Each time nc Once in a row 4000 port , One more fork. chart 9-10 The two columns in indicate that they have been linked twice 4000 port .
2) On the top of the right is 4 Boxes , Corresponding to the following information .
113 Indicates the second 113 Orders .
0 It means the first one 0 individual fork.
0x80484c7 Represents the address of the instruction .
0xf6fff01c The address of the data .
3) Below on the right are the instructions for program operation 、 register 、 Memory 、 Called system call
Use, etc. .
边栏推荐
- Multi person online anonymous chat room / private chat room source code / support the creation of multiple chat rooms at the same time
- Design and practice of kubernetes cluster and application monitoring scheme
- Azkaban actual combat
- 【软件逆向-基础知识】分析方法、汇编指令体系结构
- Monitoring web performance with performance
- Share the newly released web application development framework based on blazor Technology
- Performance of calling delegates vs methods
- [untitled]
- Is there any way to change the height of the uinavigationbar in the storyboard without using the UINavigationController?
- In MySQL Association query, the foreign key is null. What if the data cannot be found?
猜你喜欢

Pat class a 1160 forever (class B 1104 forever)

el-select,el-option下拉选择框

Devtools的简单使用
51 independent key basic experiment
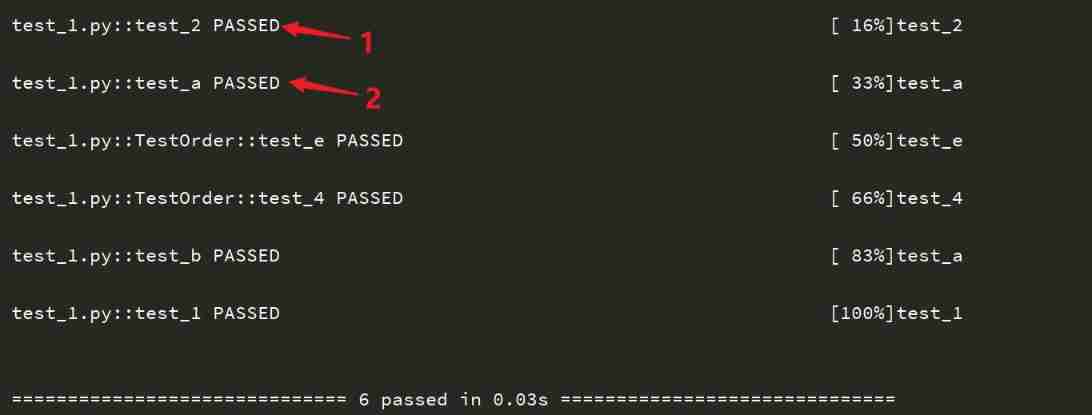
Pytest (4) - test case execution sequence

Why are there fewer and fewer good products produced by big Internet companies such as Tencent and Alibaba?
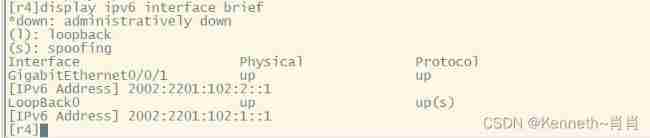
IPv6 experiment
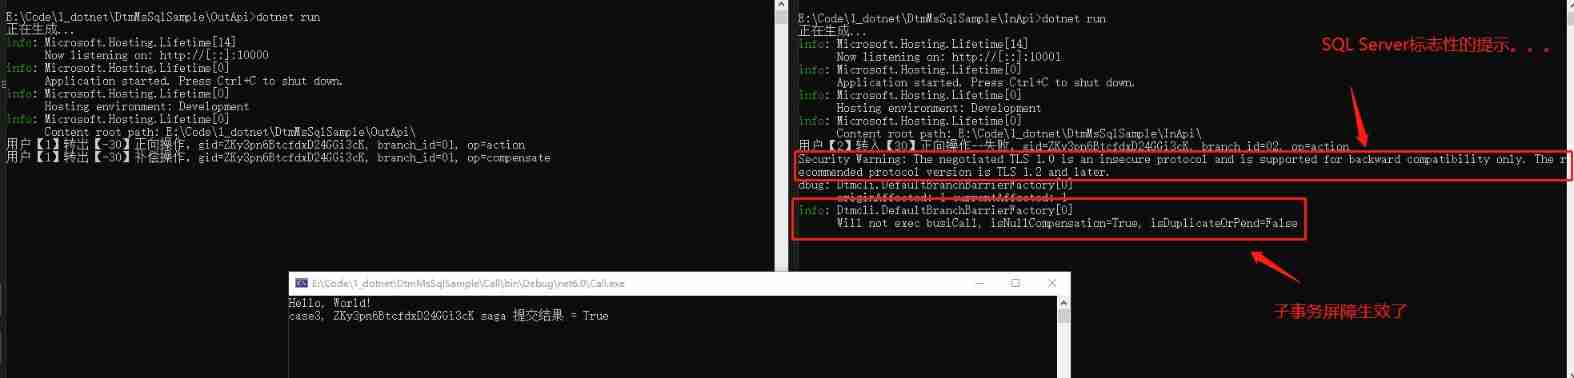
Talk about the SQL server version of DTM sub transaction barrier function
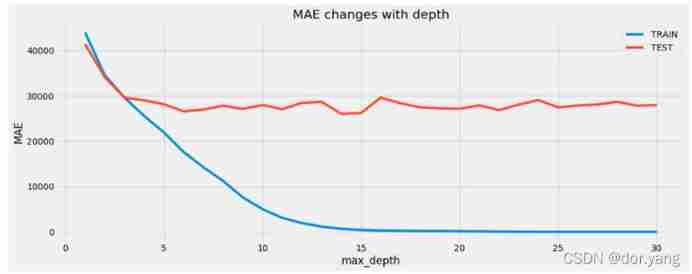
Machine learning experiment report 1 - linear model, decision tree, neural network part
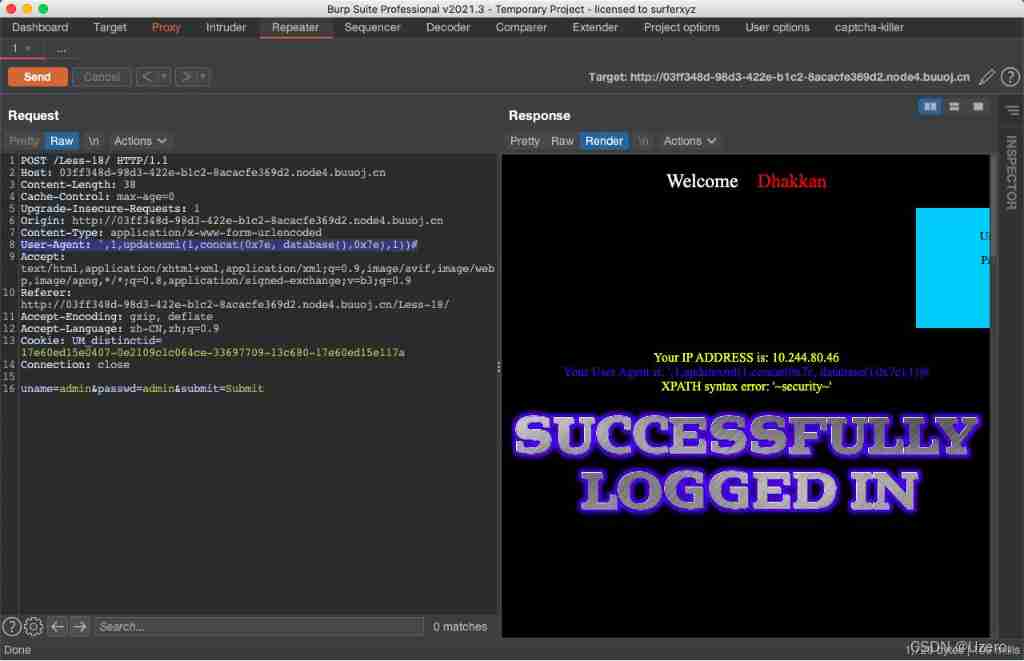
SQL injection exercise -- sqli Labs
随机推荐
Yuancosmic ecological panorama [2022 latest]
Huawei MPLS experiment
【PHP特性-变量覆盖】函数的使用不当、配置不当、代码逻辑漏洞
Binary heap implementation (priority queue implementation)
Leetcode42. connect rainwater
Basic authorization command for Curl
Logstash、Fluentd、Fluent Bit、Vector? How to choose the appropriate open source log collector
Six stone programming: advantages of automated testing
Kuboard
About MySQL database connection exceptions
Clean up PHP session files
Sqoop command
Azkaban overview
Sqoop installation
KVM virtualization
Usage scenarios and solutions of ledger sharing
[web Audit - source code disclosure] obtain source code methods and use tools
The perfect car for successful people: BMW X7! Superior performance, excellent comfort and safety
[105] Baidu brain map - Online mind mapping tool
Azkaban installation and deployment