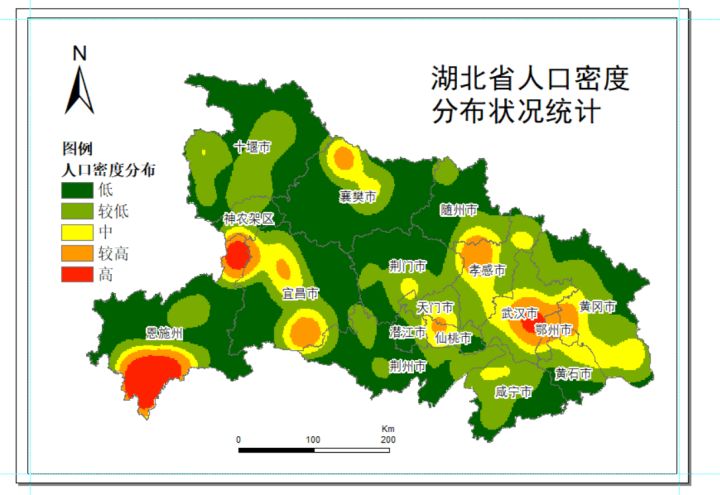
This article takes Hubei Province as an example , Make population density distribution map ; The province used here is Hubei Province 、 City 、 Vector data of administrative divisions at three levels of counties , And settlement data , Then carry out density analysis .
The sample data comes from , Web site address
Sample data download link :
First step Prepare the data
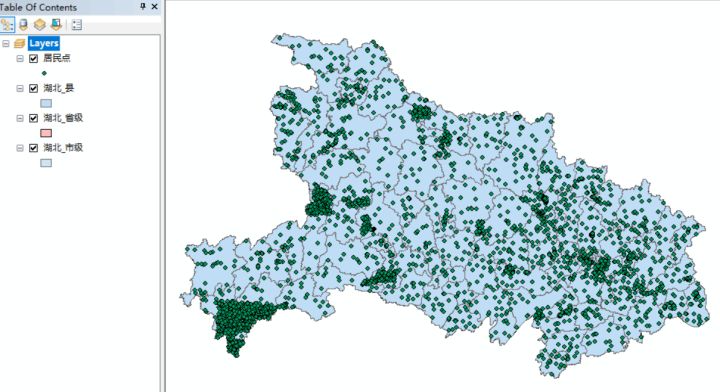
The following is the data of administrative divisions and settlements at all levels in Hubei Province
The second step Symbolic display
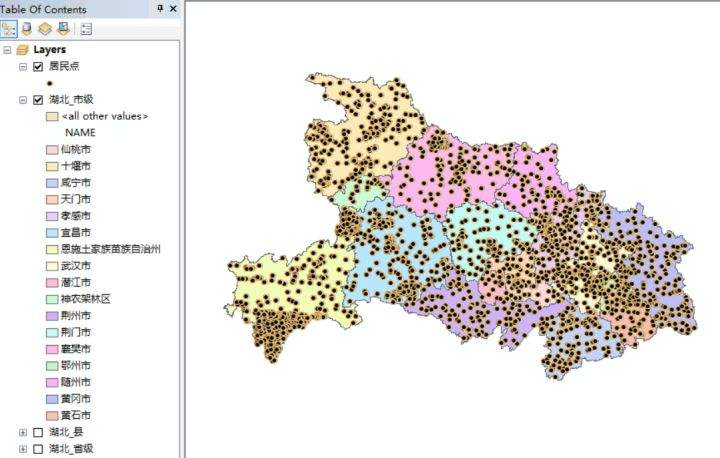
Simply symbolize the vector data of municipal administrative divisions in Hubei , Look at the loaded data , as follows :
The third step Add labels
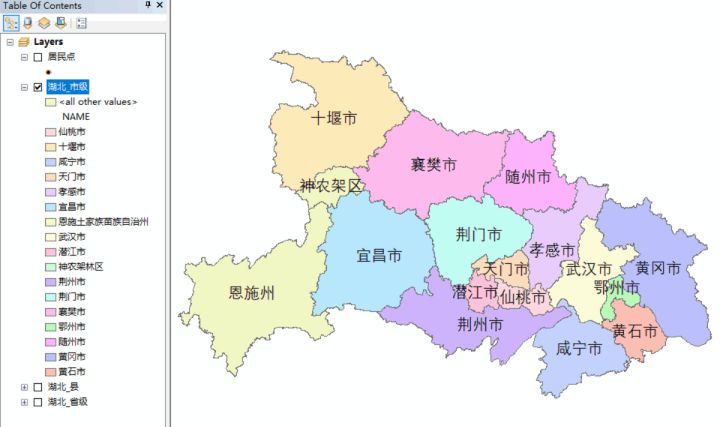
First, add a label to the municipal administrative divisions of Hubei Province
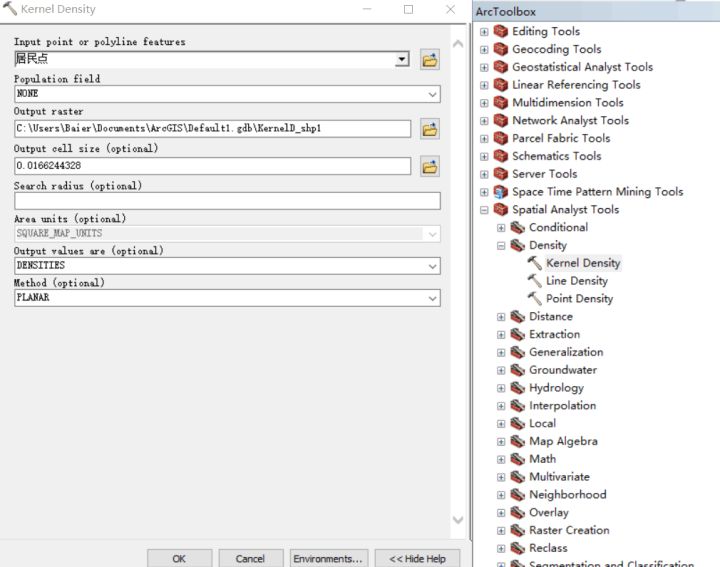
Step four Nuclear density analysis
Here are the key steps !
Of course, you can also use point density for analysis , What is the difference between the analysis of nuclear density and point density ? Baidu! !
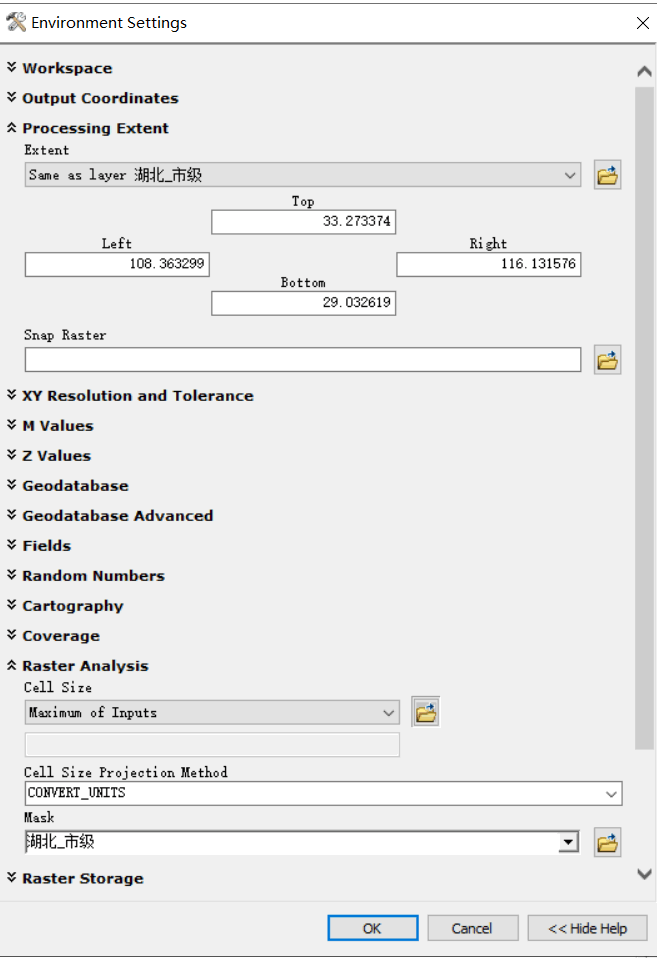
Environment settings :( To ensure data accuracy , Don't get into trouble )
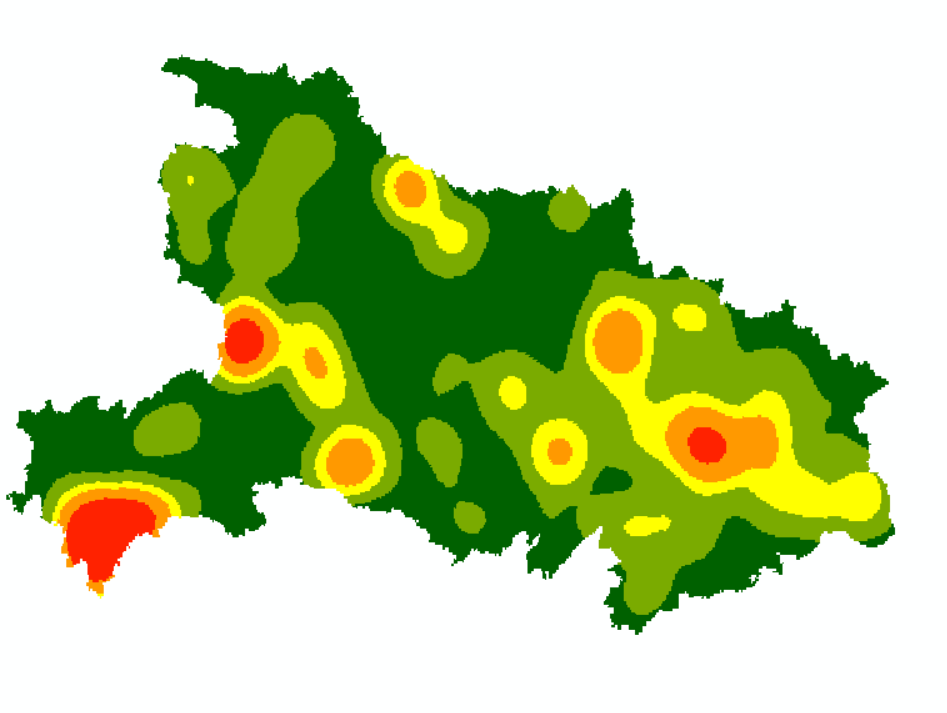
Nuclear density analysis completed , as follows :
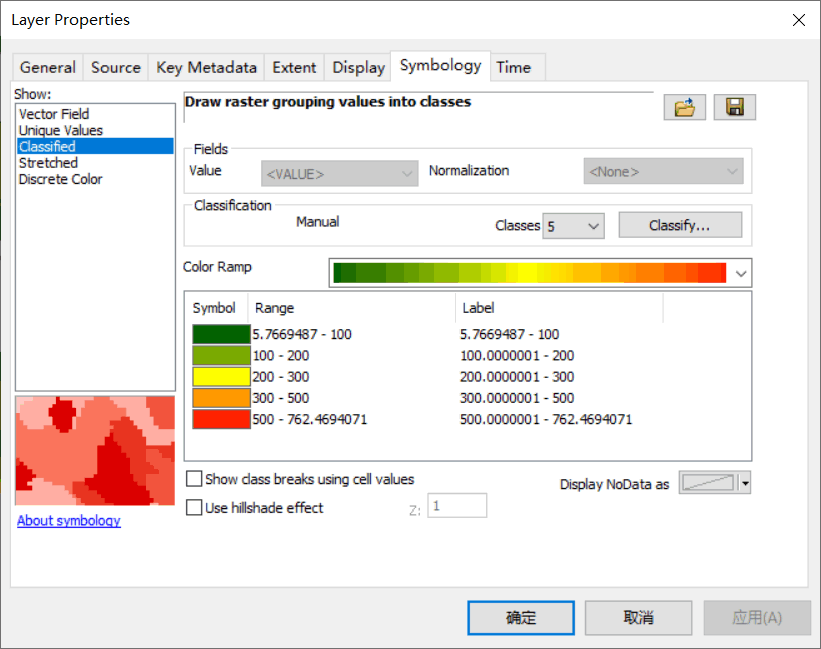
Step five Nuclear density symbolization
Let the results of nuclear density analysis show better !
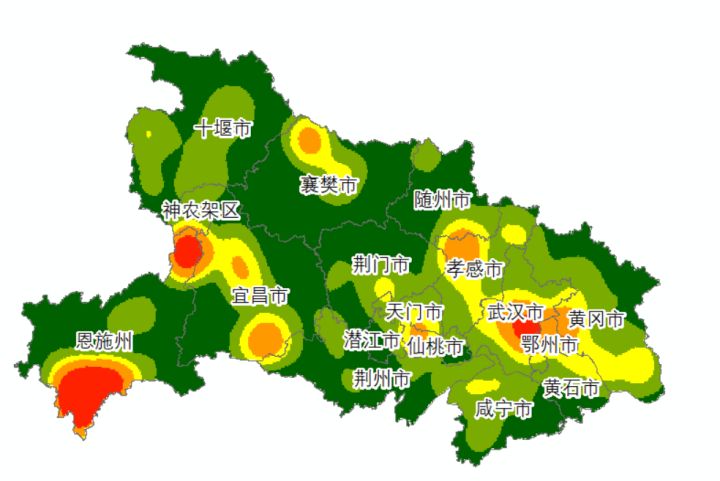
Step six Overlay layer display
take mark 、 Municipal boundary Add to the nuclear density analysis result data .
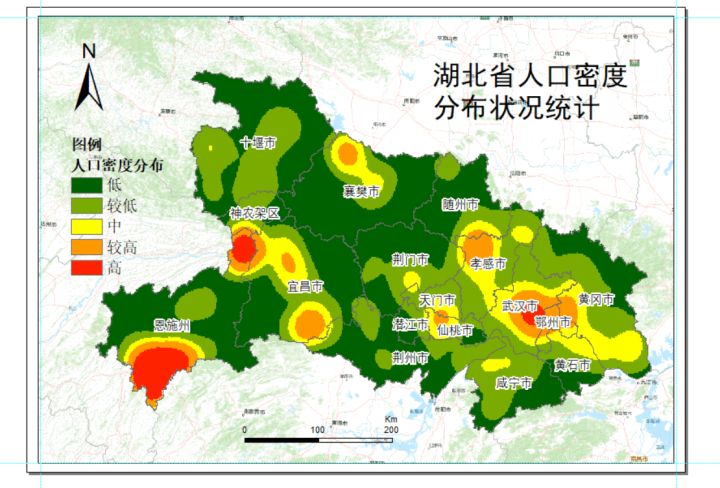
Step seven Add base map
Add a map to look good ! You may not add !
